Structural identification of LL
The alkaloid was brown powder, showed positive reaction with dragendorff's reagent. The MS spectrum showed an ion peak at m/z 314.2 [M+H]+ (Figure 1A). The 1H-NMR (400 MHz, CD3OD) spectrum displayed signals attributable to two phenyl rings at δH 7.95 (1H, brs, H-11), 6.68 (1H, s, H-8), 6.54 (1H, s, H-3), and two methoxyls at δH 3.83 (3H, s, 10-OCH3), 3.55 (3H, s, 1-OCH3), three methanes at δH 3.30 (1H, m, H-5a), 2.96 (1H, m, H-5b), 2.70 (1H, m, H-7a), 2.58 (1H, m, H-7b), 2.96 (1H, m, H-4a), 2.67 (1H, m, H-4b) and one methine at δ 3.73 (1H, m, H-6a) (Figure S1A). These data indicated that this compound was an aporphine alkaloid. The above elucidation was confirmed by its 13C-NMR (100 MHz, CD3OD) spectral data at δC: 151.0 (C-2), 147.8 (C-10), 147.2 (C-9), 144.5 (C-1), 130.3 (C-7a), 129.8 (C-3a), 127.7 (C-3b), 126.0 (C-11b), 124.7 (C-11a), 115.8 (C-8), 115.5 (C-11), 112.8 (C-3), 60.3 (10-OCH3), 56.5 (1-OCH3), 54.8 (C-6a), 43.5 (C-5), 36.4 (C-7), 28.5 (C-4) . After carefully comparing its 1D-NMR and 2D NMR data with literature, the compound was determined to be Laurolitsine, and its molecular structure was depicted in Figure 1A. The purity of LL was determined to be over 98% by our research group using HPLC method (Figure 1 B). With this extractive craft, we got 8.0g LL from the 100 kilogram dried stem barks of L. glutinosa.
Modulation of body weight, food intake and water uptake by LL
In order to observe the effects of LL on the body weight, food and water intake of db/db mice, we chose 50, 100 and 200 mg·Kg-1 as the low, medium and high dose of LL in mice. The body weight of mice was measured every five days, it was found that the body weight of mice in C57BL/KsJ group was almost stable, but the body weight of mice in the model and administration group increased gradually over time.
Besides, the body weight of the model mice was significantly higher than that of the C57BL/KsJ group, but there was no significant difference between the model group and LL group (Figure 2A). In addition, food intake and drinking water tended to be stable in the control group. However, food intake decreased slightly and drinking water increased slightly in the model and administration group (Figure 2B and 2C). Therefore, the treatment of LL had a little effect on the body weight, diet and drinking water of mice.
Effects of LL treatment on blood glucose
Then, we evaluated the effect of LL on blood glucose in db/db model mice. Results showed that the fasting blood glucose of mice in the model group was significantly higher than that of the control group (P < 0.001). Compared with the model group, LL could reduce the level of fasting blood glucose in a dose-dependent manner (P < 0.001). The hypoglycemic effect of 200 mg·Kg-1 was similar to that of metformin group (Figure 3A). Moreover, oral glucose tolerance test showed that the blood glucose of the model group still remained a high level after glucose administration, indicating that the glucose tolerance and the ability to consume glucose were decreased, while LL could significantly reduce the level of blood glucose after 30min (P < 0.001), and the effect of 200mg/kg was similar to that of metformin. In addition, insulin tolerance test showed that LL treatment can also rapidly reduce the level of blood glucose and improve insulin resistance after insulin injection (Figure 3B and 3C). These data demonstrate that LL has the potential capability to restore the disorder of glucose metabolism in db/db diabetic mice.
The effects of LL on lipid metabolism of serum and liver
At the same time, we detected the effect of LL on lipid metabolism in serum and liver of mice in each group. The results showed that 200mg·Kg-1 LL treatment showed a trend to normalize hyperlipidemia, especially on decreasing the levels of TC (P < 0.05) and TG (P < 0.01) in serum and liver, LDL-c (P < 0.01) and HDL-c (P < 0.01) in serum, but failed to reach statistical significance on restoring the level of LDL-c and HDL-c in liver (Figure 4A-H). Metformin treatment also had no significant effect on liver HDL-c (Figure 4H). Taken together, these results verified that LL treatment effectively ameliorated hyperlipidemia in db/db mice.
The effects of LL on liver function
Besides, we also examined the effect of LL on liver function. Histopathological profile of mice in C57BL/KsJ group showed normal hepatocytes with well cytoplasm, prominent nucleus, nucleolus and central vein with no sign of inflammation or necrosis in these mice. In model group, liver sections showed hepatocyte nuclear pyknosis, hepatic cord degeneration, inflammatory infiltration, and marked necrosis. Treatment with LL at 50, 100 and 200 mg·Kg-1 dose showed reduction of necrosed area and inflammatory infiltrates (Figure 5A and 5D). These results indicated that LL could ameliorate the severity of liver damage in db/db mice. Serum aminotransferase such as alanine aminotransferase (ALT) and aspartate aminotransferase (AST) are commonly used as an indicator for liver disease (Yang, Chen et al. 2020). In the present study a significant elevation of serum ALT and AST activities (P < 0.05) were observed in model mice. However, LL at 50, 100 and 200 mg·Kg-1 dose prevented these elevations in a dose-dependent manner, in which mice treated with 200 mg·Kg-1 LL group showed a significant reduction in serum ALT and AST (Figure 5B and 5C). In addition, it is well-established that the serum lactate level indicates glycolytic status in mice. The liver has a strong ability to remove blood lactic acid, so the level of blood lactic acid will increase in varying degrees when liver function is impaired. Mice in model group showed much higher levels of serum lactate than mice in C57BL/KsJ group (Figure 5E), indicating a lower glycolytic rate in model mice, LL at 100 and 200mg·Kg-1 dose can reduce serum levels of lactate but no significant difference. In summary, these results show that LL can somewhat recover liver injury in db/db mice.
The effects of LL on diversity of gut microbiota
The gut microbiotas play essential roles in the incidence and development of many diseases such as obesity, hyperlipidemia and T2DM. To check the influence of LL on the gut microbes, we firstly assessed the diversity of the gut microbiota by 16S rDNA-based metagenomic analysis. The results showed that the Shannon, Simpson, inverse Simpson, Richness and Evenness in the model group were decreased significantly, but there was little effect on these indexes of α-diversity after LL treatment (Figure 6A-E). In addition, we observed the changes of β-diversity of intestinal flora by PCA (Figure 6F) and PCoA (Figure 6G) analysis. Compared with normal group, the intestinal flora of mice in the model group was almost isolated along the PC1 direction in PCA analysis (Figure 6F) and along the PCo1/2 directions in PCoA analysis (Fig. 6G). In summary, LL had slight effects on the diversity of intestinal flora.
The effects of LL on composition of gut microbiota
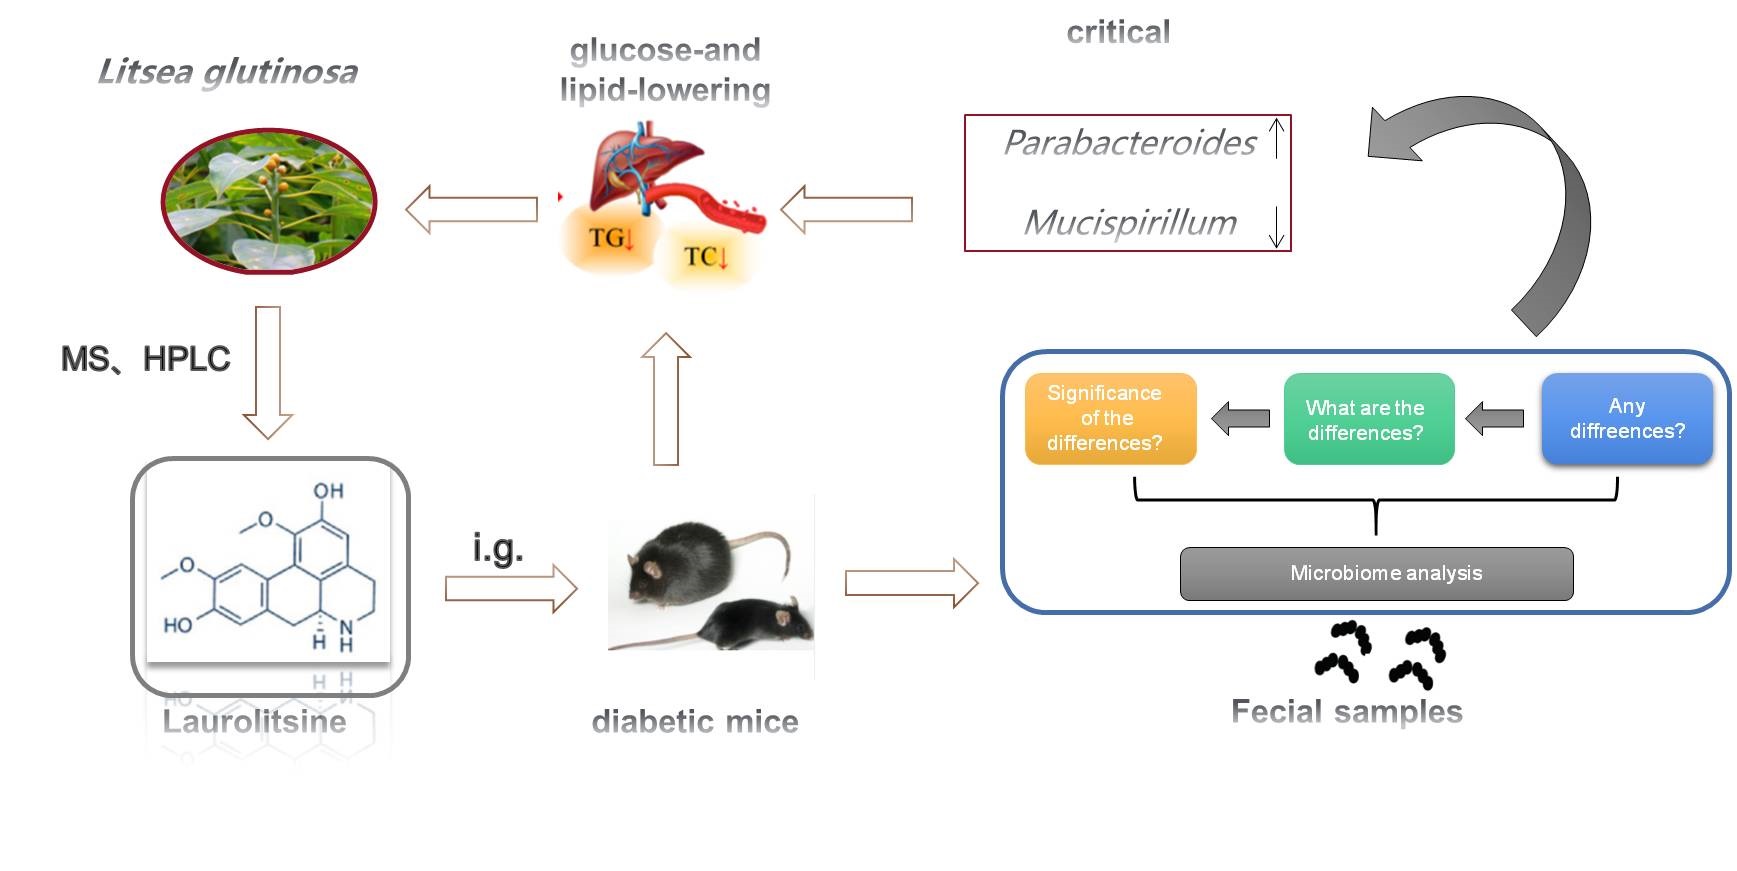
Taxonomic analysis also displayed a marked impact of LL on gut microbes (Figure 7). At the phylum level, compared with the normal group, Deferribacteres and Firmicutes increased and Bacteroidetes decreased in the model group, which could be reversed by the LL group. Moreover, LL treatment can also decrease Viruses_noname and increase Fusobacteria in mice feces (Figure 7A). The genus-level analysis showed that the genera in the model group with a significant decrease in abundance were Parabacteroides, Alphapapillomavirus and Clostridium, while the genera with a significant increase in abundance were Anaerotruncus, Escherichia and Mucispirillum, the administration of LL reversed these changes markedly (Figure 7B). At the species levels, oral administration of LL enriched Parabacteroides_unclassified, yet decreased Anaerotruncus_sp_G3_2012, Mucispirillum_schaedleri and Clostridium sp ASF502 with the same trend. Then we use linear discriminant analysis to more deeply characterize the microbiota alterations in LL-treated diabetic mice (Figure 7C). Genera with logarithmic LDA scores of >4.0 are plotted in Figure 7D, a circular cladogram based on the LEfSe results demonstrated differentially abundant taxa between three groups (Figure 7E). There were 15 taxa and 25 taxa with significant changes in the model and LL group. Overall, these results shows that Parabacteroides, Parabacteroides_unclassified, Mucispirillum, Mucispirillum_schaedleri could be the differential bacteria between model group and LL group.