TLR2 expression is linked to poor prognosis in BC patients
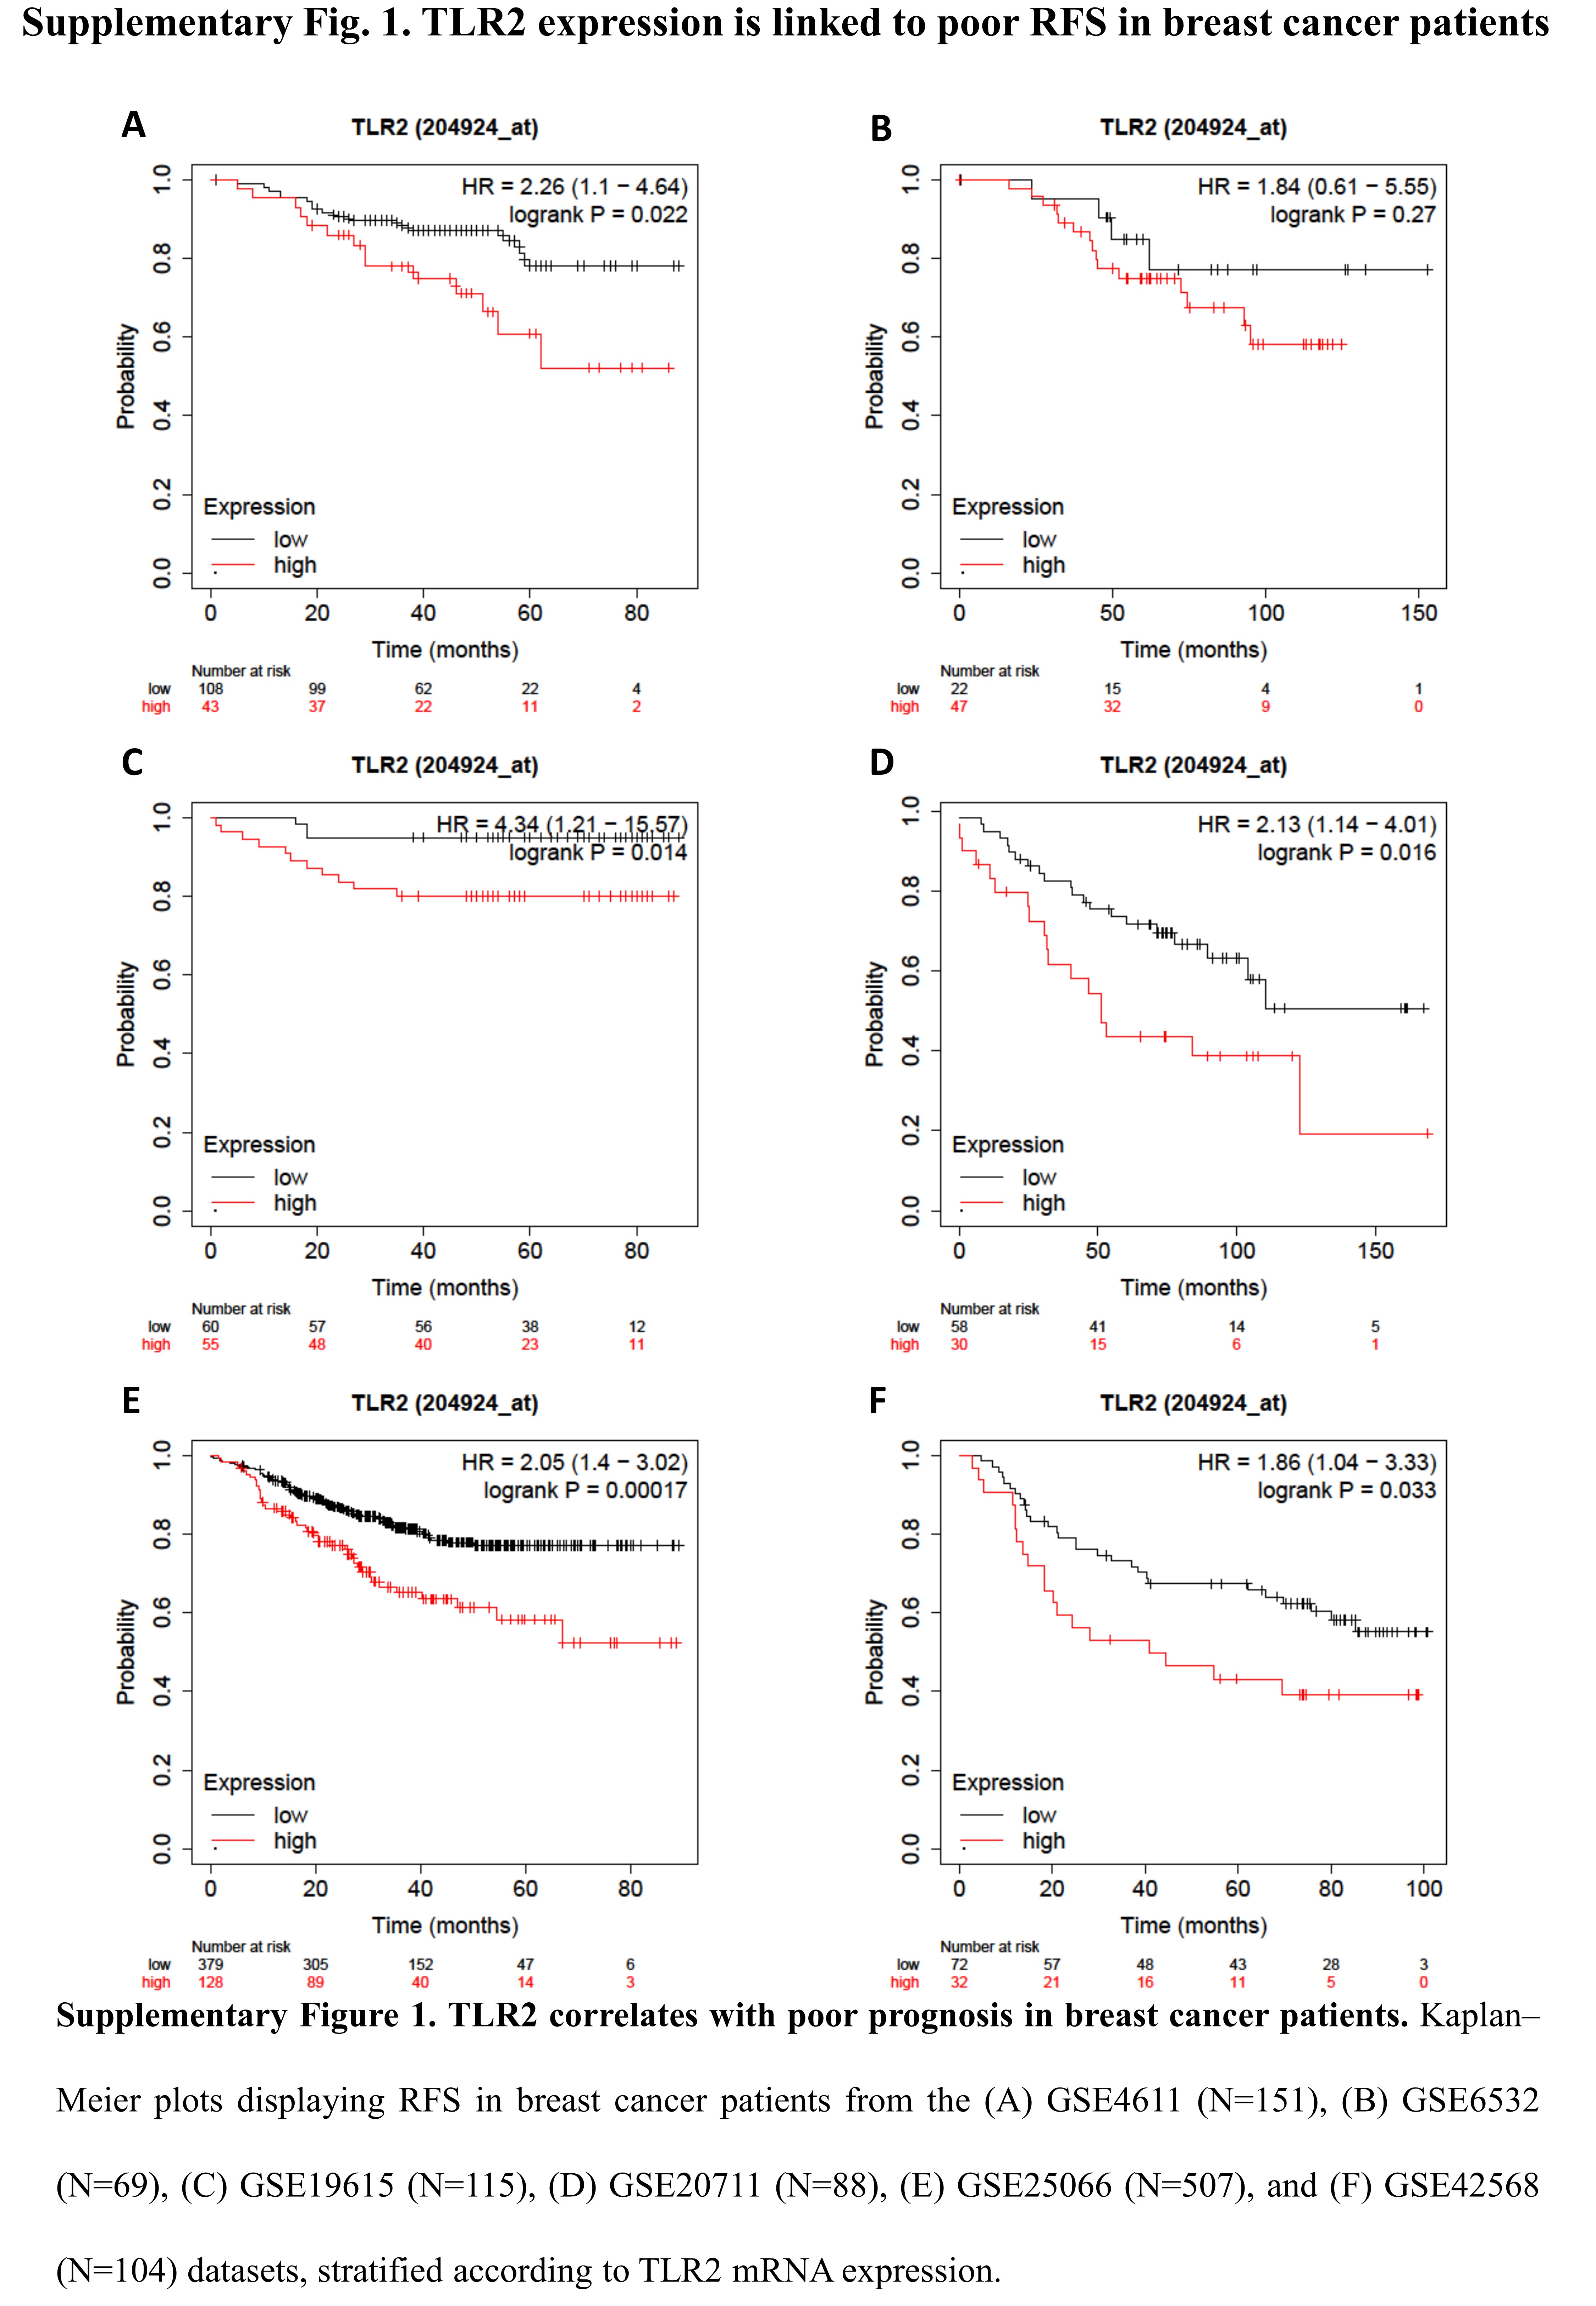
To investigate whether TLR2 expression correlates with prognosis in BC patients, we performed a meta-analysis on public gene-expression data from human breast tumors [15]. Patients with high TLR2 expression showed lower RFS (Fig. 1A and Supplementary Fig. 1) and OS (Fig. 1B) than those with low TLR2, suggesting that TLR2 may play a role in BC progression.
TLR2 deletion hinders HER2-driven mammary carcinogenesis
To study the role of TLR2 in mammary carcinogenesis and progression, we generated neuT-TLR2WT and neuT-TLR2KO mice, which carry the activated rat HER2/neu oncogene under the MMTV promoter and spontaneously develop mammary tumors. Tumor onset was significantly delayed in neuT-TLR2KO mice (Fig. 1C), which displayed significantly higher survival and a decrease in tumor multiplicity compared to neuT-TLR2WT mice (Fig. 1D-F). This was accompanied by a lower frequency of aldehyde dehydrogenase 1+ (Aldefluor+), Sca1+ and CD44+CD24- CSCs [28] in neuT-TLR2KO tumors than in neuT-TLR2WT (Fig. 1G-I). Moreover, the cells purified from neuT-TLR2KO tumors generated significantly fewer tumorspheres than those from neuT-TLR2WT (Fig. 1J), confirming that TLR2 promotes CSC survival and self-renewal, and plays a key role in HER2-driven mammary carcinogenesis.
TLR2 deletion alters Treg frequency without affecting other immune-cell populations
Since TLR2 is expressed on many immune cells [6], we assessed the percentage of the main immune cell types in the tumors, blood and spleens from neuT-TLR2KO and neuT-TLR2WT mice at the experimental endpoint. While no significant differences were observed in most of the myeloid and lymphoid populations (Fig. 2A, B, E, F, H, I) or in macrophage polarization (Fig. 2D), significantly lower Treg frequency was found in the tumors, blood, and spleens from neuT-TLR2KO mice (Fig 2C, G, J). The lower Treg frequency observed in neuT-TLR2KO was not caused by their lower tumor burden, as significantly lower levels of circulating Tregs were found in tumor-free TLR2KO than in TLR2WT mice (Fig. 2K). Moreover, Tregs express higher TLR2 levels than effector CD4+ T cells (Fig. 2L). Interestingly, when circulating T cells from tumor-bearing TLR2WT mice were activated in the presence of TLR2 activators, PGN-SA or HMGB1, the percentage of Tregs was significantly increased compared to the control (Fig. 2M), demonstrating that TLR2 directly promotes Treg expansion.
TLR2 promotes BC progression mostly via cancer-cell-intrinsic mechanisms
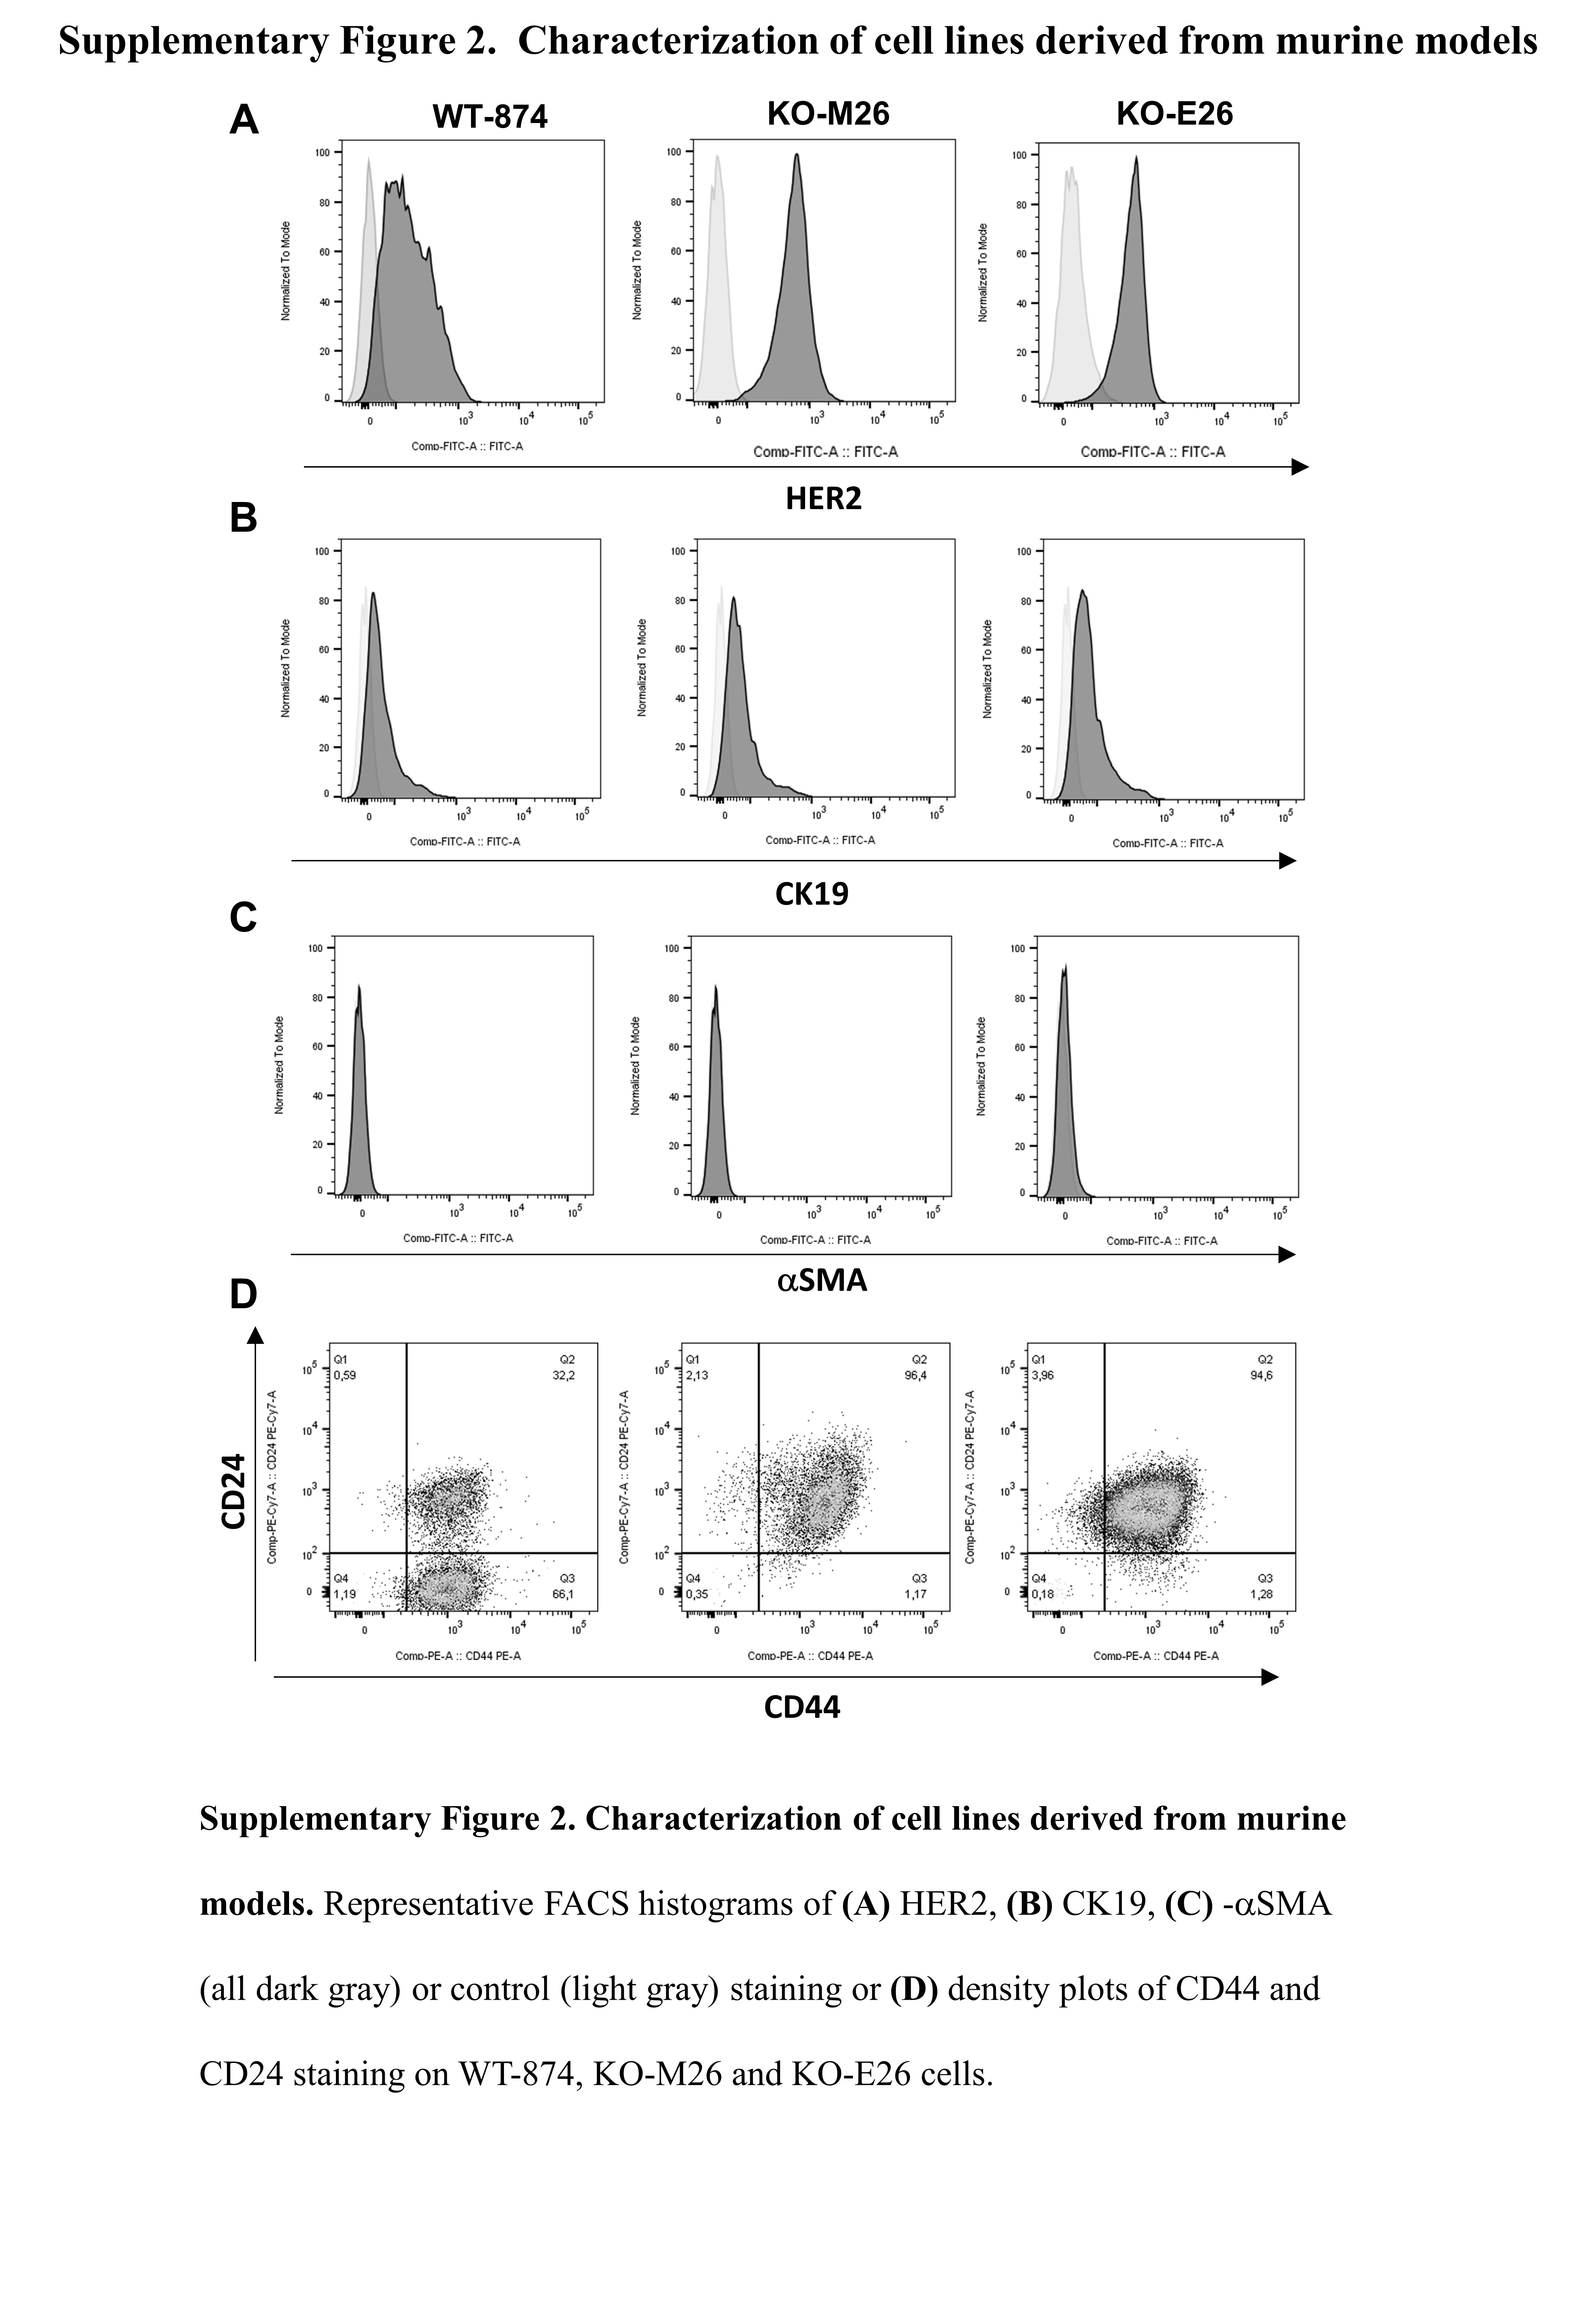
To assess whether TLR2 signaling provides the major contribution to tumor progression in cancer cells or whether other TLR2+ cells are involved, we generated cell lines from the primary tumors of neuT-TLR2WT and neuT-TLR2KO mice, named WT-874, and KO-M26 and KO-E26, respectively. All these cells express HER2 and the luminal marker cytokeratin 19 (CK19) but are negative for the basal marker alpha smooth muscle actin (α-SMA) (Supplementary Figure 2A-C) and proliferate at a similar rate in-vitro (not shown).
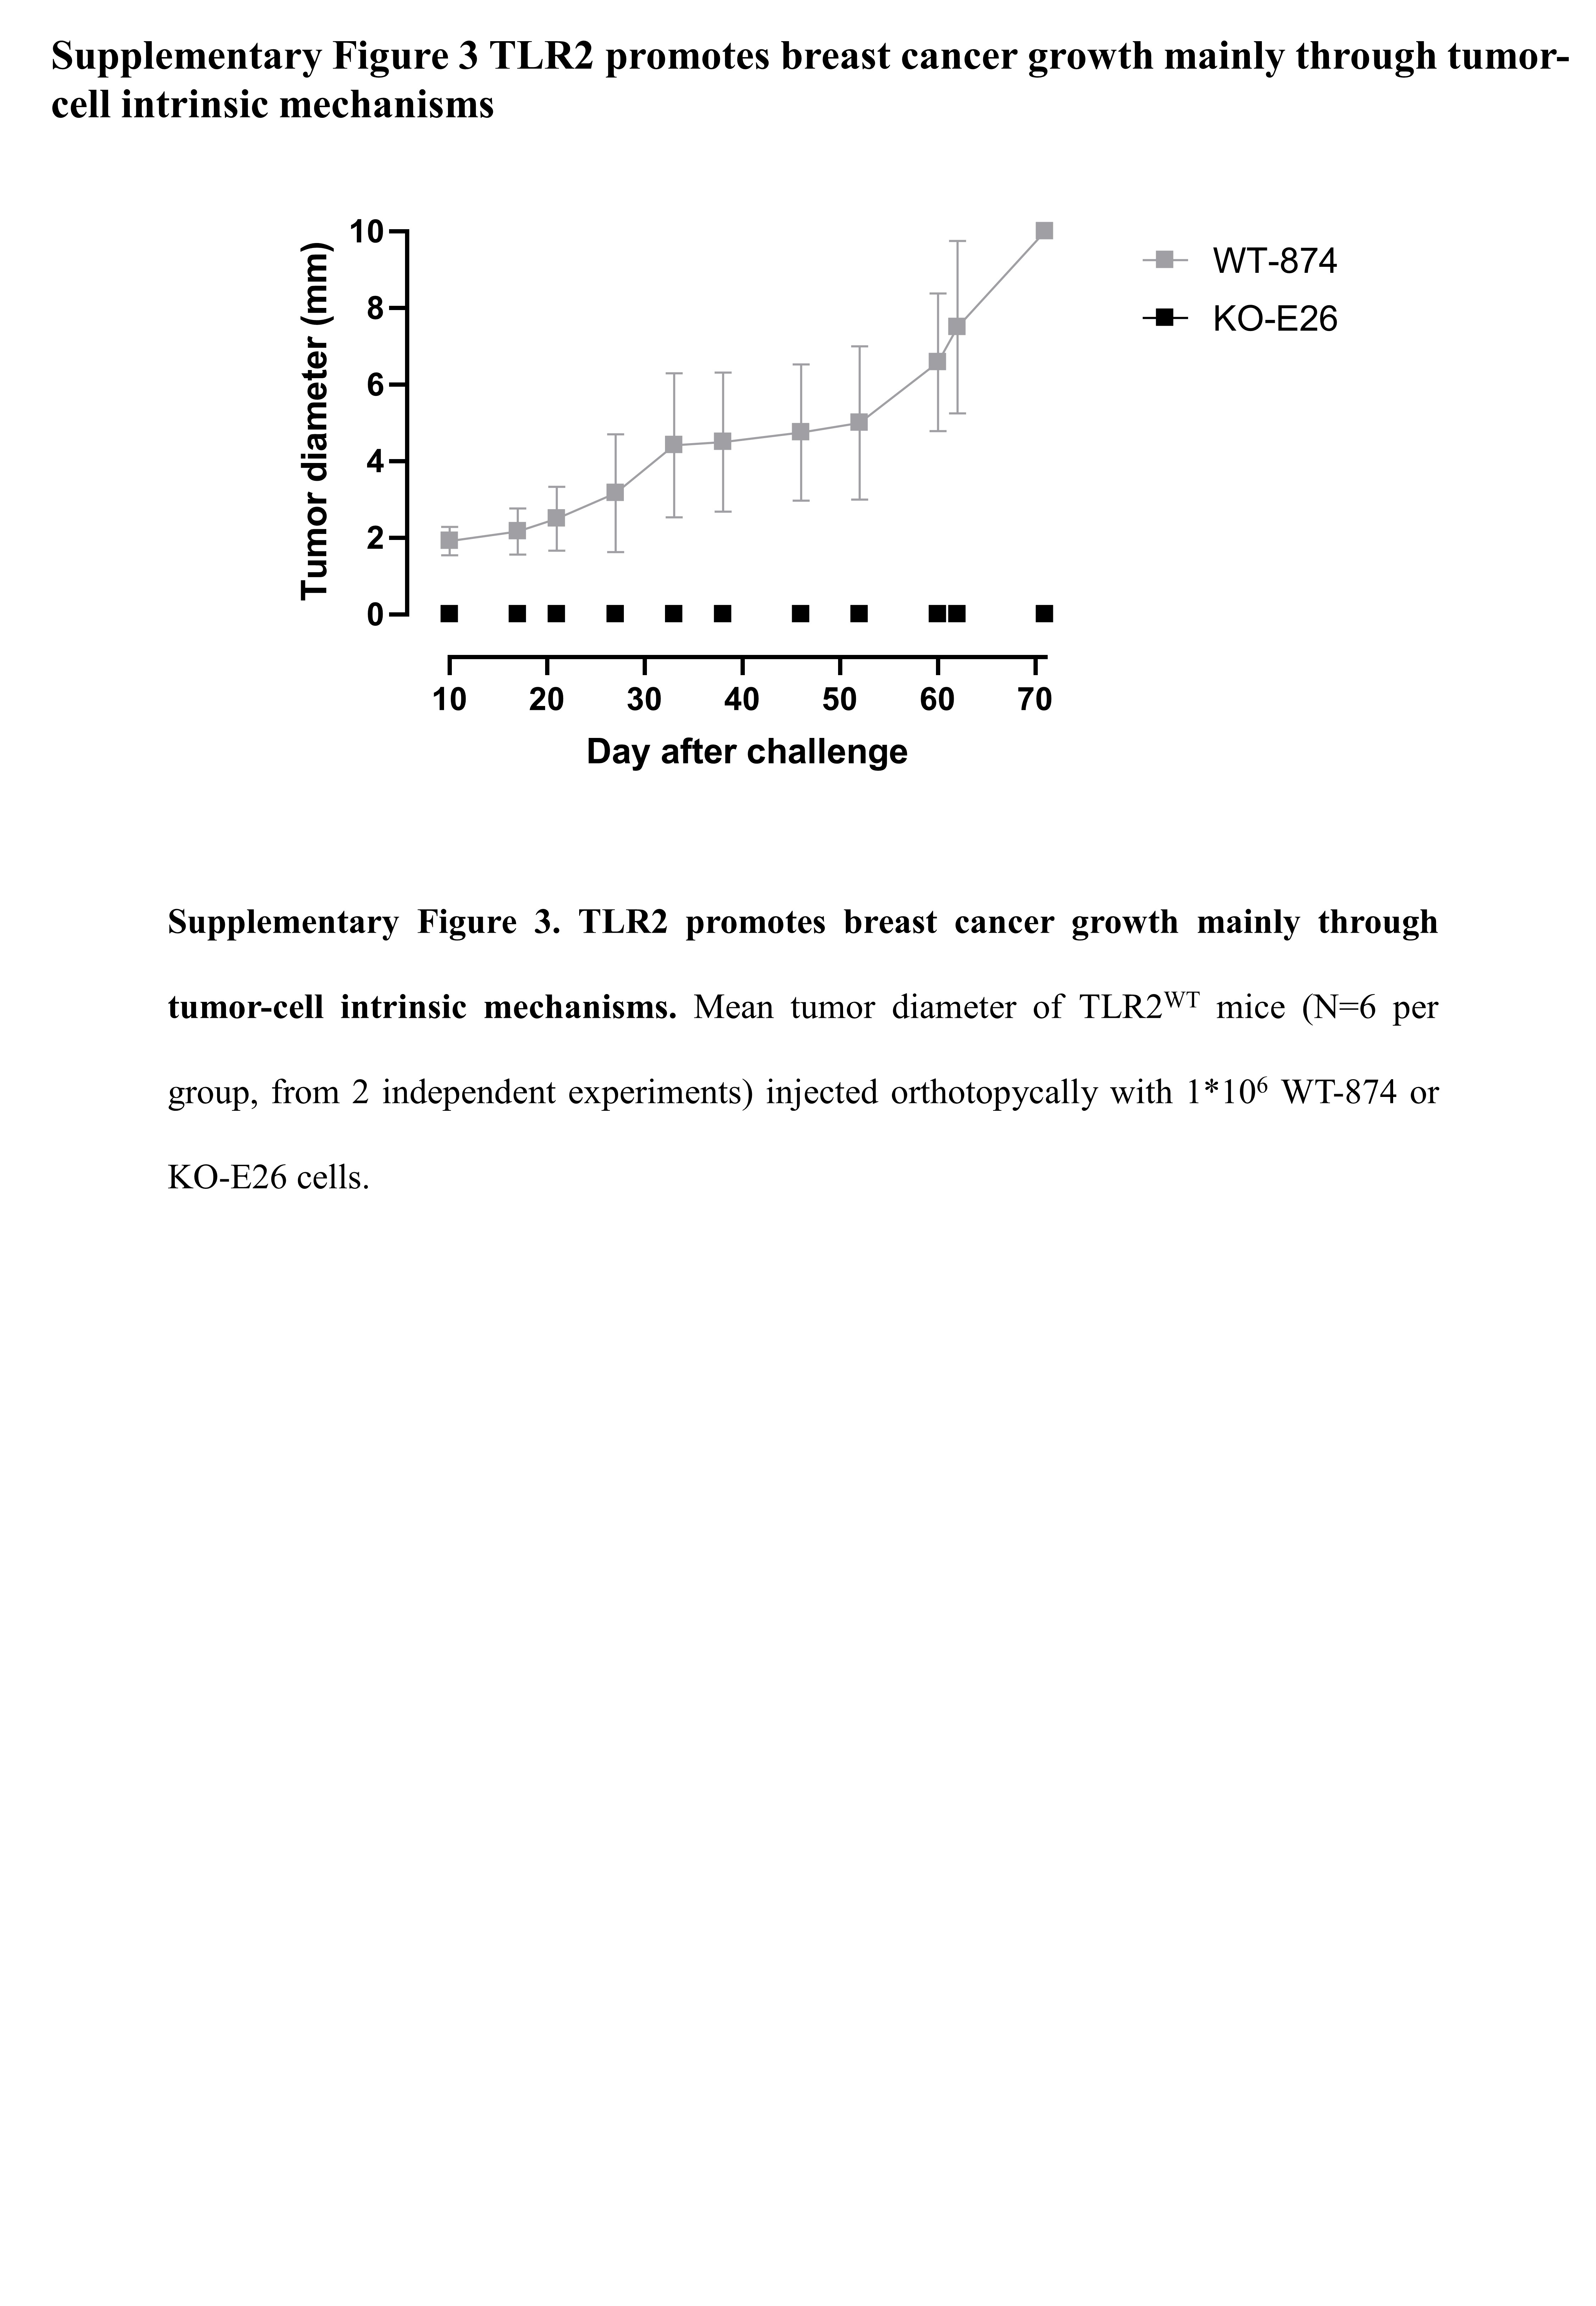
We performed the orthotopic cross transplantation of WT-874 and KO-M26 cells into TLR2WT and TLR2KO mice. Tumor onset and progression strictly correlated to the presence of TLR2 in cancer cells. Indeed, WT-874 cells generated tumors in 100% of mice, regardless of genetic background of the recipient, while KO-M26 cells generated tumors in only 20% and 30% of TLR2WT and TLR2KO mice, respectively (Fig. 3A). Moreover, the tumors generated by KO-M26 cells remained very small (mean diameters at sacrifice < 2 mm), regardless of the genetic background of the receiving mice (Fig. 3B). The tumors generated by WT-874 cells injected into TLR2KO mice were significantly larger (mean diameters at sacrifice < 5 mm), and significantly bigger tumors were generated by the WT-874 cells injected into TLR2WT mice (mean diameters at sacrifice: 10 mm) (Fig. 3B). Similar results were obtained using KO-E26 cells (Supplementary Figure 3).
To confirm the TLR2 tumor-cell-intrinsic mechanisms, 4T1 cells were silenced for TLR2 and injected into syngeneic BALB/c mice. TLR2 silencing significantly impaired tumor growth compared to control cells (Fig. 3C). Moreover, the transplantation experiment was repeated in NSG mice to understand whether the ability of TLR2+ tumors to shape an immunosuppressive TME is the major contribution to tumor progression, or whether their tumorigenic properties are tumor-cell-intrinsic. KO-M26 and KO-E26 cells generated smaller tumors than WT-874 cells, although all the tumors grew faster than in immunocompetent mice (Fig. 3D). These results, and the observations on Tregs, indicate that the TLR2-dependent pro-tumor effect is mostly cancer-cell intrinsic, although host TLR2-expressing cells provide a partial contribution.
TLR2 promotes CSC self-renewal and its inhibition impairs cell viability
We then exploited WT-874, KO-M26 and KO-E26 to characterize the tumor-cell-intrinsic pro-carcinogenic effects of TLR2. As expected, TLR2 was expressed on the cell surface of WT-874 cells, as well as on other murine or human mammary cancer cell lines, while was absent in KO-M26 and KO-E26 cells (Fig. 4A). When cultured in tumorsphere-forming conditions, the WT-874 cells generated significantly more tumorspheres than KO-M26 and KO-E26 (Fig. 4B), in accordance with the higher frequency of CD44+CD24- CSCs (Supplementary Fig. 2 D). Moreover, the percentage of Aldefluor+ cells was higher in the CSC-enriched P1 tumorspheres of all three cell lines than in 2D cultures, but was significantly higher in the WT-874 cells under both conditions (Fig. 4B), confirming that TLR2 induces CSC self-renewal. Moreover, TLR2 induces the secretion of pro-tumoral cytokines, since, compared to KO-M26 or KO-E26 cells, WT-874 produced significantly higher amounts of TGF-β, IL-6 and VEGF (Fig. 4C-E), which are responsible for triggering a pro-tumoral loop that promotes CSC self-renewal, proliferation and invasion [8].
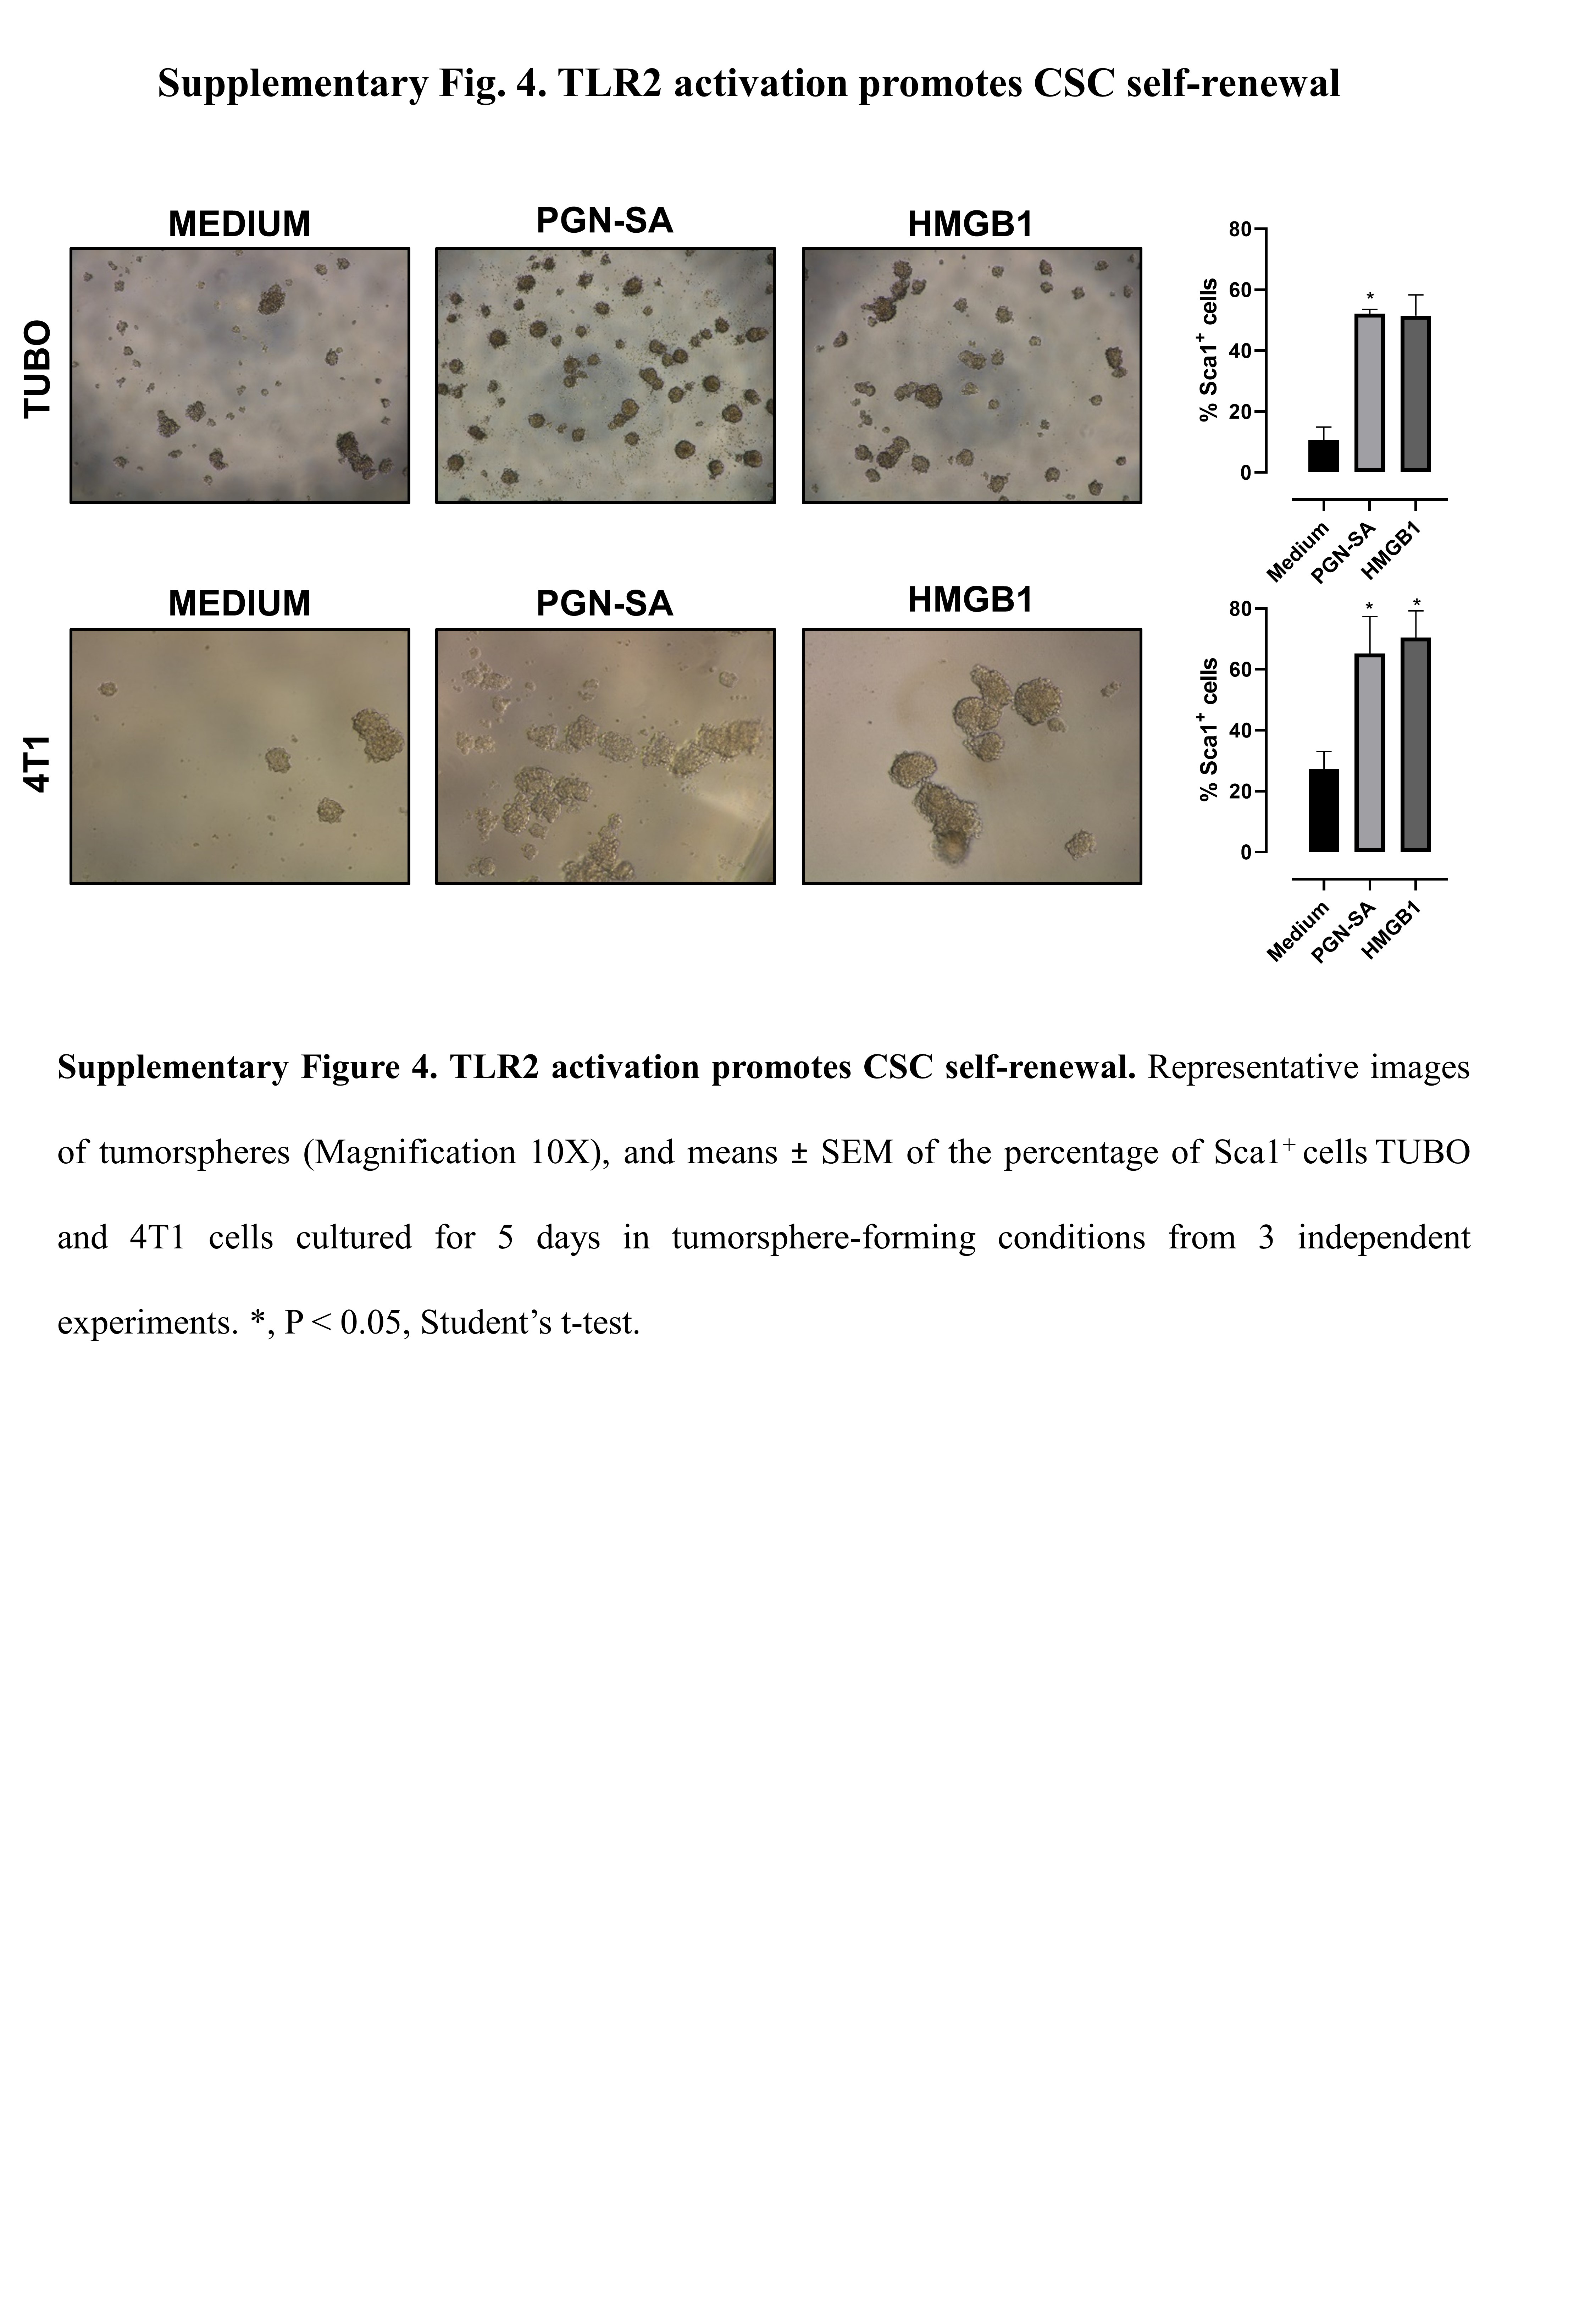
Several mouse and human BC cell lines, including TUBO, 4T1 and MDA-MB-231, express TLR2 (Fig. 4A). We therefore assessed the effect of TLR2 activation on their tumorsphere-generation ability. Murine HER2+ TUBO and TNBC 4T1 cells were stimulated with PGN-SA or HMGB1. Under these stimuli, TUBO and 4T1 cells generated significantly more spheres and expressed higher levels of the CSC marker Sca1 than control cells (Fig. 4F, G and Supplementary Fig. 4). This effect was TLR2-dependent, as was not observed in TLR2-silenced cells (Fig. 4F, G). PGN-SA and HMGB1 also increased tumorsphere generation in human TNBC MDA-MB-231 cells (Fig. 4H).
We therefore hypothesize that TLR2 inhibition impairs BC cell viability. Indeed, the TLR2 inhibitor CU-CPT-22 dose-dependently impaired WT-874, TUBO, 4T1 and MDA-MB-231 cell viability (Fig. 4I), while it was ineffective on KO-M26 or KO-E26 cells (not shown). Overall, these results demonstrate that TLR2 signaling promotes breast CSC self-renewal, and that its inhibition affects BC cell viability.
TLR2 mediates resistance to chemotherapy
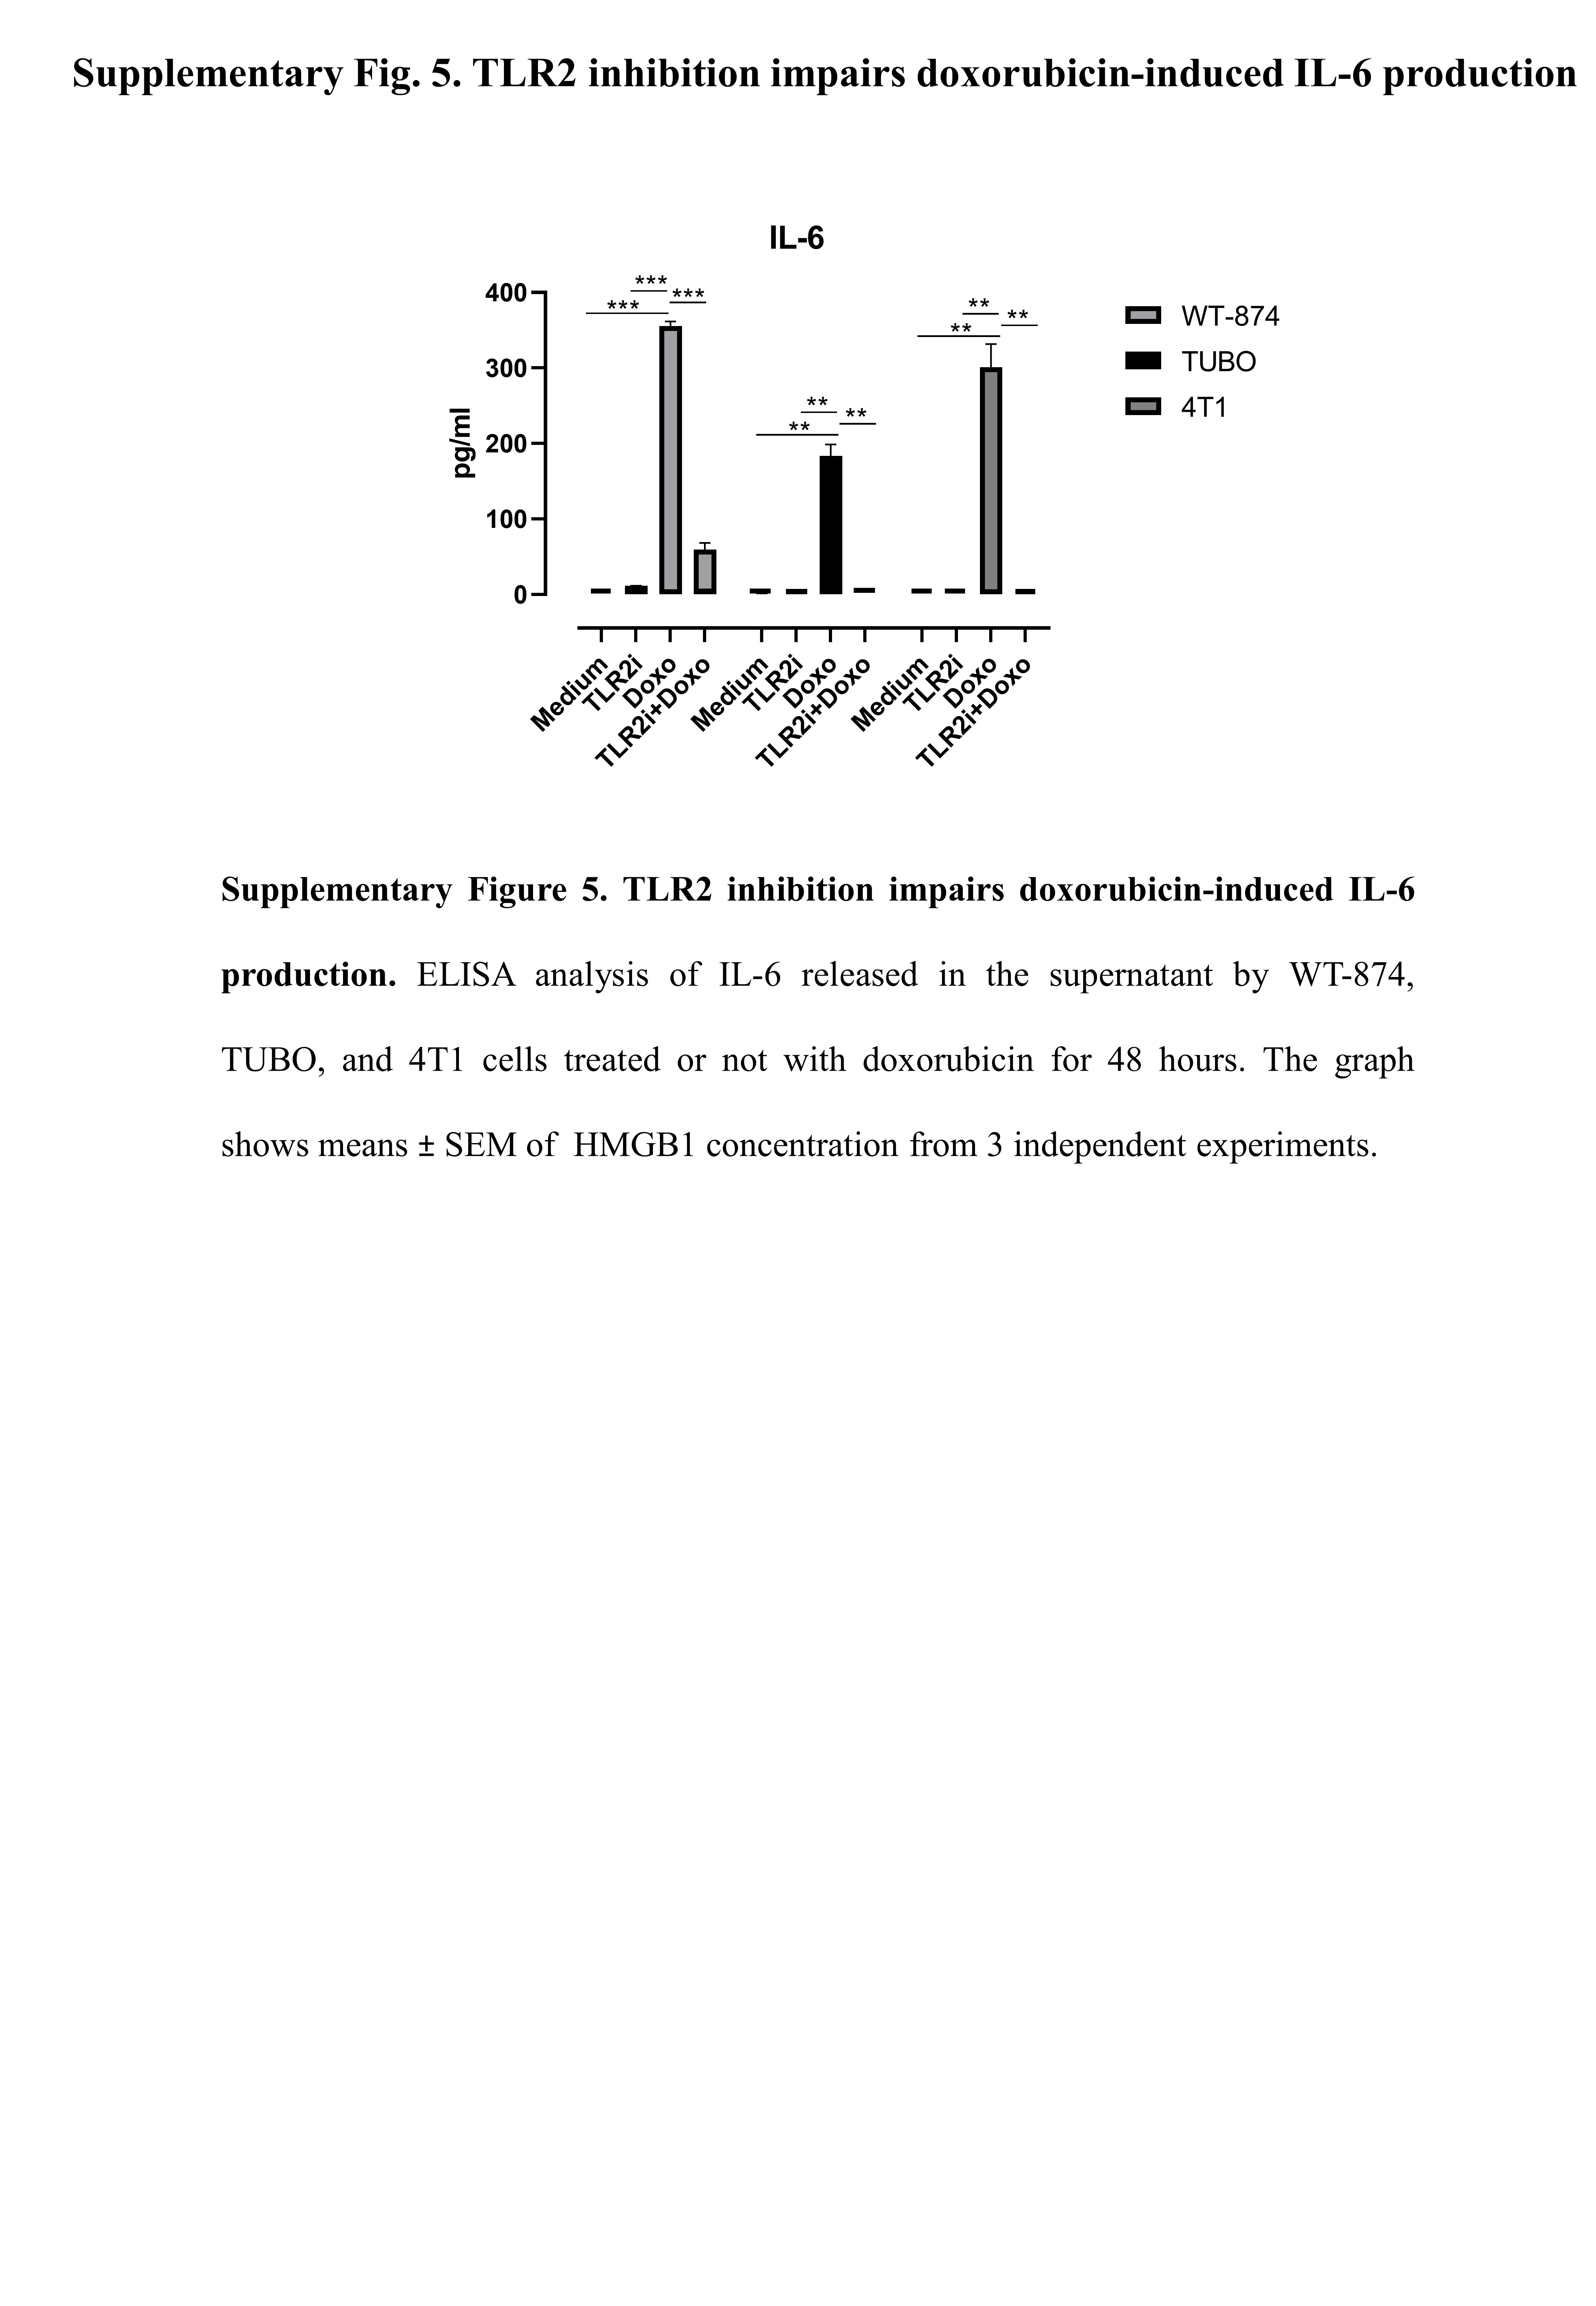
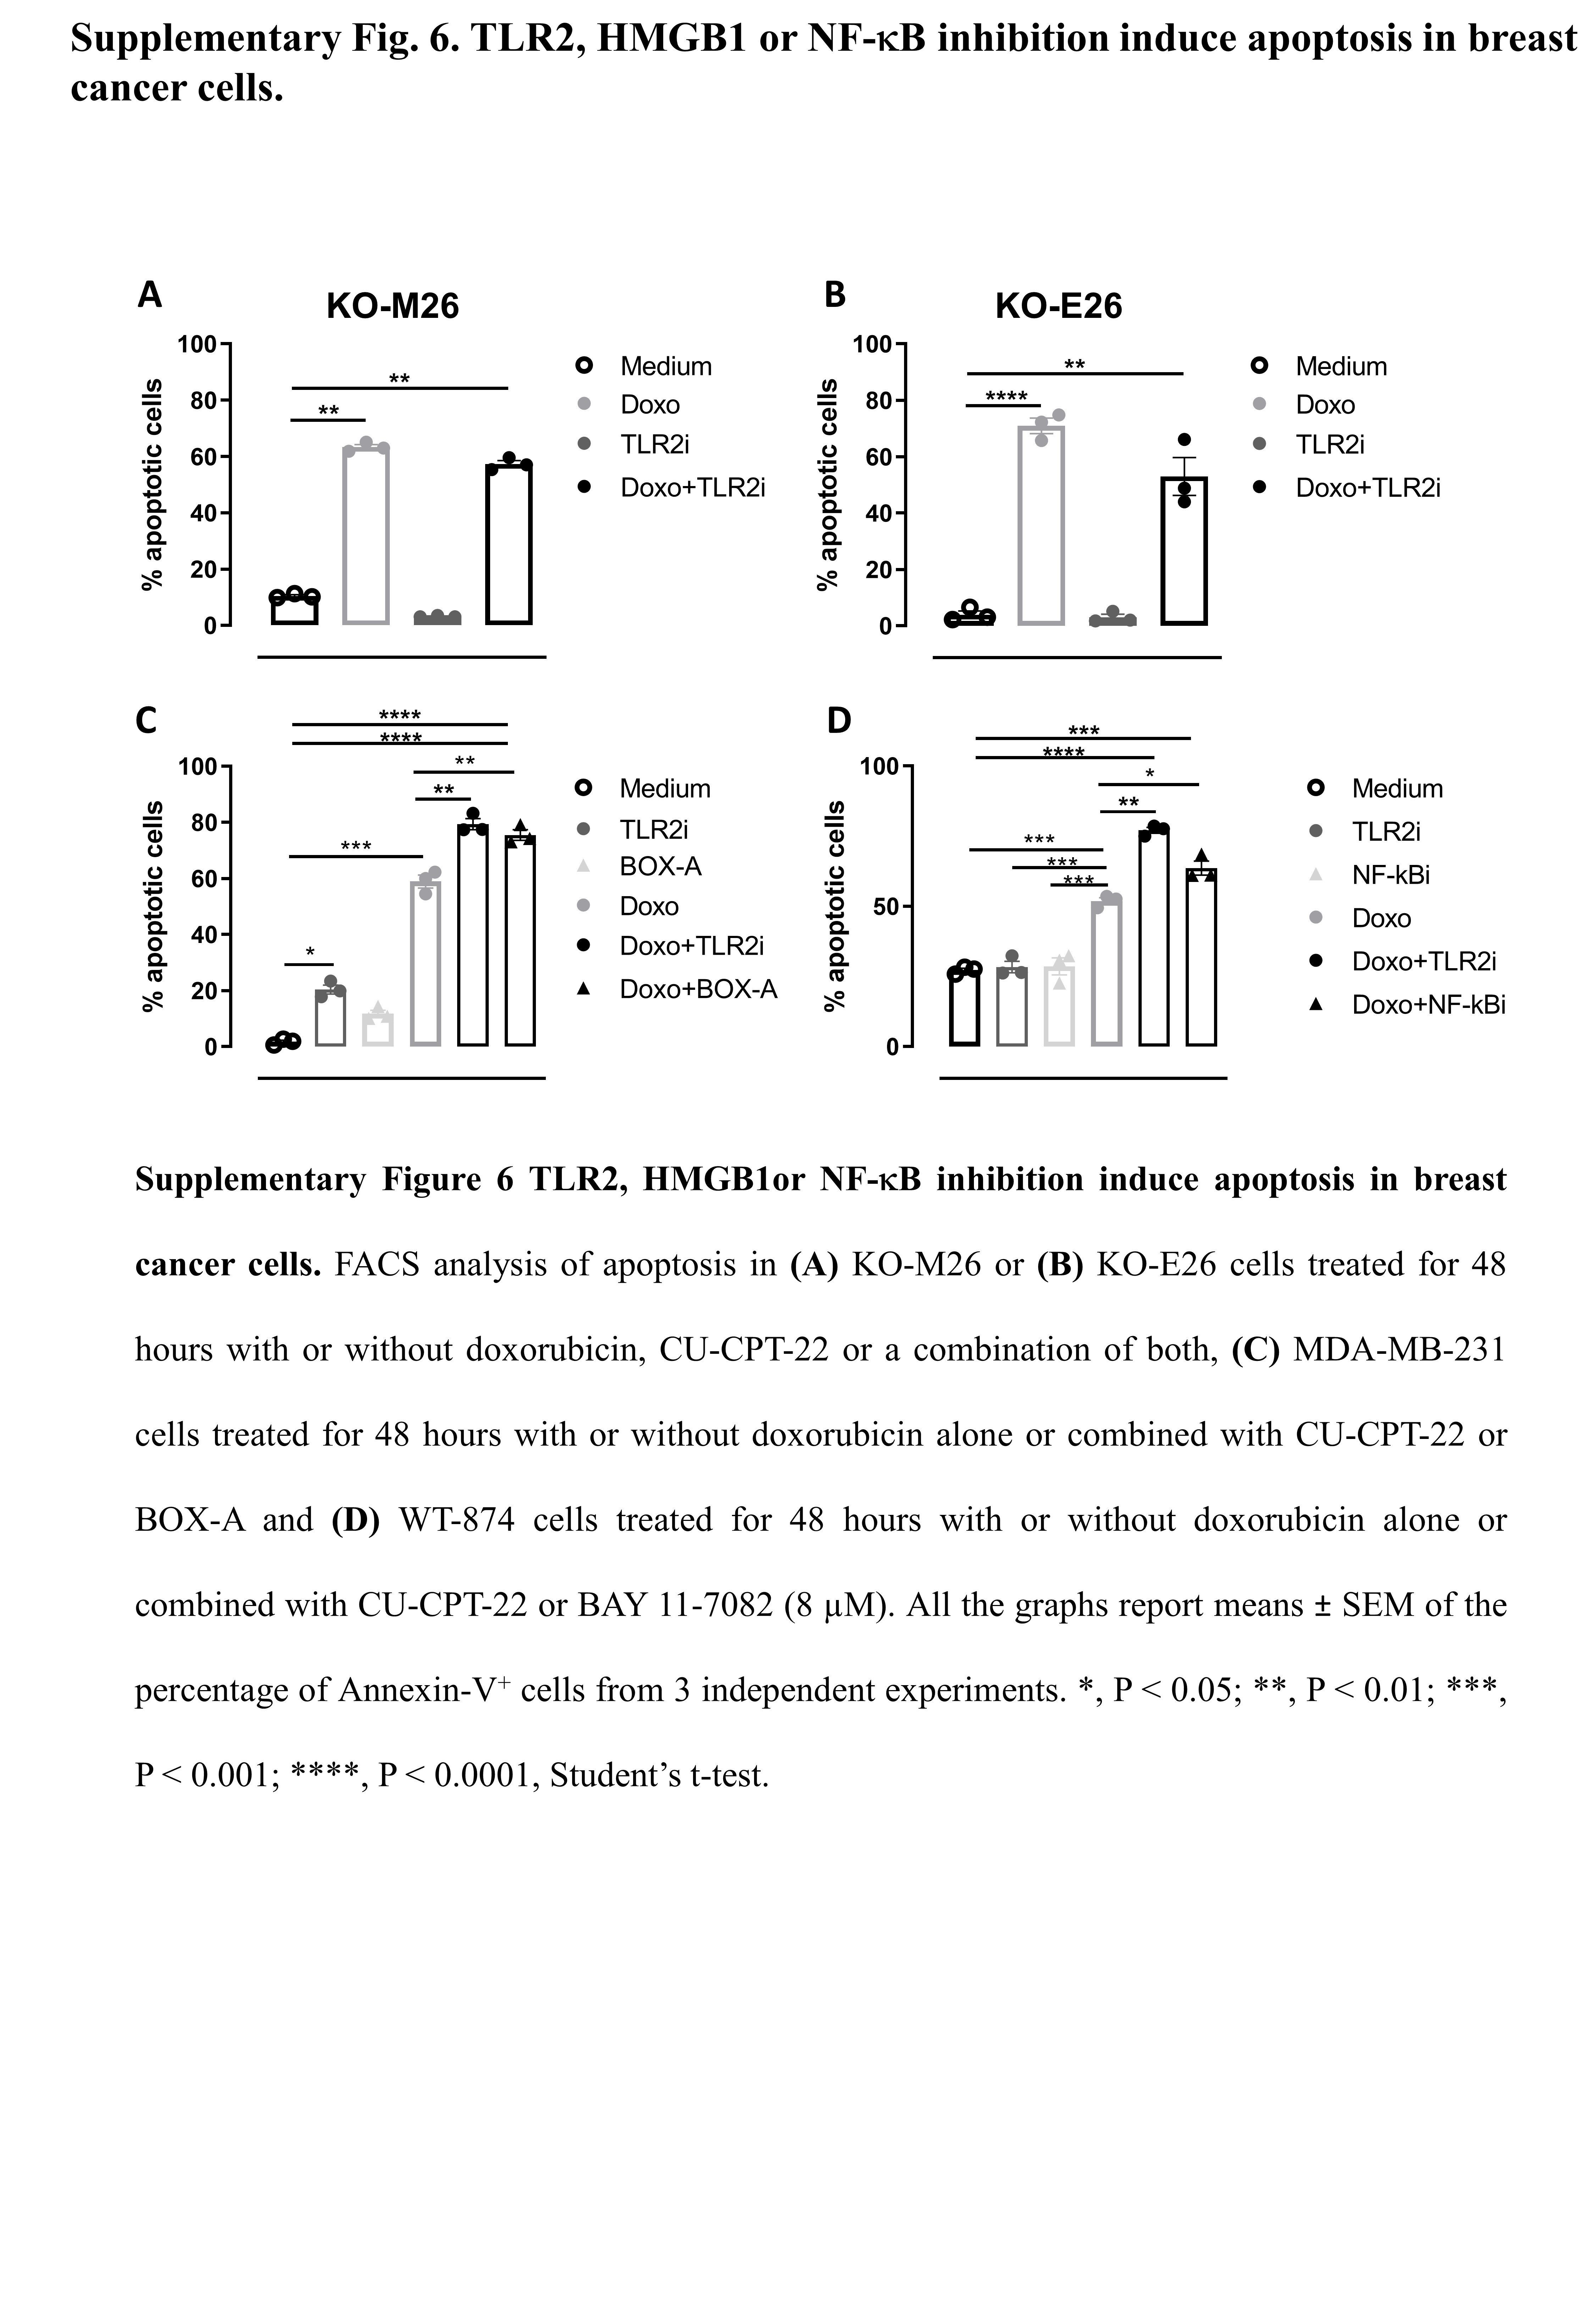
High TLR2 expression in BC patients correlates with a significantly impaired response to chemotherapy, as chemotherapy-treated BC patients with TLR2high tumors showed lower RFS than patients with TLR2low tumors (Fig. 5A), and TLR2 expression was significantly higher in non-responder than responder patients (Fig. 5B). Accordingly, WT-874 cells were more resistant to doxorubicin than KO-M26 and KO-E26 cells, which showed lower viability (Fig. 5C) and significantly higher apoptosis (Fig. 5D) in response to doxorubicin. Interestingly, TLR2 inhibition with CU-CPT-22 increased the sensitivity of HER2+ (WT-874 and TUBO) and TN (4T1 and MDA-MB-231) BC cells to doxorubicin (Fig. 5E). Significantly, the two drugs in combination exerted synergistic activity, as calculated using the Bliss independence model (Fig. 5F). We analyzed the supernatants of doxorubicin-treated cells to dissect the mechanisms involved in TLR2-dependent chemoresistance, and found that doxorubicin induced the release of HMGB1, which may activate TLR2, in all BC cells tested, with higher amounts released by KO-M26 and KO-E26 cells, which is in line with their higher sensitivity to doxorubicin (Fig. 5G). Treatment with HMGB1 induced the phosphorylation of the TLR2 downstream signal transducer p65 NF-κB in WT-874 cells, but not in KO-M26 and KO-E26 cells (Fig. 5H). As expected, doxorubicin induced NF-κB phosphorylation in WT-874, TUBO, 4T1 and MDA-MB-231 cells, while TLR2 inhibition with CU-CPT-22 significantly reduced NF-κB activation. The addition of CU-CPT-22 to doxorubicin-treated cells significantly reduced NF-κB phosphorylation in all cell lines (Fig. 5I). Moreover, doxorubicin treatment induced the release, from WT-874, TUBO and 4T1 cells, of NF-κB-regulated cytokine IL-6, which was abolished by adding CU-CPT-22 (Supplementary Fig. 5). Since NF-κB inhibits apoptosis and promotes cell survival [6], CU-CPT-22 synergized with doxorubicin and significantly improved its apoptotic effect in WT-874, TUBO, 4T1 and MDA-MB-231 cells (Fig. 5J). This effect was not due to off-target mechanisms, as CU-CPT-22 treatment did not exert any effect on KO-M26 or KO-E26 cells (Supplementary Fig. 6A-B). Interestingly, CU-CPT-22 increased doxorubicin-induced apoptosis to a similar extent as treatment with NF-κB inhibitor BAY 11-7082 (Supplementary Fig. 6C) and HMGB1 antagonist BOX-A (Supplementary Fig. 6D).
These results demonstrate that TLR2/NF-κB signaling, which is activated by doxorubicin-induced HMGB1 release, plays an essential role in chemoresistance, and that TLR2 inhibition restores BC cell sensitivity to chemotherapy.
Treatment with a TLR2 inhibitor potentiates doxorubicin anti-cancer effects in-vivo
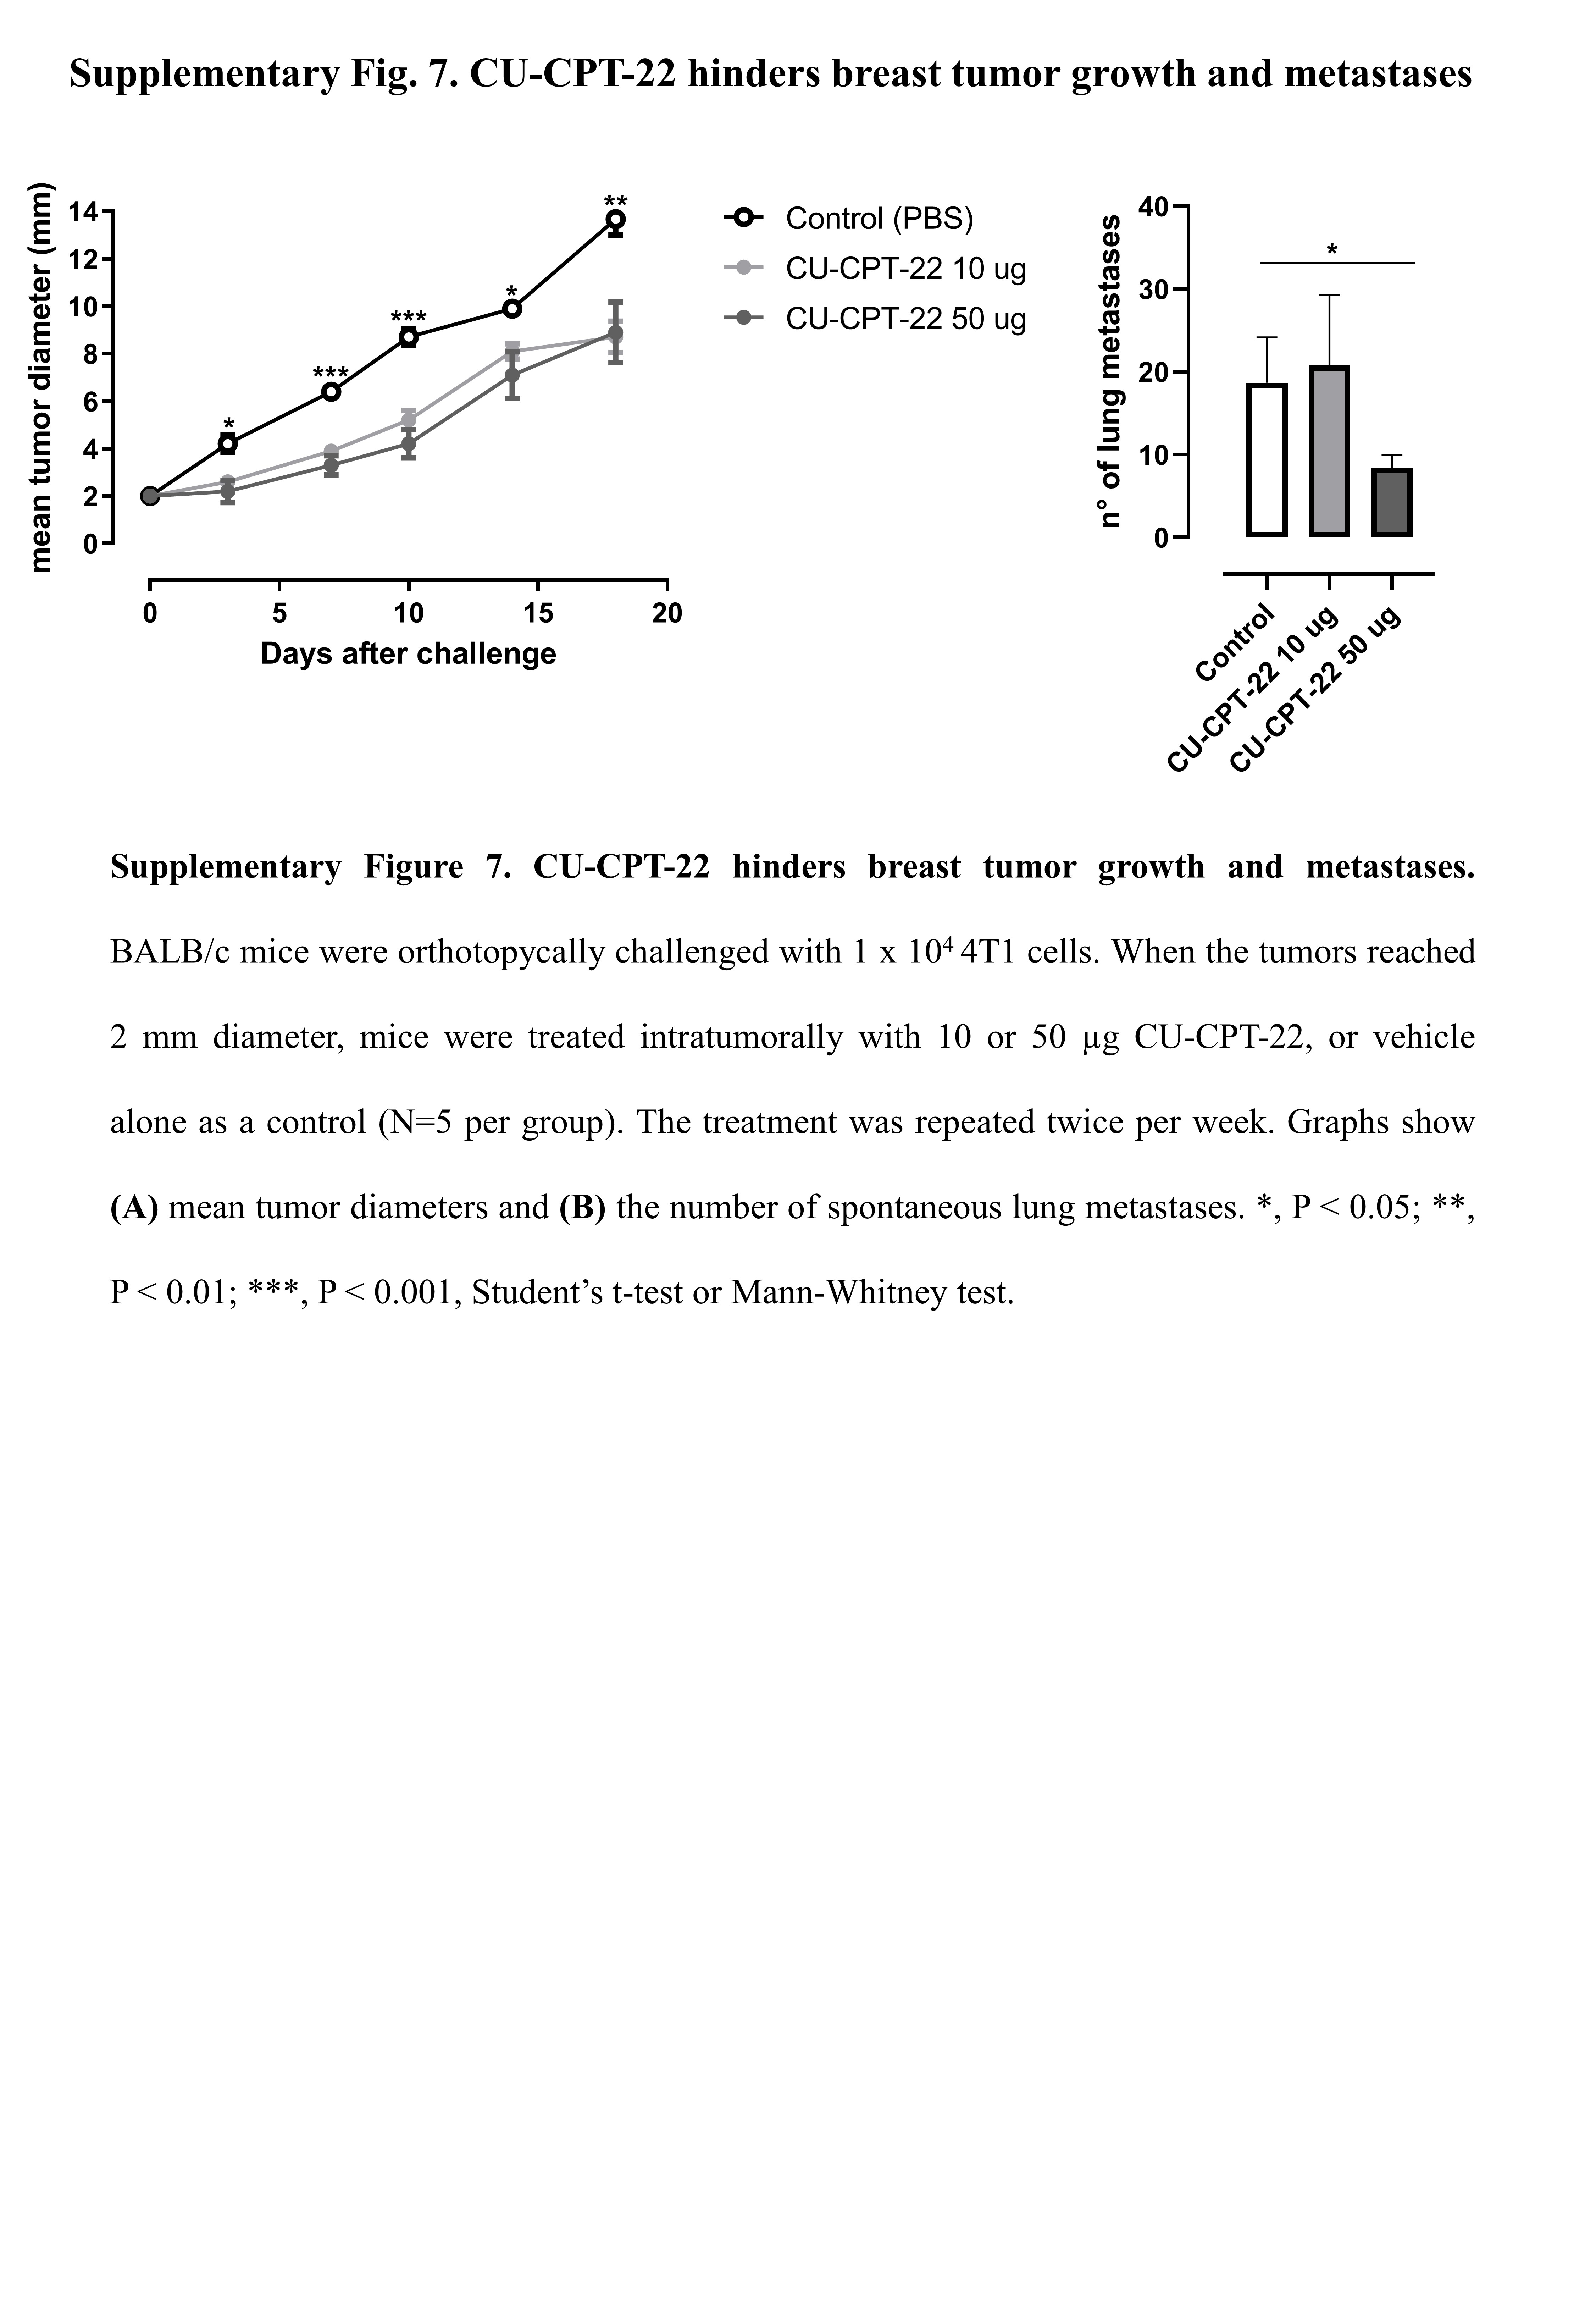
To verify whether TLR2 inhibition exerts an antitumor effect in-vivo, we prepared a therapeutic model to treat 4T1 tumor-bearing BALB/c mice with two different doses of CU-CPT-22 (10 or 50 µg) intratumorally, twice per week, starting when tumors reached 2 mm in mean diameter. Both CU-CPT-22 doses significantly reduced tumor growth, and treatment at 50 µg significantly reduced the number of spontaneous lung metastases (Supplementary Fig. 7). We then analyzed whether CU-CPT-22 synergizes with chemotherapy to hinder BC growth; 4T1 tumor-bearing mice were treated with doxorubicin, with and without CU-CPT-22 (50 µg), twice per week. Both doxorubicin and CU-CPT-22, administered as single treatments, significantly reduced tumor growth compared to control mice (Fig. 6A). The combination of doxorubicin and CU-CPT-22 induced a statistically significant reduction in tumor growth compared to the two single treatments (Fig. 6A). Moreover, mice treated with CU-CPT-22 + doxorubicin showed significantly fewer lung metastases than control- or doxorubicin-group mice (Fig. 6B). A cytofluorimetric analysis of tumors showed that the combination of CU-CPT-22 and doxorubicin induced a statistically significant decrease in Sca1+ CSCs compared to tumors from mice treated with doxorubicin alone, demonstrating that CU-CPT-22 synergizes with doxorubicin impairing CSC survival in-vivo (Fig. 6C). Moreover, the combined therapy induced a significant increase in tumor-infiltrating CD8+ T cells and a decrease in Tregs (Fig. 6D, E), while no significant differences in CD4+ T, NK cells or M0, M1 and M2 macrophages were observed (not shown). Mice underwent MRI at the experimental end point to better characterize the effects of the combination treatment. T2w morphological axial and coronal MR images were acquired at B0 = 7T. As shown in the representative T2w axial images, a significant decrease in tumor volume occurred upon treatment with CU-CPT-22 + doxorubicin (Fig. 6F, up). The MRI quantification of tumor volume showed decreases of 38±2%, 47±10% and 75±16% in mice treated with CU-CPT-22, doxorubicin, or both, respectively, compared to control mice (Fig. 6G). ADC-MRI maps, which report the degree of freedom of water, were obtained using DWI-MRI. False color representative axial ADC maps of the tumor region (superimposed onto morphological T2w MR images) are reported in Fig. 6F (lower) for control mice and mice treated with doxorubicin and CU-CPT-22 simultaneously. A significant higher ADC value, an indication of decreased cellularity, was observed in CU-CPT-22 + doxorubicin-treated mice than in control mice, while no significant effect was detected in mice treated with doxorubicin or CU-CPT-22 alone (Fig. 6H). Overall, these data indicate that treatment with TLR2 inhibitors synergizes with chemotherapy, reducing breast tumor growth and metastatic dissemination, and restoring an immunocompetent TME.