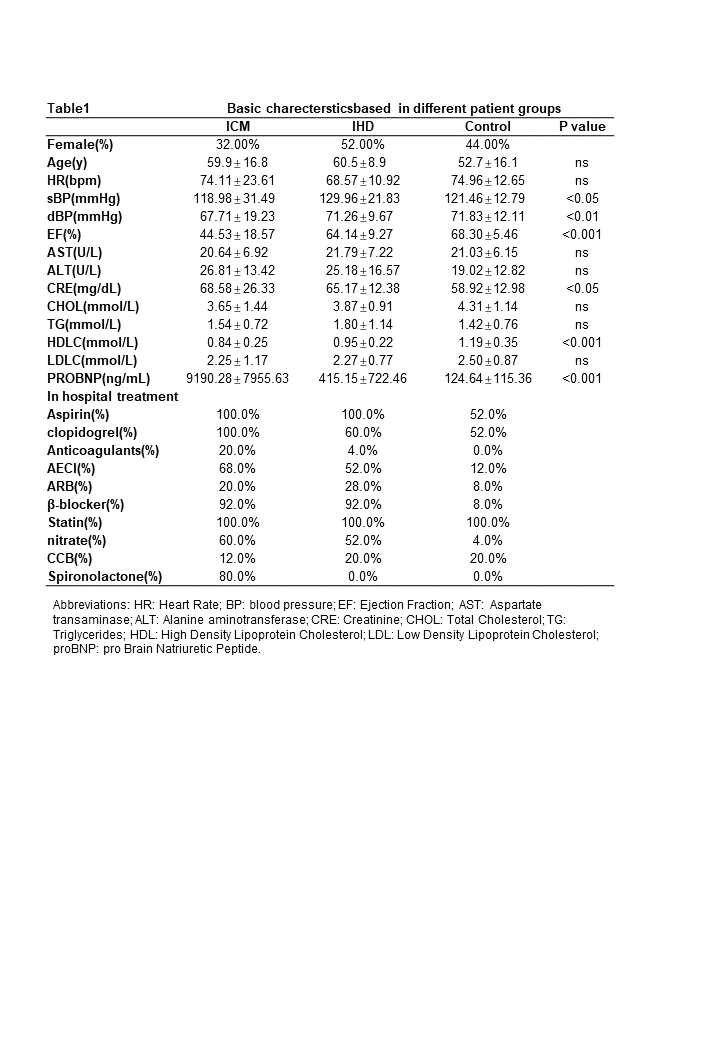
Baseline characteristics
A total of 75 patients were enrolled in the study, including 25 IHD, ICM and 25 control patients. Table 1 described the demographic and biochemical characteristics of the enrolled patients. The mean age was 59.89±16.81 for ICM, 60.48±8.94 for IHD and 52.71±16.09 for control participants. The mean left ventricular ejection fraction (LVEF) was 34.53±7.57 for ICM, 64.14±9.27 for IHD and 68.30±5.46 for control patients. No significant differences at baseline were seen in age, heart rate(HR), aspartate transaminase(AST), alanine aminotransferase(ALT), creatinine(CRE), total cholesterol(TC), triglycerides(TG) high and low density lipoprotein cholesterol(HDL-C, LDL-C).
Non-targeted lipidomics analysis
Firstly, we employed PLS-DA for profile visualization and differentiation among the multiple groups. The initial overview of global metabolic profiles as revealed by PLS-DA scores plot indicated that lipids among IHD, ICM and control group were generally correlated but to some extent separable, which is more prominent for lipids in positive ion mode (Figure 1). The heatmap overview for the serum lipids levels were shown in supplemental figure S1 and S2. The variable importance in projection (VIP) for lipids in negative and positive ion mode were shown in figure1C and figure1D, which indicated the importance in projection of listed lipids.
To identify the individual lipids levels, we compared the lipids levels in negative and positive ion modes among IHD, ICM and control patients using one-way ANOVA (Figure2). A total of 63 lipids were detected in negative ion mode (Supplementary table S1). Among them, 16:0 lysophosphatidylinositol(Lyso PI) and 18:1 Lyso PI were significantly altered both in IHD and ICM; 13:0 Lyso PI, 18:0 Lyso PI, 16:0 phosphatidylethanolamine(PE), 14:0 phosphatidylcholine dimyristoylphosphatidylcholine(PC DMPC), 16:0 ceramide and 18:0 ceramide were significantly altered only in ICM as compared to IHD and control(Figure2A). In positive ion mode, a total of 62 lipids were detected (Supplementary table S1). Among them, 19:0 lysophosphatidylcholine (Lyso PC), 12:0 sphngomyelin(SM) d18:1/12:0, 15:0 Lyso PC, 17:0 phosphatidylcholine (PC) and 18:1-18:0 PC were significantly altered both in IHD and ICM; 17:0 PE, 19:0 PC, 14:0 Lyso PC, 20:0 Lyso PC, 18:0 phosphatidylcholine (PC DSPC) and 18:0-22:6 PC were significantly altered only in ICM as compared to IHD and control(Figure2B). A heatmap of the individual levels of significantly altered serum lipids (p<0.05) is shown in Figure 3.
Receiver operating characteristics (ROC) analysis
Since non-targeted lipidomics analysis had identified significant alterations between ICM and control, we further performed ROC analysis for discovery and identification of potential lipid biomarkers. Among 19 significantly altered lipids tested in negative and positive ion mode, 16:0 Lyso PI, 16:0 PE, 13:0 Lyso PI, 18:1 Lyso PI, 18:0 ceramdie and 18:0 Lyso PI detected in negative ion mode (Figure4A-F) and 18:0-22:6 PC(Figure4G) in positive ion mode showed prognoctic value for ICM with the area under the ROC curve(AUR) all above 0.7 and P value<0.05.
Interrelation between lipids and clinical characters
At last, we explored the interrelationship between the significantly altered lipids and the clinical phenotype. Figure 5 showed the heatmap of the Pearson’s correlation coefficients between age, HR, blood pressure, EF, hepatic function, renal function, serum lipid levels, thyroid function and lipids profile in negative ion mode (Figure5A) and positive ion mode (Figure5B). Red squares indicated the highest positive coefficient of 1 and blue squares indicated the lowest negative coefficient of −1. It was noteworthy that the 16:0 ceramide and 18:0 ceramide were both significantly and negatively correlated to renal function as indicated by serum creatinine. It was also quite interesting to notify the prominent negative correlation between systolic blood pressure and nearly all altered lipids in positive ion mode except for 18:0-22:6 PC.