Reagents
Reagents were from Sigma Chemical Co (St. Louis, MO, USA), tissue culture flasks, dishes, and multi-well plates were from Falcon Orange Scientific (Graignette Business Park, Belgium), and culture media from both tissue and cell lines and supplements were from Gibco BRL (Carlsbad, CA, USA) [3-5].
Sample collection and handling
Human adipose tissue explants from cancerous (hRAT; n=23) kidneys were obtained from patients to whom a partial or total (tumor) nephrectomy was performed. Human adipose tissue explants from normal kidneys (hRAN; n=19), were obtained from live kidney donors who had not received previous chemotherapy or radiotherapy treatment. The median of body mass index (BMI) of patients was: 26.8 kg/m2 for patients with renal tumor (hRAT), and 24.9 kg/m2 for living kidney donors (hRAN). (BMI) (kg/m2) was calculated as weight (kg) divided by height (m) squared.
Samples were transported in PBS and processed immediately. On average, 2 h elapsed from the acquisition of the surgical sample until it was processed under a sterile laminar flow hood. The project was approved by the Medical School’s ethics committee (Universidad Nacional de Cuyo, Argentina) according to Declaration of Helsinki to experimentation with human subjects. All patients gave their informed consent to undergo tissue harvesting for this research [5].
Gene expression by RT-qPCR analysis
Total RNA was extracted from 100mg of tissue using Trizol reagent (Invitrogen, Carlsbad, CA, USA) and quantified according to its absorbance at 260nm (NanoDrop 2000, Thermo Scientific, Wilmington, USA). Contaminating genomic DNA was degraded with DNAse RQ1 (Promega, Madison, USA), cDNA was synthesized from one microgram of total RNA using 300pmol oligo-dT primers, 10mM dNTP (Thermo Scientific, Wilmington, USA) and 200U M-MLV reverse transcriptase (Promega, Madison, USA). Real-time PCR was performed in a final volume of 20 uL containing 50 ng cDNA, 3mM MgCl2, PCR LightCycler-DNA Master SYBRGreen reaction mix (Roche, Indianapolis, USA) and 0.5 mM of each specific primers (Table 1). Amplification was performed in a using LightCycler thermocycler (Roche, Indianapolis, USA). Controls without reverse transcription were included to ensure that amplifications were from mRNA and not from genomic DNA. Amplicons were characterized according to their melting temperature and size. The mRNA level of each target gene was calculated using the 2ΔΔCt method and normalized against the mRNA of β-actin [4-5].
Table 1: primer pair sequence are shown for the Forward (F) and Reverse (R) primers used to measure mRNA abundance by RT-qPCR
|
Gen
|
Forward (5´-3´)
|
Reverse (5´-3´)
|
Ct
|
Size (pb)
|
TM (°C)
|
Gene bank
|
|
Prdm16
|
GGCAAACGCTTCGAATGTGA
|
ACCGTGCTGTGGATATGCTT
|
35
|
173
|
94
|
NM_199454.2
|
|
Tbx1
|
ACGACAACGGCCACATTATTC
|
CCTCGGCATATTTTCTCTATCT
|
35
|
102
|
85
|
AF012131.1
|
|
Ucp1
|
GCAGGGAAAGAAACAGCACCTA
|
TCCCTTTCCAAAGACCCGTCAA
|
35
|
217
|
86
|
NM_021833.4
|
|
Pgc1 alpha
|
ACCAGCCAACACTCAGCTAA
|
AGGGACGTCTTTGTGGCTTT
|
35
|
170
|
83
|
NM_013261.3
|
|
GAPDH
|
GGAGCGAGATCCCTCCAAAAT
|
GGCTGTTGTCATACTTCTCATGG
|
40
|
197
|
89
|
NM_002046.3
|
H&E staining
Tissues (hRAT and hRAN) were fixed in 4% formaldehyde and embedded in paraffin. They were afterwards cut into sections of 3 𝜇m thickness with a microtome, deparaffinized and stained with hematoxylin-eosin (H&E). Images were taken with a Nikon Eclipse E200 Microscope fitted with a digital still camera Micrometric SE Premium (Nikon Corp., Japan) at 100x magnification. Adipocyte area quantification (measuring adipocyte perimeter) in the three tissue types was performed in 8–10 fields of each preparation as mentioned above [5].
Immunohistochemistry
10 µm serial cuts were performed on the same tissue samples embedded in paraffin used for H&E staining. UCP1, PGC1 alpha and HSP expression were studied by means of immunohistochemistry. Briefly, hRAN and hRAT microtome slides were first deparaffinized, and then a heat-mediated antigen retrieval, endogenous peroxidase blocking and nonspecific tissue blocking were performed. Slides were then incubated with the different primary antibodies at 4 °C, and after that with an anti-rabbit biotinylated secondary IgG antibody. Finally, slides were incubated with peroxidase-conjugated streptavidin. Peroxidase reaction was performed with chromogen 3,3′-diaminobenzidine (DAB) (DAKO LSAB + Kit, HRP). Hematoxylin counter stain was performed. Serial cuts incubated in the absence of primary antibody were used as negative controls. Images were taken with a Nikon Eclipse E200 Microscope fitted with a Micrometric SE Premium (Nikon Corp., Japan) digital still camera at 100x and 400x magnification. DAB staining quantification in the three tissue types was performed in 5 fields of each preparation as mentioned above [3-5].
Preparation of conditioned media (CMs) from hRAN and hRAT
Adipose tissues were washed with cold PBS and weighed. hRAN or hRAT were plated in culture flask with M199 culture medium (Invitrogen™; 1 g tissue/10 ml M199), supplemented with gentamicin (50 µg/ml) and incubated for 1 h at 37 ºC in 5 % CO2. After that, the medium was removed and replaced with fresh medium and the tissues were incubated for 24 h. Subsequently, the supernatant was collected and filtered using filters with 0.22 µm membranes. Then, supernatants were aliquoted into 1-ml fractions and immediately stored at -80 ºC. The control-CMs were obtained from the collection of serum-free M199 medium after 24 h of incubation in a culture flask at 37 ºC in 5 % CO2 [5].
Treatment with hRAN- and hRAT-CMs
In order to study the EMT proteins expression of tumor (786-O, ACHN and Caki-1) and non-tumor (HK-2) human renal epithelial cell lines, MCs collected were diluted 1:1 in DMEM-F12 (Invitrogen, UK) 2 % fetal bovine serum (FBS; 1 % FBS final concentration) and the cells were incubated for 24 h with the diluted CMs. The experiments were performed with equal volumes of hRAN- and hRAT-CMs. The concentration of total protein in those volumes was quantified using Bradford reagent [4-5].
Culture of tumor and non-tumor renal epithelial cell lines
Tumor (786-O, ACHN and Caki-1) and non-tumor (HK-2) human renal epithelial immortalized cell lines were used. 786-O (ATCC® CRL1932™), ACHN (ATCC® CRL1611™), Caki-1 (ATCC® HTB46™) and HK-2 (ATCC® CRL2190™) were obtained from the American Type Culture Collection (ATCC, Rockville, MD). 786-O is a line derived from a primary clear cell adenocarcinoma (primary tumor); and both ACHN and Caki-1 are lines derived from metastatic sites (pleural effusion and skin respectively). The four cell lines were cultured in DMEM-F12 medium with 10 % FBS and 2 µg/ml insulin; and were maintained at 37 ºC in 5 % CO2 [5].
Preparation of cell lysates from renal epithelial cells after incubation with hRAN-, hRAT- or control-CMs
786-O, ACHN, Caki-1 and HK-2 cells were seeded in six-well plates in DMEM-F12 complete medium. When cells reached 75-80 % confluence, the medium was aspirated and cells were washed twice with PBS. Then, cells were incubated at 37 ºC for 24 h either with hRAN-, hRAT- or control-CMs (50% CM, 50% DMEM-F12 2% FSB). Cells were lysed with Ripa buffer (Tris 10mM pH 7,5; NaCl 150mM; sodium vanadate 2mM; sodium deoxycholate; SDS 0,1%; igepal 1%; protease inhibitors), pelleted by centrifugation at 4 ºC and stored at -80 ºC [4-5].
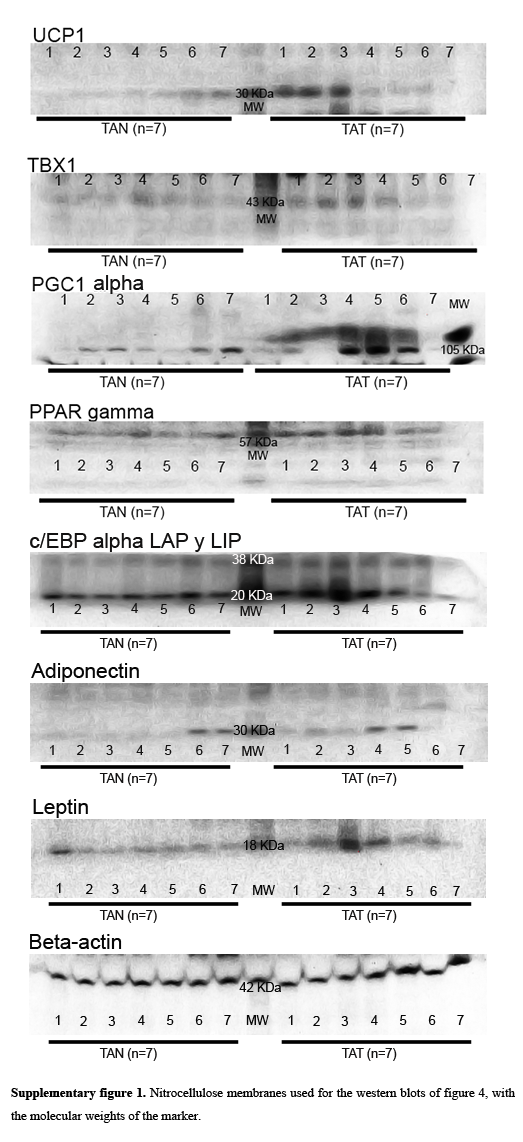
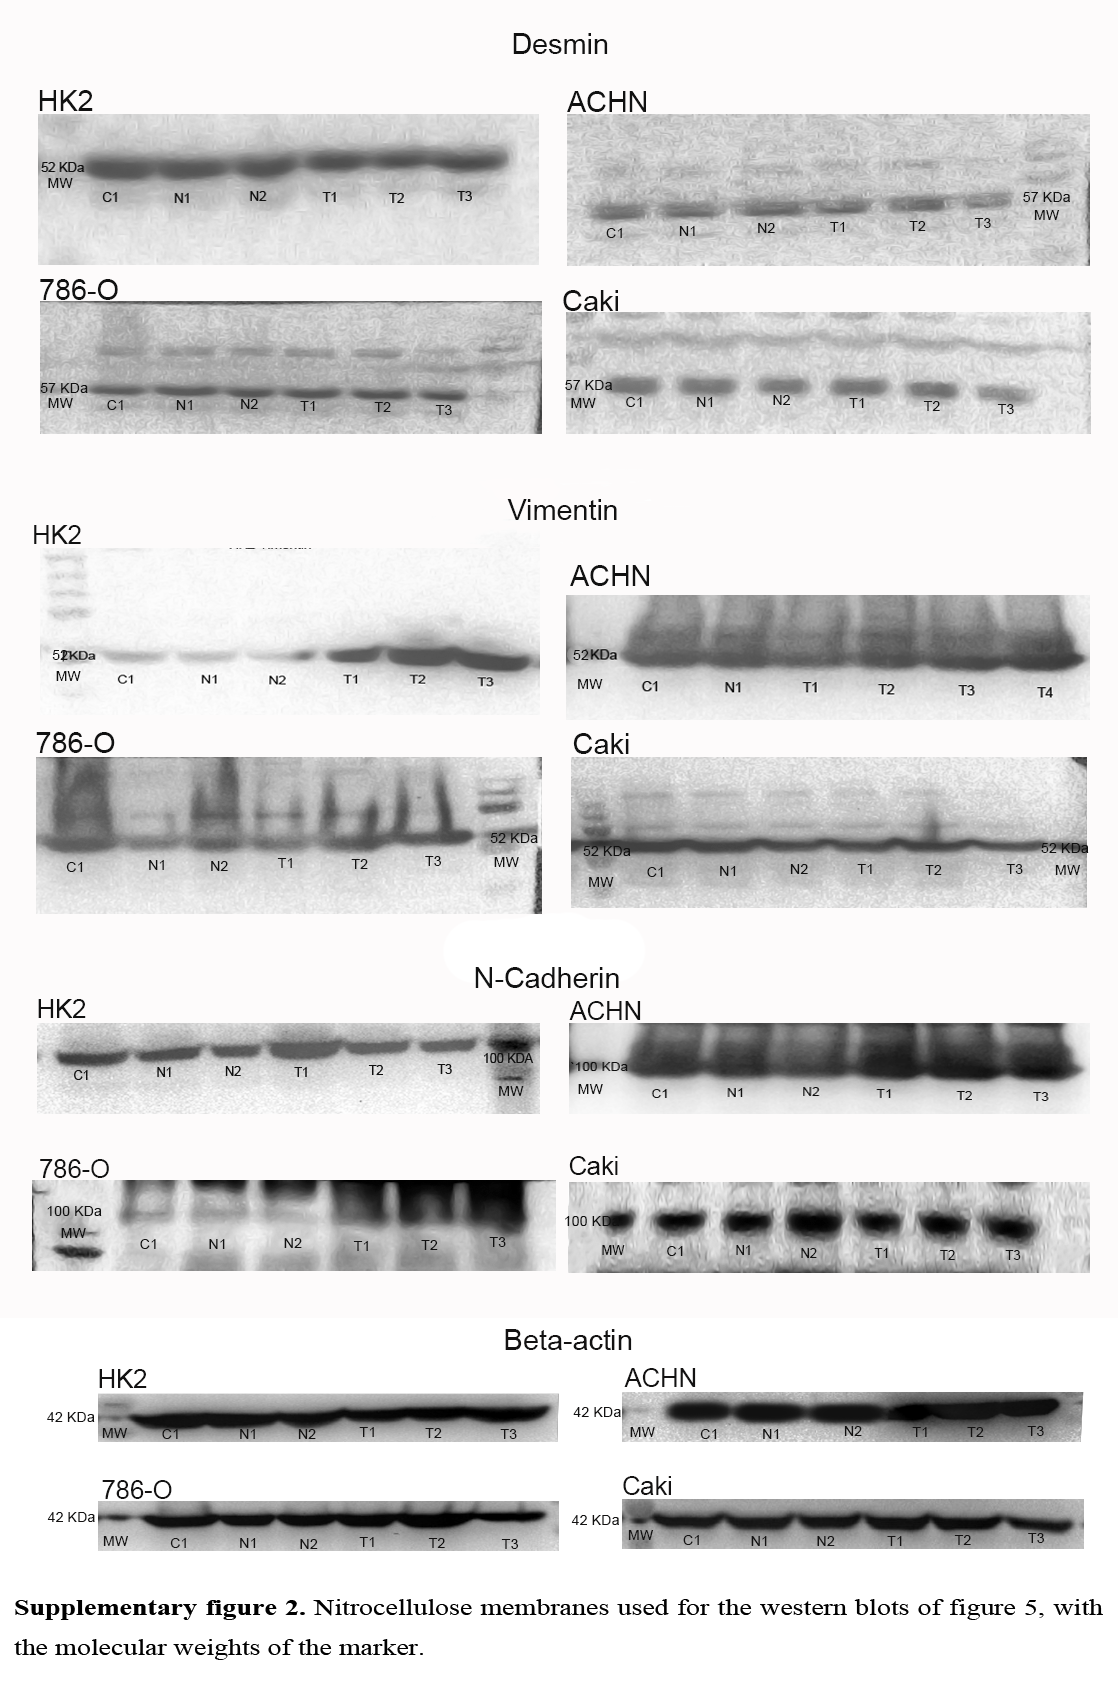
Western Blot analysis
In order to evaluate protein expression levels, Western blots were performed. UCP1, TBX1, PPARγ, PCG1α, c/EBPα LAP, c/EBPα LIP, adiponectin, leptin, vimentin, desmin and N-cadherin were measured after incubation of the epithelial cell lines with the different CMs obtained. In order to lyse cells, Ripa buffer was used. Total protein in samples was quantified by Bradford method. Proteins were separated in a SDS-PAGE 12 gel, and electrotransferred to a nitrocellulose membrane (Amersham). The membrane was later blocked with bovine serum albumin (Sigma-Aldrich, 0055K) and then incubated with the different antibodies ON at 4ºC. The membranes were later washed, and incubated with proper secondary antibodies conjugated with biotione, and subsequently the signal was amplified with streptovidin. Antibody complexes were visualized by means of chemiluminescence (ECL; GE Helathcare). Bands were quantified by densitometry using FIJI Image processing package [22]. In the cell extracts, β-actin level in samples was used to determine that equal quantities of proteins were loaded in the gel [3-5].
Statistical methods
The statistical significance between different experimental conditions was evaluated by t-test or one-way ANOVA. Tukey´s post-hoc tests were performed within each individual treatment. The results are presented as mean ± SEM. Results were considered significant at p < 0.05.