Tissue samples and cell lines
Colon cancer cell lines, including HCT116, SW480, SW620 and RKO, were purchased from the Cell Bank at the Shanghai Institute of Cells, Chinese Academy of Sciences (Shanghai, China). Cells were cultured in DMEM or 1640 medium (Gibco, USA) supplemented with 10% FBS and 1% penicillin/streptomycin (Beyotime, China) at 37°C with 5% CO2. Four pairs of colon cancer and adjacent normal tissues were obtained from Wujin Hospital affiliated with Jiangsu University. Informed consent forms were obtained from patients. This study was approved by the Ethics Committee of the Inner Mongolia People’s Hospital.
Data collection and analysis
DPEP1 expression profiles in TCGA and Genotype-Tissue Expression (GTEx) clinical pancancer data were downloaded from the University of California, Santa Cruz (UCSC) Xena database (https://xenabrowser.net/datapages/), including data on ACC, BLCA, BRCA, CESC, CHOL, COAD, DLBC, ESCA, GBM, HNSC, KICH, KIRC, KIRP, LAML, LGG, LIHC, LUAD, LUSC, OV, PAAD, PRAD, READ, SARC, SCKM, STAD, TGCT, THCA, THYM, UCEC, and UCS. To evaluate DPEP1 expression, tumor tissues were obtained from TCGA, and normal tissues were obtained from the TCGA and GTEx databases.
GSE74602, based on the GPL6104 platform, was obtained from the GEO database, including 30 colon cancer tissue samples and 30 paracancerous tissue samples. Differentially expressed genes (DEGs) were obtained by the R package limma. The false positive results could be corrected by the adjusted P value (adj. P value) of the FDR method. Therefore, the cutoff criteria for DEGs were as follows: adjusted p < 0.05 and | log2-fold change (FC)| > 1.5.
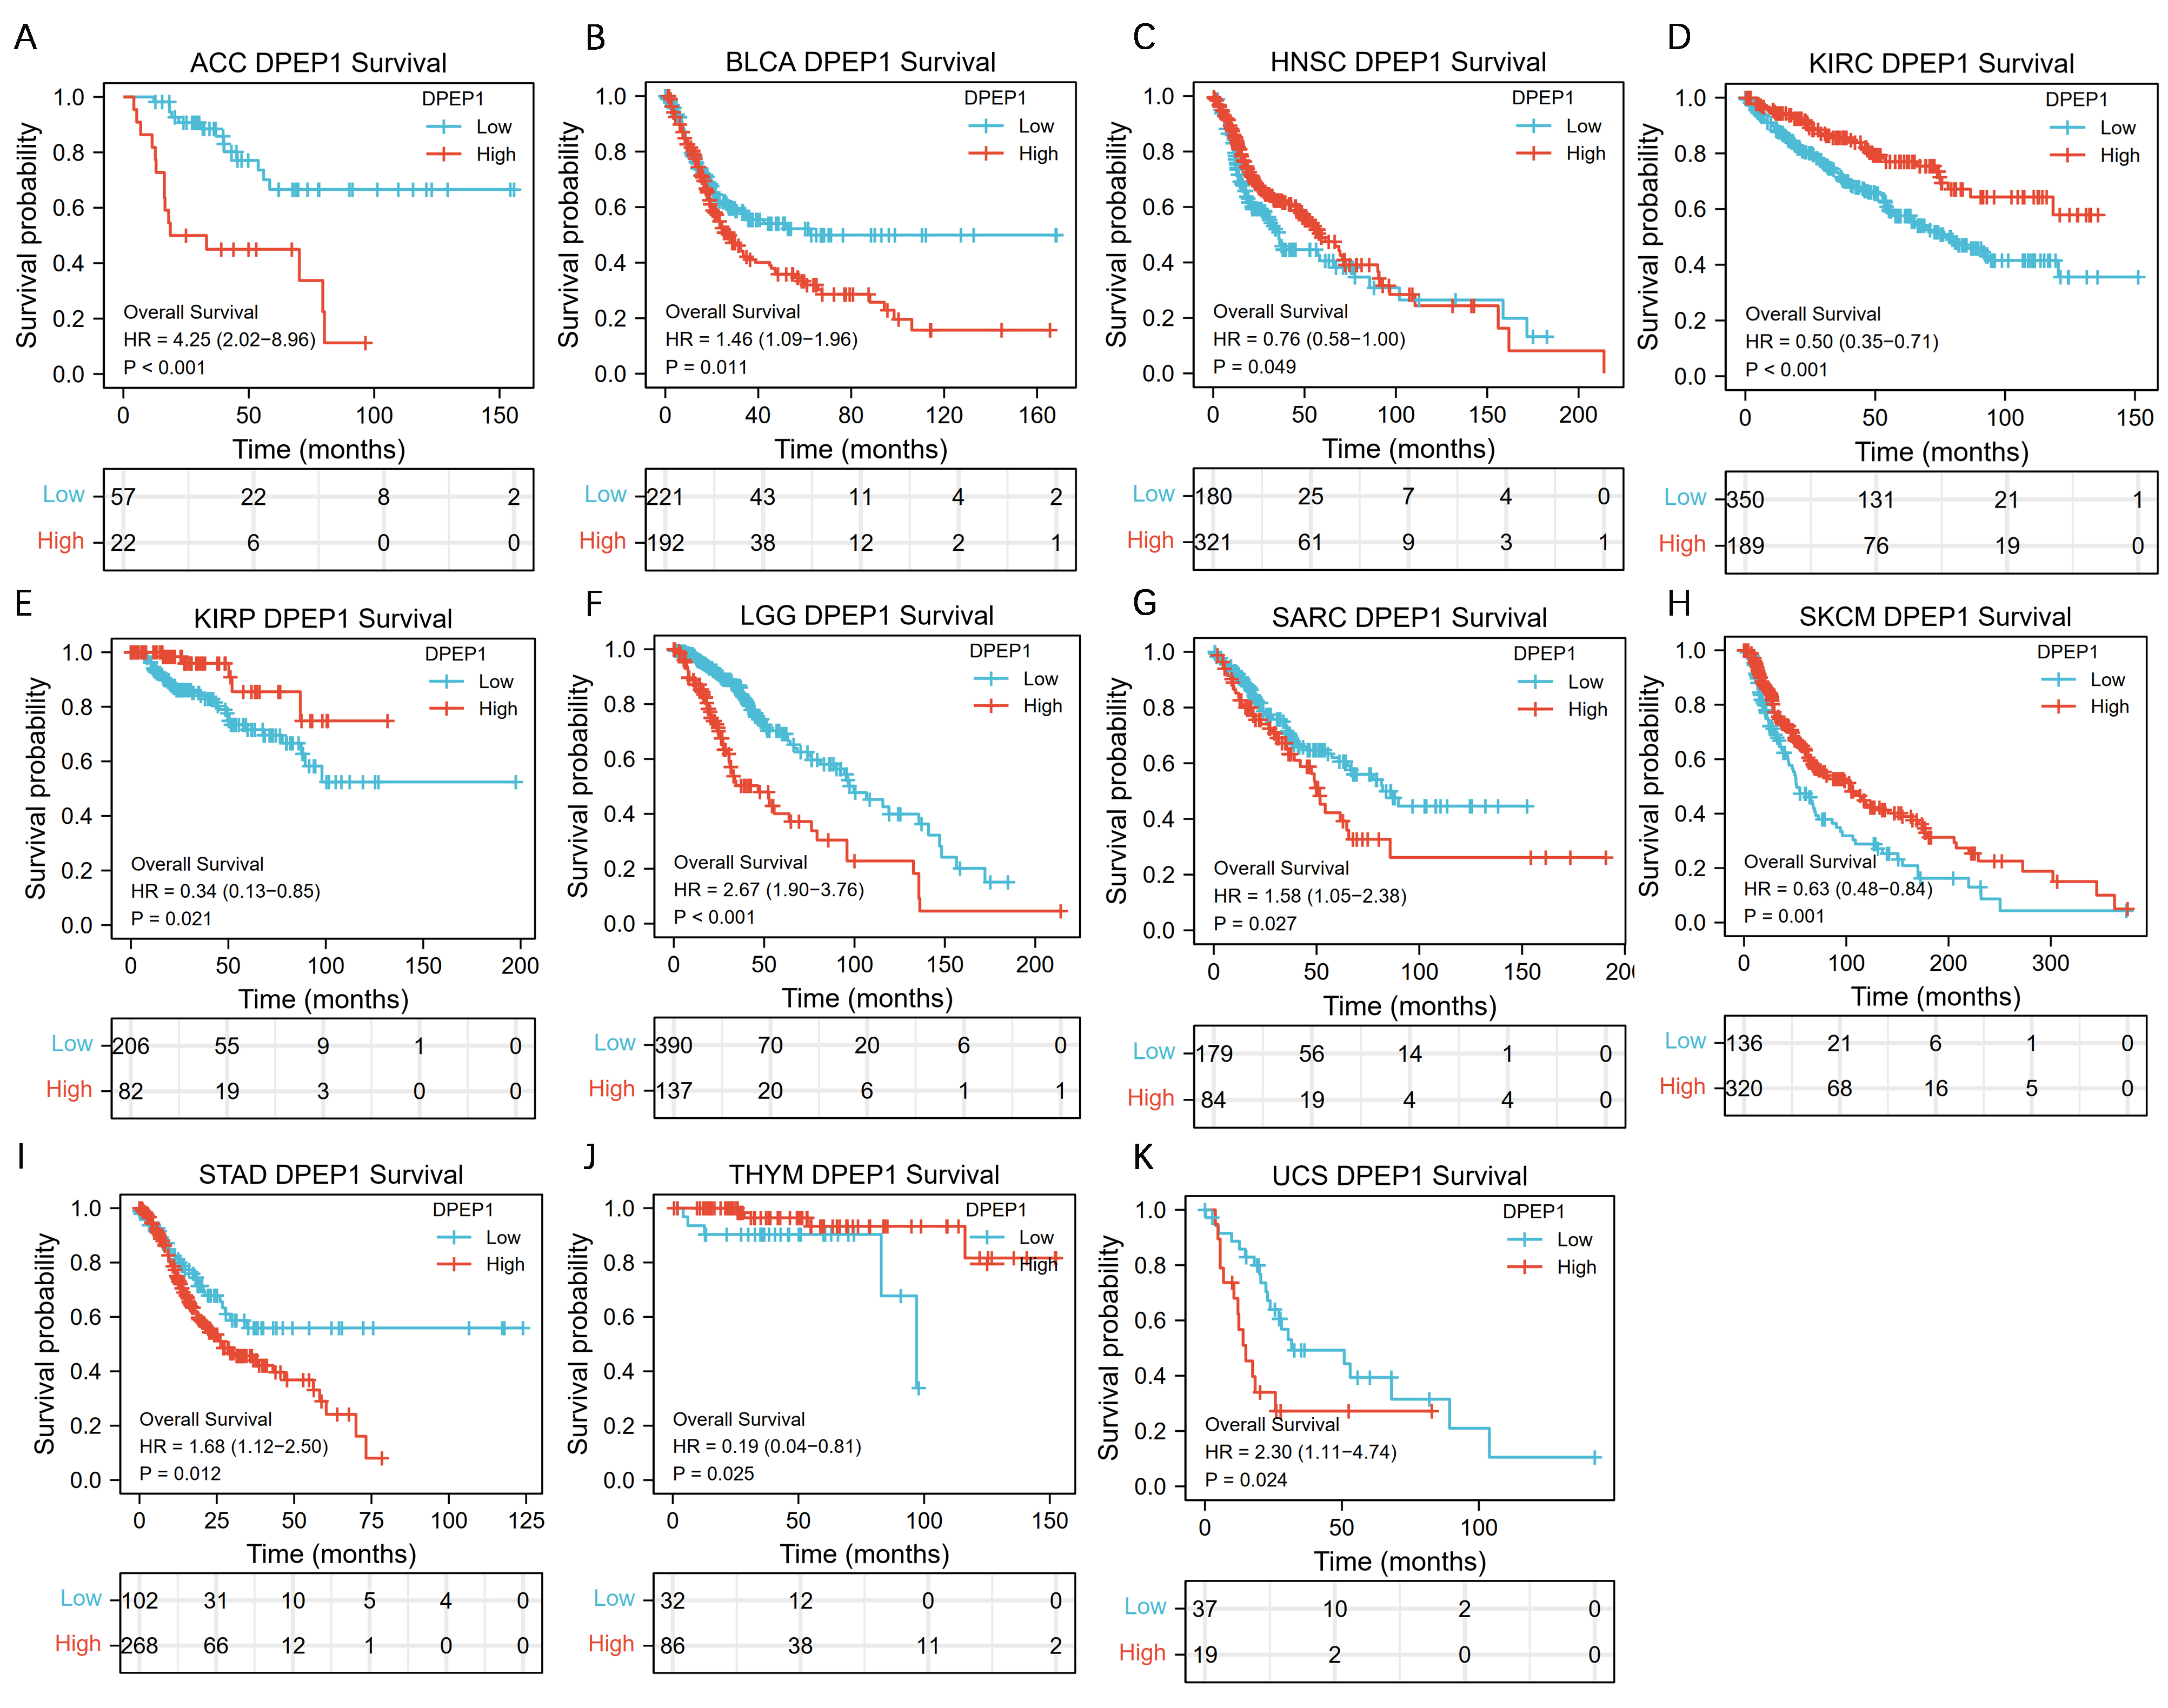
Survival analysis was performed using the R survival package to assess the prognostic value of the level of DPEP1 expression in colon cancer. Samples were divided into high expression groups and low expression groups with the best cutoff value for DPEP1 mRNA expression in colon cancer, and the OS, DSS and PFI of different expression groups were compared. Survival curves were plotted using the Kaplan-Meier method. Cox regression was used to evaluate statistical significance. p<0.05 was considered statistically significant. Moreover, overall survival analysis for DPEP1 in pan-cancer was conducted.
Correlation and enrichment analysis
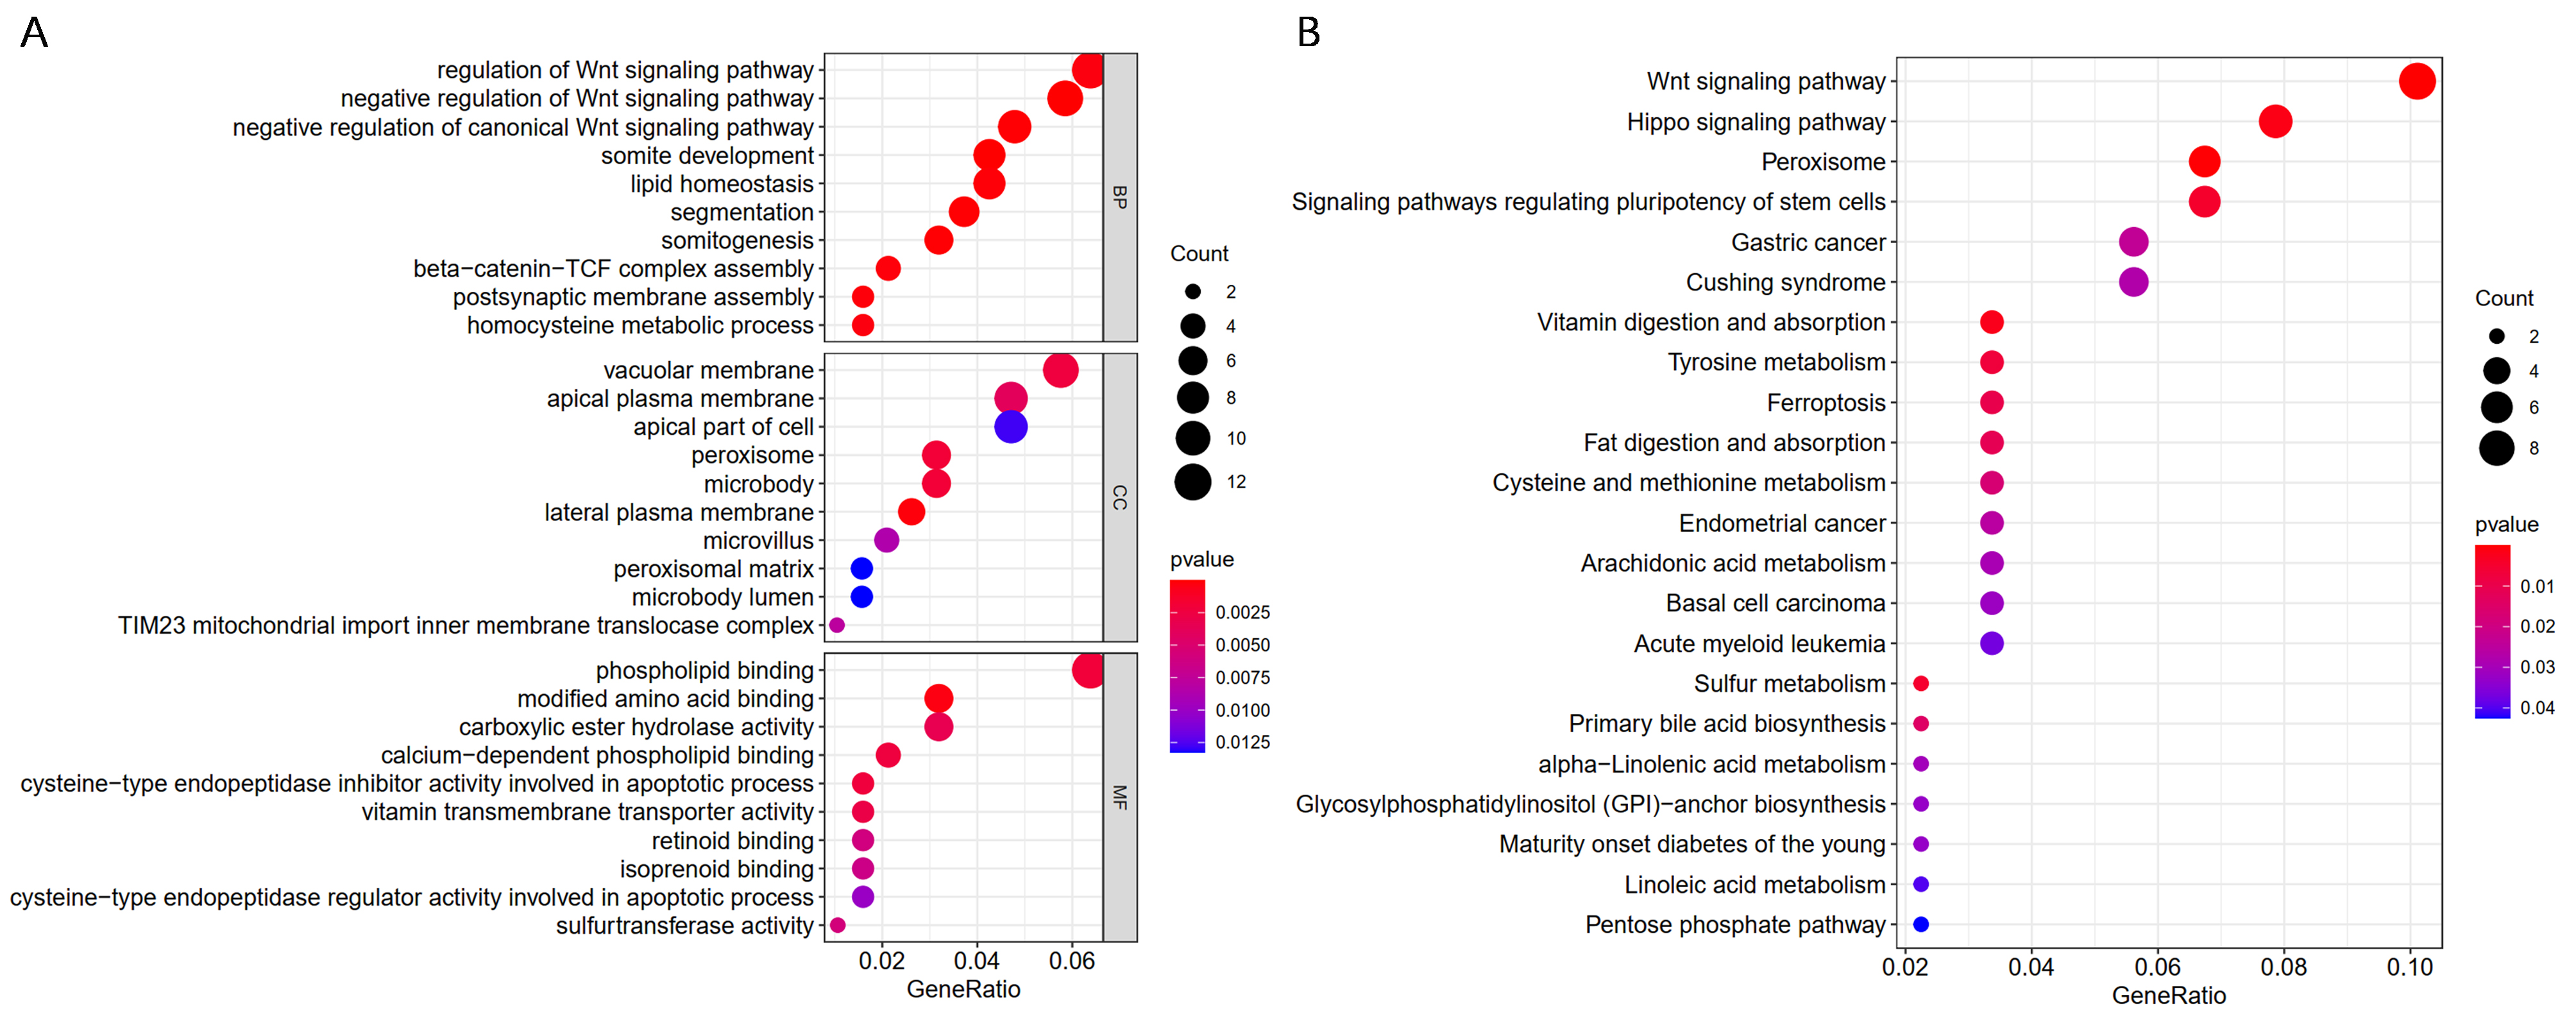
Pearson’s correlation analysis of DPEP1 mRNA and other mRNAs in colon cancer was performed using TCGA COAD data. The top 200 genes most positively associated with DPEP1 were selected for Gene Ontology (GO) analysis and Kyoto Encyclopedia of Genes and Genomes (KEGG) pathway enrichment analysis to determine the function of DPEP1. GO enrichment analysis included molecular function, biological process, and cell components. The ‘ClusterProfiler’ package in R software was used to analyze the functional enrichment with a p value<0.05.
Immune cell infiltration analysis
TIMER (https://cistrome.shinyapps.io/timer/) is a web tool for the comprehensive analysis of tumor-infiltrating immune cells. We analyzed the correlation of DPEP1 and ASCL2 expression levels with immune cell infiltration levels, including B cells, CD4+ T cells, CD8+ T cells, neutrophils, macrophages, and dendritic cells. In addition, the TIMER database was also used to analyze the correlation of DPEP1 and ASCL2 expression levels with the biomarkers of immune checkpoints in colon cancer. A p-value <0.05 was considered statistically significant.
GSCA (http://bioinfo.life.hust.edu.cn/GSCA/#/) is an integrated database for genomic and immunogenomic gene set cancer analysis and was used to explore the association between immune infiltrate and the expression score compiled by the GSVA of a gene set including DPEP1 and ASCL2.
GEPIA (http://gepia.cancer-pku.cn/index.html) is a newly developed interactive web server to analyze the RNA sequencing expression data of 9,736 tumors and 8,587 normal samples from the TCGA and GTEx projects, using a standard processing pipeline. GEPIA was utilized to analyze the correlation of DPEP1 and ASCL2 expression levels with biomarkers of immune checkpoints in colon cancer. |R|>0.1 and p value <0.05 were considered statistically significant.
Cell transfection
Cell transfection was performed using TurboFect Transfection (Thermo Fisher Scientific, USA) according to the manufacturer’s protocol. Briefly, cells were seeded in six-well plates (Corning, USA), grown to a cell density of 70% and then transfected and cultured at 37°C for 48 h.
RNA extraction and qRT-PCR
Total RNA was isolated using the TRIzol reagent (TaKaRa, JPN) according to the manufacturer’s protocol. One milligram of RNA was used for cDNA synthesis using a TaqMan cDNA synthesis kit (TaKaRa, JPN). qRT-PCR was conducted using a SYBR Green PCR Kit (TaKaRa, JPN) on a 7500 Real-time PCR System (TaKaRa, JPN). The primer sequences were listed in Supplementary Table 1. The 2−△△Ct method was used to calculate the relative levels.
Western blotting
The cells were washed with PBS, and then the proteins were extracted using RAPI lysis (Sangon Biotech, China). Proteins were segregated using 8% SDS-PAGE and transferred to PVDF membranes (Millipore, USA). The PVDF membranes were then incubated with DPEP1 (dilution: 1: 1000, Abcam, UK), ASCL2 (dilution: 1: 1000, Abcam, UK), β-actin antibody (dilution: 1: 4000, Sangon Biotech, China) or ubiquitin (dilution: 1: 1000, Boston Biochem, USA) after incubation with goat anti-rabbit or goat anti-mouse IgG HRP antibody (dilution: 1: 5000, Sangon Biotech, China). The bands were measured using an ECL detection kit (Labgic, China). The gray analysis for the protein bands was performed using ImageJ software.
Immunohistochemical staining
Immunohistochemical staining assays were performed according to a published paper[14]. The primary antibody used in the experiments was as follows: ASCL2 (dilution: 1: 100, Abcam, UK) and DPEP1 (dilution: 1: 100, Abcam, UK).
Co-immunoprecipitation (CoIP) assays
Co-immunoprecipitation assays were performed according to previous protocols[14].
Protein stability experiments
HCT116 cells were transiently transfected with pCMV or pCMV-DPEP1 in 6-well plates. SW620 cells were transiently transfected with siRNA (100 nM) or siRNA-DPEP1 (100 nM). After 48 h, the samples were treated with cycloheximide (CHX, Sigma, USA) at a final concentration of 15 mg/ml for 0, 0.5 and 1.0 h. The detail procedures were followed the previous methods[10].
Protein degradation assays
HCT116 cells were transiently transfected with pCMV-DPEP1 or pCMV plasmids. After 48 h incubation, the cells were lysed on ice for 30 min and then centrifuged at 15,000 rpm for 20 min. Lysates were incubated with ASCL2 primary antibody for 4 h at 4°C, and then protein A/G (Invitrogen, USA) was added overnight. Western blotting was performed, and an anti-ubiquitin antibody was employed to test the relative degradation levels of ASCL2 proteins in the cells.
Dual luciferase reporter experiments
To test the transcription activity of DPEP1 promoter, we constructed the DPEP1 promoter (-1500bp/+200bp region) into pGL3-Basic plasmids, and then tested the activity of pGL3-DPEP1 promoter by the Dual luciferase reporter experiments. The dual luciferase reporter experiments were performed as previously described[15].
MTT assays
Cells from each group were seeded in 96-well plates at a density of 5000 cells per well and were incubated at 37°C for overnight. The culture medium was replaced with fresh culture medium with different concentrations of oxaliplatin (0, 40 and 80 µM) or irinotecan (0, 5 and 10 µM) with 5 replicates each. After 48 h incubation, 20 µl MTT (5 mg/ml) was added to each well and incubated at 37°C for 4 h. Subsequently, the culture medium was removed, and 150 µl DMSO was added to each well. After shaking for 10 min, the 96-well plate was read on an enzyme-labeled device at 490 nm to calculate the cell viability rate.
Statistical analysis
All results are shown as the mean ± standard deviation. GraphPad Prism 5 software was used to conduct statistical analyses. Student's t test or one-way analysis of variance was used to determine significant difference. P < 0.05 (*), p < 0.01 (**) and p < 0.001 (***) were statistically significant. All experiments were repeated independently at least three times.