Here, we first discuss each section separately, before summarizing the key results.
- Year of registration
An analysis of the year-wise registration of trials has been performed by other workers as well [4]. They analyzed the 3,325 trials registered with CTRI up to 2015. In contrast, this study focused on interventional drug trials up to early April 2018, and distinguished the India-only and India-etc subsets of trials. The slow start in 2007 and 2008, followed by a big jump up in 2009 was common to the Chaturvedi et al. study and both our datasets. However the other group observed a strong drop in 2011, which neither of our datasets demonstrated. Also, the strong drop in 2013 observed by Chaturvedi et al. was observed only for our India-only set. These differences can be traced to the different data that was analyzed by the two groups.
CTRI was established only in 2007, and that is the reason for the initial low numbers. In 2009, registration became compulsory [12] and that led to the jump in both the Chaturvedi et al. study, and in both of our datasets. This is similar to the upsurge of trial registrations at ClinicalTrials.gov after the International Committee of Medical Journal Editors announced its requirement that trials be pre-registered if the results were to subsequently be published in their journals [13]. In May 2012, the Parliamentary Standing Committee on Health and Family Welfare severely criticized the office of the Drug Controller General of India (DCGI) [14]. Soon thereafter the government constituted the Prof. Ranjit Roy Chaudhury Expert Committee. The recommendations of this committee [15], and orders of the Supreme Court [16], had a chilling effect on the number of trials being registered, from which the situation recovered only in 2017. As noted above, the reduced activity was significantly more pronounced in the India-etc set. Sponsors that had initiated or planned multi-country trials which included sites in India moved them elsewhere and were slow to look at India again [17]. The notification that from 1 April 2018 trials had to be prospectively registered, would account for the large spike in registrations in 2017.
Separately, in 2009, it was noted that whereas ClinicalTrials.gov listed 700 trials with sites in India, CTRI listed a mere 155 [2], indicating that trials running in India were significantly under-registered with CTRI in the early years of the registry. This is unlikely to be the case now, since, as of early April 2019, there were just 3,661 studies registered with ClinicalTrials.gov that listed India as a country of recruitment, whereas there were 18,353 trials registered with CTRI. Of these, 17,168 (93.5%) were India-only trials; 1,102 (6%) India-etc trials; 80 (0.4%) foreign trials; and 3 records did not list any country of recruitment. Given the large increase in the number of trials registered with CTRI in recent years, it is likely that most, if not all, relevant trials currently registered in the US, are also registered with CTRI.
- Phase of trial
In terms of the phases of India-only trials, the largest set – 30% – concerns N/A cases. This is surprising for interventional drug trials. Only 1% of the India-etc set did not list the phase, and thus the reporting of the phase of trials running in India appears to be much better for multi-country trials than domestic ones.
For the India-only trials, if we ignore the N/A cases, there was a trend of decreasing numbers of trials in Phases 3, 4, 2 and 1. This was consistent with the previous study of CTRI data referred to above, although in that study the fraction of trials in Phase 3 was about double that in this set, and the totals for trials in Phases 4 and 2 were much closer [4].
The India-etc set had a different trend of decreasing numbers of trials in Phases 3, 2 and 4. Also, Phase 3 trials dominated the India-etc set more emphatically, accounting for 71% of the trials, in contrast to just 25% in the India-only set.
For comparison with the Indian scenario, we looked at the trend in two other registries. In Australia, for drug trials over the years 2006–2015, there were decreasing numbers of trials in Phases 3 (39%), 2 (25%), 4 (14%) and 1 (14%) [18], which parallels that in the India-etc set. An Advanced Search of ClinicalTrials.gov on 6 April 2019, for all interventional trials (excluding those for Expanded Access) that have run in the US, revealed a sequence of Phases 2 (29,514), 1 (21,650), 3 (13,537) and 4 (7,635) in decreasing order.
It is clear that compared to the situation in the Australian and US registries, Phase 1 trials, the phase that includes first-in-human trials, which carry the highest risk, are not abnormally abundant in India. Further, since Phase 3 trials require the largest number of participants, they are often the subject of off-shoring [19]. Therefore it is unsurprising that this phase leads the Indian trials, especially in the India-etc set.
- Sites of study
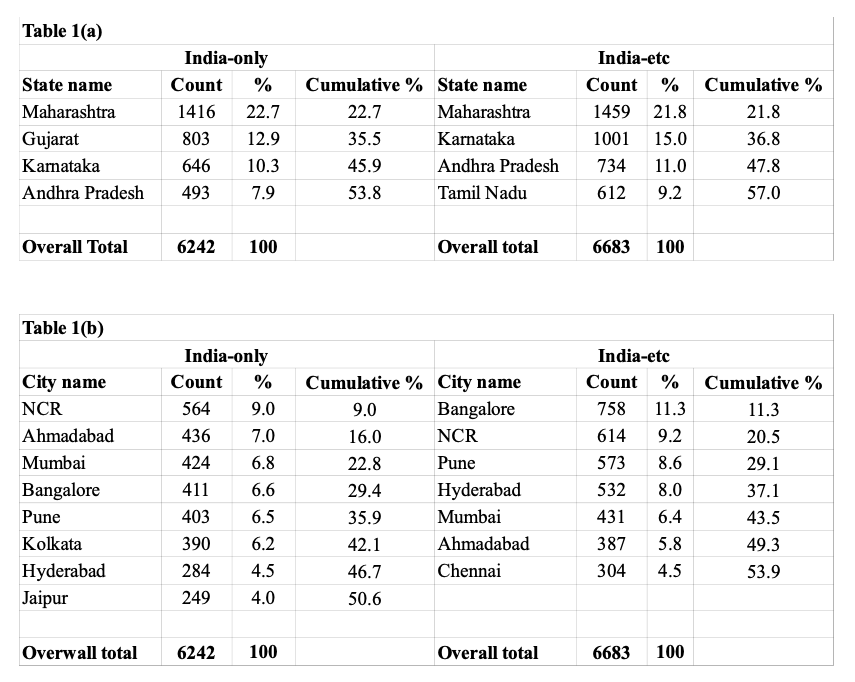
Trials in India have taken place in a large number of cities, only some of which are highly cosmopolitan. This is relevant to the question of whether or not trials are taking place in representative populations of the entire nation. The above-mentioned 59th Parliamentary Report commented that “In response to a question as to how various ethnic groups are being enrolled in Phase III clinical trials, the Committee was informed that “most trials were taking place in cosmopolitan towns. It is understood that cosmopolitan cities have a heterogeneous population comprising various ethnic groups. Otherwise there is no proactive, specific procedure to test new drugs on different ethnic groups.” [14]. The data above suggests that this response is incorrect. Only 1,683 (27%) of the India-only and 2,335 (35%) of the India-etc trials took place in the truly cosmopolitan cities of Bangalore, Hyderabad, Mumbai, and NCR. Even accounting for some people from other states in any given city, it can be safely stated that over 50% of the trial sites were in less cosmopolitan cities. Since the report specifically discussed Phase 3 trials, we also looked into this subset. Unsurprisingly, the trends were similar.
Further, we note that many trials (67, or 1%, for the India-only and 231, or 4%, for the India-etc sets) did not list the city from which they recruited trial participants. Either the data was not entered, and therefore this is a data quality issue, or it was not registered in a consistent way, and therefore was not downloaded, in which case it is a data formatting issue.
Finally, in order to strengthen the quality of trials, it is important that trial sites be inspected regularly but randomly. Even the US Food and Drug Administration (FDA), which has limited resources to inspect sites, inspected 1.9% of all domestic sites and 0.7% of all foreign sites in 2008 [20]. The concentration of trials in a few Indian cities indicates that more inspections should happen in these cities. There must also be random inspections of sites in the many other cities that host trials. Health activists have stated that currently hardly any inspections happen [21]. If so, the situation must improve, and if regional offices for inspections are set up, it would be prudent to set them up in cities or states which host the largest number of trials.
- Details of ethics committees
We turn to the distribution of numbers of ethics committees per trial. These numbers are merely a reflection of the large number of sites at which trials are running. Our results show that whereas most India-only trials require only one ethics committee, the India-etc trials tend to require more. We have separately shown that most India-etc trials are sponsored by multinational pharma companies. Since it has been asserted that drug-marketing is part of drug-testing, and vice versa, the larger number of sites per trial for India-etc compared to the India-only trials might reflect the marketing efforts of the multinational companies.
Be that as it may, the large number of ethics committees per trial seems to be impractical, given the fact that various problems have been noted with the functioning of these committees in India. Documented examples of such problems include (a) only three of 11 committee members attended a meeting; (b) on average it took 90 seconds to approve a proposal; (c) a committee member was removed for not approving a trial [19] and (d) clinical experts, including those from prestigious public and charitable institutions, colluded with companies to fake letters to the regulator [14]. As such, it is possible that some approvals were obtained in a less-than-authentic manner, in which case the large number of committees per trial is something of a charade. Instead, it might be advisable to have a single, high quality ethics committee per trial. The pros and cons of a single ethics committee for a multi-site trial have been debated elsewhere [22, 23]. Both the US and the European Union (EU) have taken steps to address this issue, although their concerns have been different, and relate to the fact that the approval of a trial by multiple ethics committees slows down the trial. In the US, in 2016, the National Institutes of Health (NIH) issued a new policy that required multisite trials, if funded by the NIH, to use a single Institutional Review Board (IRB). Following this, in 2017, the NIH’s National Center for Advancing Translational Sciences (NCATS) created the NCATS Streamlined, Multisite, Accelerated Resources for Trials (SMART) IRB Platform to facilitate this [24]. And under the Final Rule announced in the US in 2017, cooperative, multi-institutional trials, usually require only one ethics committee’s approval [25]. In the EU, a recent regulation also usually requires clearance by a single committee regardless of how many countries the trial is running in [26].
- Details of Principal Investigator
In 2011, it was noted with concern that there was a PI who had run as many as 25 trials in India [27]. And in 2016 it was noted that a clinician had simultaneously run 10–15 trials in the country [28]. In our analysis, one PI in the India-only set (who had run 39 trials) and two in the India-etc set (33 and 44 trials, respectively) had exceeded the number 25, although it is not known how many of these trials ran simultaneously. One needs to be concerned about a given PI running many trials in India. It is known that the specialist:patient ratio in India is poor [28], and it is also widely acknowledged that the workload on Indian doctors can be extremely heavy. This gives rise to the apprehension that a doctor may not be able to take adequate care of the participants in multiple trials. Although all of these PIs may have run their trials perfectly, any plan to audit trials in India should include such cases.
- Details of primary sponsors
In terms of the nature of the primary sponsor of the India-only trials, certain public sector hospitals had sponsored the maximum number of trials. However, overall, the local pharma industry was the biggest sponsor and the global pharma industry sponsored less than 5%. Of concern, almost 4% of the trials did not list a sponsor. Also, due to variations in the name of a given sponsor, manual cleaning reduced the number of sponsors by one-third. Names need to be entered in a uniform way, to provide for automated analyses of the sponsors of thousands of trials.
In terms of the nature of the primary sponsor of the India-etc trials, the top 10 sponsors were well known multinational pharma companies, which are known to be among the top sponsors of trials [29]. This is also unsurprising given the increasing off-shoring of trials to developing countries in recent years [19]. However we have three concerns regarding the data, as follows: (a) in one case, the World Health Organization was classified as a Government funding agency. There probably needs to be a separate category for such organizations, which should not be clubbed with funding agencies of state governments or the Government of India. (b) A large Indian pharma company was classified as Pharmaceutical industry-Global. Whereas it is true that the company has become a global company, it is an Indian-origin company, which became a global company only in recent years. Perhaps some distinction should be made between such Indian-origin, global companies and multinational companies based abroad. (c) the variants in sponsor names or classification necessitate significant manual cleaning of the data. It would be better if CTRI had a more uniform method of recording each sponsor’s name or category.
- Number of subjects from India and elsewhere in India-etc trials
We went on to examine the fraction of trial participants from India out of the total number of participants for a given India-etc trial, phase-wise. There have been apprehensions about people in developing countries being used as guinea pigs for trials planned by organizations in the developed world [27, 30, 31]. However, in terms of the fraction of participants from India in global trials, the results were reassuring, since most trials recruited less than 40% of participants from India. As such, an abnormally large number of participants were not planned to be recruited from India. Furthermore, seven (24%) of the 29 trials, for which the planned recruitment from India exceeded 60%, were sponsored by Indian companies, and therefore the high percentage was unsurprising. Nevertheless, there is another angle we need to examine. There have been cases in the past where about half the recruits in an international trial were planned to be recruited from India, but in fact more than 80% were [27]. We identified one case where indeed there was a sharp increase from planned to actual recruitment from India. However, for almost half the trials, the records had not been updated with actual recruitment, and therefore there was no way to determine whether this phenomenon was common or not. The outdated records are cause for concern.
- Details of the countries co-hosting the India-etc trials
We went on to examine the foreign locations for the India-etc trials. Of the top 10 countries which co-hosted trials with India, eight countries overlapped the top ten countries which co-hosted interventional trials with Australia [18]. And since one of the top 10 countries in the Australian list was its neighbor New Zealand, it is unsurprising that the latter country was not a top co-host of trials in India. Similarly, five of the top six co-host countries for the India-etc trials overlapped the top seven countries for international trials that tested a drug or biological and were registered with ClinicalTrials.gov [32]. As such, the pattern of countries co-hosting trials with India was similar to that noted in Western nations.
In terms of the distribution of the number of countries per trial of the India-etc trials, we can compare the figures with those in two other reports. (a) One study examined global trends of interventional trials registered with ClinicalTrials.gov, and compared the distribution of the number of countries involved per trial in the time periods 1999–2003 and 2009–2013 [33]. Over the two time periods, there was a large reduction in the number of trials that ran in just two countries, and a significant increase in the number that ran in six or more nations. In the period 2009–2013, approximately 33%, 16%, 16% and 33% of the 6,000 trials ran in two, 3–5, 6–10 and over 10 countries, respectively. Of the 606 multi-country trials that ran in India, only 9% involved two countries and 56% involved 10 or more countries. (b) Another study, mentioned above, looked at international trials that took place in Australia from 2006–2015 [18]. Here the authors compared the interventional trials registered with ClinicalTrials.gov with those registered with ANZCTR. The 3,013 multi-country trials registered with ClinicalTrials.gov had a pattern closer to the Indian one, since 9%, 8%, 15%, 21% and 47% of the trials ran in two, three, 4–6, 7–11 and over 11 countries, respectively. However the 470 multi-country trials registered with ANZCTR had a different pattern, since 58%, 10%, 16%, 9% and 8% trials ran in two, three, 4–6, 7–11 and over 11 countries, respectively. The trials registered with ClinicalTrials.gov were more likely to be drug trials than those registered with ANZCTR, and this may explain the different patterns.
There are many problems with how trials are run in India [14, 28, 34], but on the face of it, for trials being co-hosted by India and one or more other countries, the identity of co-host countries, and the pattern of co-hosting trials is similar to that of a major Western nation, that is Australia.
Summary
In this paper we have only analyzed data provided in the records at CTRI. We have not looked into other important issues such as the quality of clinical trial infrastructure, the general lack of high quality healthcare that drives many of the participants to trials, or the post-trial availability of test drugs [35], for instance. We have focused on two sets of interventional, drug trials run in India, that is those that have run only in India, the India-only set, and those that have also run elsewhere, the India-etc set. We analyzed eight fields of data, and the data sometimes showed different patterns in these two sets. Our findings, in brief, were as follows:
(i) In terms of the year of registration, only the India-etc set suffered a (serious) dip in 2013. Both sets increased sharply in 2017.
(ii) In terms of the phase of the drug trials, in decreasing order, the frequencies were Phases 3, 4, 2 and 1 for the India-only set and Phases 3, 2, 4 and 1 for the India-etc set, with 3% or less for Phases 1/2, 2/3 and 3/4 in each of the two data sets. Notably, (a) Phase 3 trials were manifold more common in the India-etc set, and (b) there was no phase information for 30% of the India-only trials.
(iii) Four states account for 50% or more of the trials in both sets of data, with three states common to the two lists. The India-only and India-etc sets of trials ran in 164 and 121 cities, respectively. Eight and seven cities, respectively, accounted for 50% or more of the trials in these two sets, with six of the cities common to the two lists.
(iv) Whereas the maximum number of ethics committees for a given trial was quite close, at 61 for the India-only and 66 for the India-etc sets, the distribution of numbers of ethics committees per trial was very different in the two sets. Thus, whereas 71% of the India-only trials had one committee, 6% of the India-etc did so.
(v) In terms of the names of PIs, the India-only set were much better at reporting this data than the India-etc set, with names going unreported for 5% and 40% of the two sets, respectively. Also, whereas 84% of PIs of India-only trials had run just one trial, 73% of those in India-etc trials had done so. Seven and four PIs in these two sets, respectively, had run 10 or more trials each.
(vi) Primary sponsors: In the India-only set, Indian pharma companies sponsored the largest number (29%) of trials, whereas the global pharma companies sponsored less than 5%. In the India-etc set, 92% of the sponsors were global pharma companies.
(vii) For most India-etc trials, the planned recruitment from India did not exceed 40% of the total participants. However for most trials there are no records of what the actual recruitment was, and these incomplete records are cause for concern.
(viii) The countries co-hosting trials with India, and the distribution of number of countries per trial, was similar to that found for most international trials co-hosted by Australia.
Finally, we note that the study has some limitations, as follows: (a) we have analyzed only a fraction of the interventional, drug trials registered with CTRI as of April 2018. (b) we have analyzed only eight facets of the data concerning these trials. A comprehensive understanding of the data hosted by CTRI would require many more analyses. And (c) our analysis cannot attest to the validity of the inputted data.