Selection of participants
We screened 97 patients with COPD during the inclusion period. Of these, 23 were excluded due to treatment interruption (in <1 year [n = 13], 1 to <2 years [n = 3], 2 to <3 years [n = 5], or in 3 to <4 years [n = 2]) and 9 patients were excluded due to hospital transfer (for respiratory failure [n = 5], for cancer [n = 2], or for pneumonia [n = 2]). After exclusions, 65 patients with COPD were assessed by spirometry and IOS and followed up for 5 years (Fig. 1).
Smoking status and comorbidities are described in Fig. 1. Patients were current smokers (n = 13, comprising 3 continuous smokers and 10 intermittent smokers) or former smokers (n = 52, including patients who quit smoking at diagnosed with COPD). Recorded comorbidities were pneumonia (n = 25: hospital admission n = 9, outpatient n = 16), bronchial asthma (n = 24: high dose ICS n = 12, intermediate ICS n = 12, low dose ICS n = 0), cancer (n = 18: lung cancer n=7, colon cancer n = 4, stomach cancer n = 2, prostate cancer n = 2, laryngeal cancer n = 1, esophageal cancer n = 1, bladder cancer n = 1), cardiovascular disease (n = 17: arrhythmia n = 9, aortic aneurysm n = 5, arterial sclerosis obliterans n = 4, cerebral infarction n = 3, ischemic heart disease n = 1). Some patients had more than one disease.
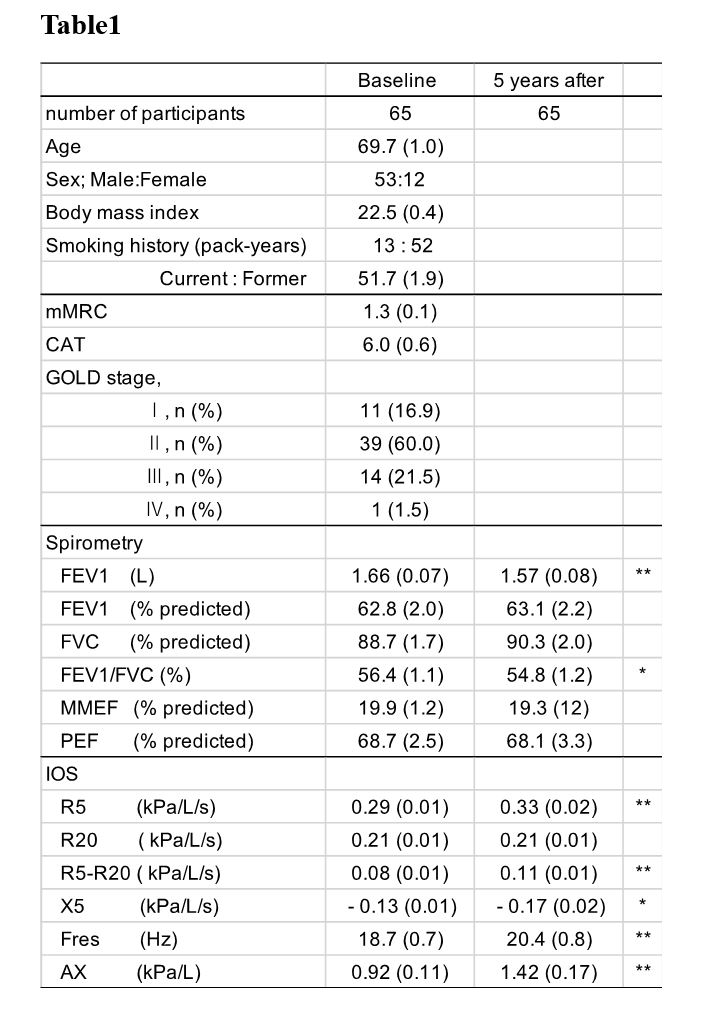
The baseline characteristics of the 65 participants and their spirometry and IOS 5 years after treatment are shown in Table 1. FEV1 and FEV1/FVC significantly decreased between baseline and 5 years but there were no significant changes in % FEV1, % FVC, % MMEF, or %PEF. Except R20, all IOS parameters were significantly reduced at 5 years after treatment.
Annual Change In Fev And Ios In Smoking Status
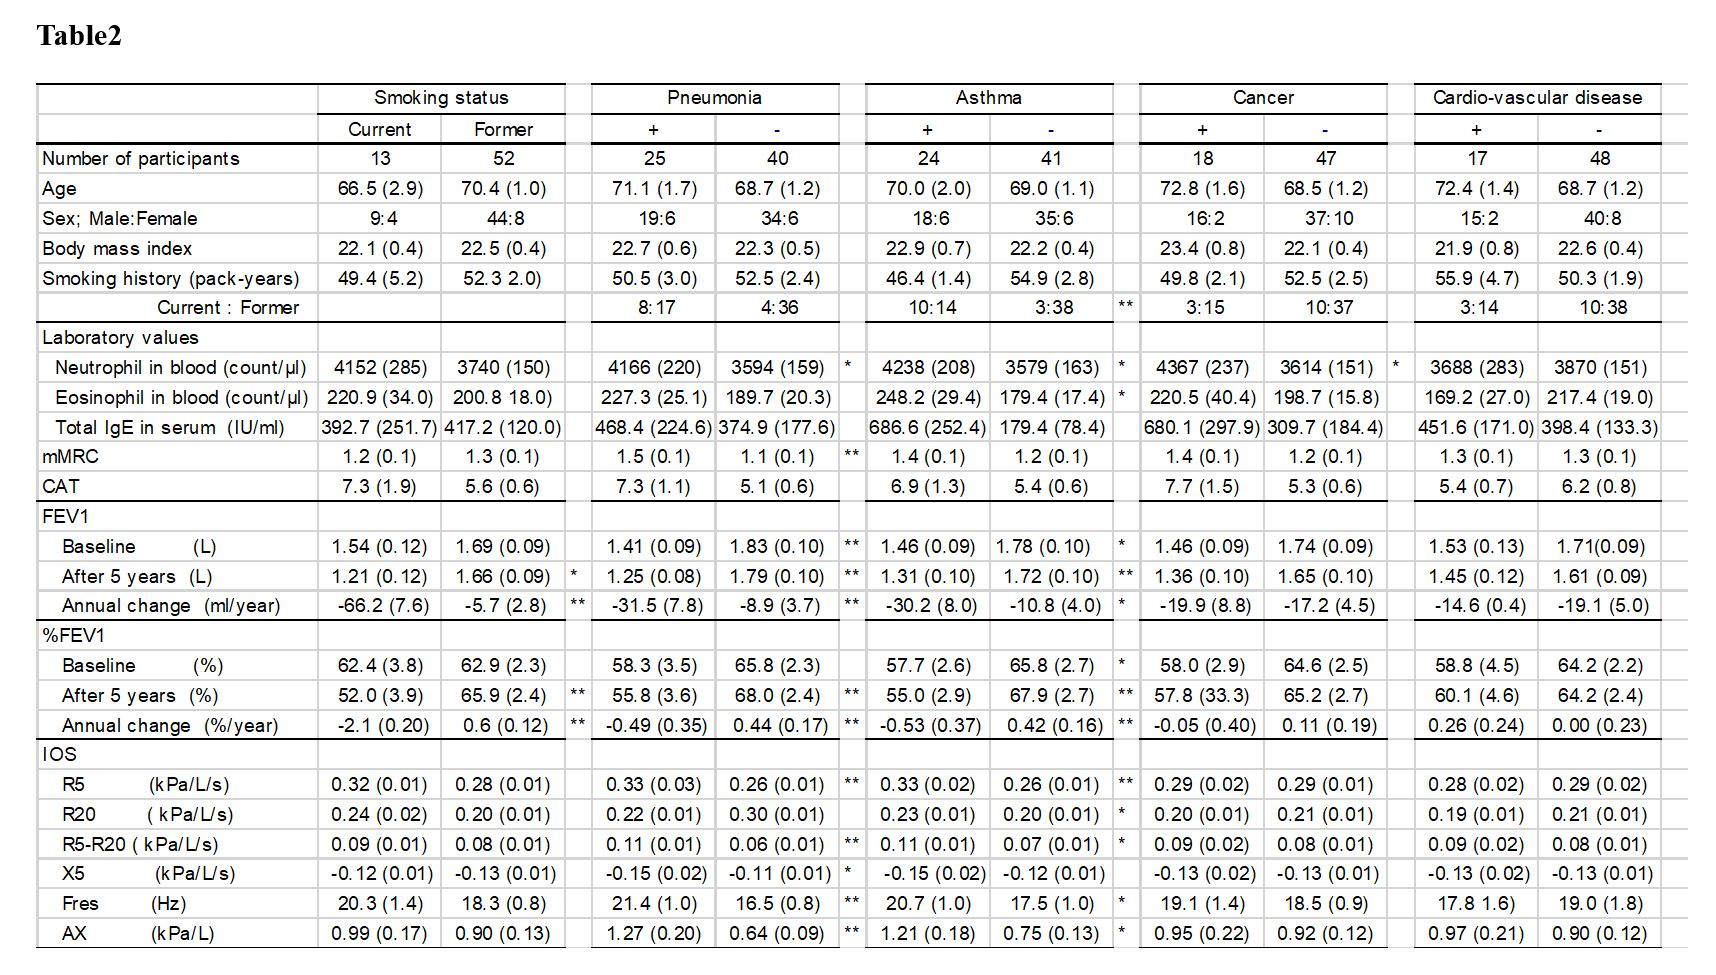
The annual change in FEV1 (mL/year) across 5 years varied widely, with a mean ± standard deviation (SD) of −17.8 ± 32.4 and a range from −142.0 to 34.0 (Fig. 2). Comparing changes over time in current and former smokers, FEV1 or %FEV1 were both significantly lower at 4 and 5 years after treatment in current smokers (Fig. 3). Comparisons between these cohorts are presented in Table 2. At baseline there was no significant difference in FEV1 between current and former smokers (p = 0.44) but 5 years after treatment it was lower in current smokers (p < 0.05). The annual changes in FEV1 and %FEV1 were significantly different between current and former smokers (−66.2 mL/year vs −5.7 mL/year; p < 0.01 and −2.1 mL/year vs 0.6 mL/year; p < 0.01, respectively). No IOS parameter differed between current and former smokers (Table 2).
Characteristics, the annual change in FEV 1 , and IOS in patients with and without comorbidities
Table 2 describes the characteristics of patients with and without each COPD comorbidity. There were no differences in age, sex, BMI, smoking history, total IgE, and CAT in the groups defined by presence or absence of any of the comorbidities. Patients with pneumonia, asthma, or cancer had higher neutrophil counts than those without each disease respectively. The asthmatic group included higher numbers of current smokers and had higher eosinophil counts than the non-asthmatic group (10:14 vs 3:38; p < 0.01 and 248.2 vs 179.4; p < 0.05, respectively). In the patients with pneumonia, the mMRC was higher than in those without pneumonia (1.5 vs 1.1, p < 0.05). CAT scores did not differ between any group.
At almost every annual timepoint, FEV1 and %FEV1 were significantly lower in patients with pneumonia or asthma than those without, but there were no differences in patients with or without cancer or cardiovascular disease (Fig. 4). There was significantly more annual decline in FEV1 in the pneumonia group than in the non-pneumonia group (−31.5 vs −8.9, p < 0.01) and in the asthma group than in the non-asthma group (−30.2 vs −10.8, p < 0.05). The annual decline in %FEV1 was notable in patients with pneumonia (−0.49 vs 0.44 in patients without pneumonia, p < 0.01) and asthma (−0.53 vs 0.42 in patients without asthma, p < 0.01). However, there was no change in annual decline in FEV1 and %FEV1 in patients with cancer and cardiovascular disease (Table 2).
Similar trends according to comorbidity were seen in IOS. Patients with pneumonia or asthma had higher R5, R5–R20, Fres, and AX values than those without, while the presence or absence of cancer or cardiovascular disease did not have a significant effect on the IOS results.
Characteristics, the annual change in FEV 1 , and the rate of comorbidity in groups classified by IOS parameters
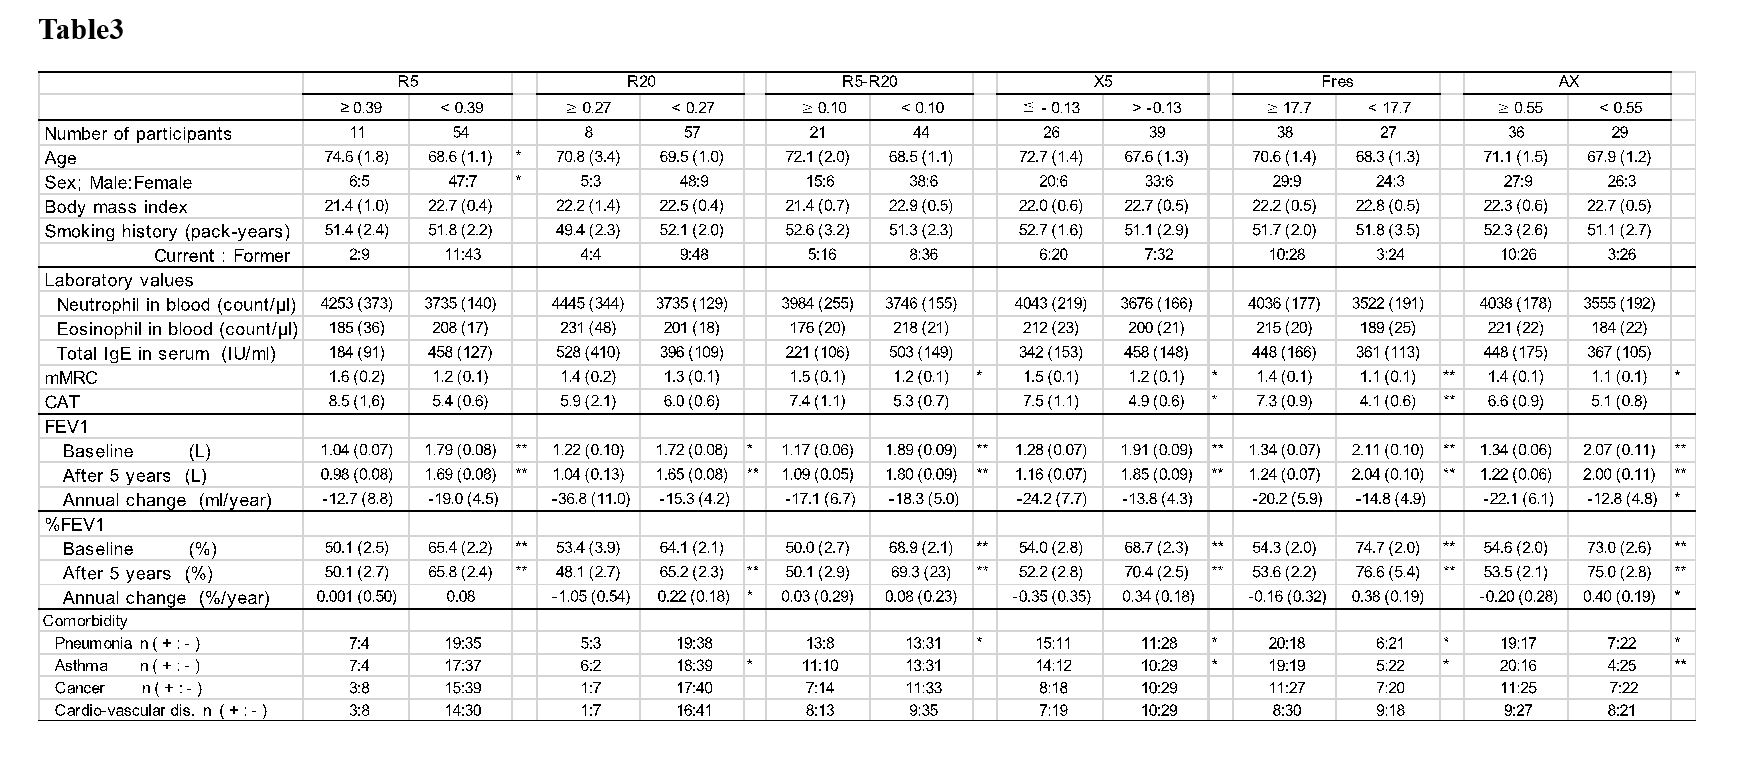
COPD patients were divided into high or low groups for each baseline IOS parameter and the differences in baseline characteristics, annual decline in FEV1 (%FEV1), and comorbidity rates compared (Table 3).
There was no significant difference in any baseline characteristic based on IOS parameters, except that the high R5 group had a higher age (74.6 vs 68.6, p < 0.05) and higher proportion of males (6:5 vs 47:7, p < 0.05). The mMRC of the high R5–R20 group, the low X5 group, the high Fres group, and the high AX group was significantly higher than the corresponding other group in each case (1.5 vs 1.2, p < 0.05; 1.5 vs 1.2, p < 0.05; 1.4 vs 1.1, p < 0.01; 1.4 vs 1.1, p < 0.05, respectively). The CAT score was significantly higher only in the low X5 group and the high Fres group (7.5 vs 4.9, p < 0.05, 7.3 vs 4.3 p < 0.01, respectively).
For the annual decline in FEV1 and %FEV1, only the high AX group was significantly lower than the low AX group (−22.1 vs −12.8, p < 0.05 and −0.20 vs 0.40, p < 0.05, respectively).
The ratios of each comorbidity were also compared between the groups classified by IOS values. The high R5–R20 group, the low X5 group, the high Fres group, and the high AX group had significantly higher numbers of patients with pneumonia than the corresponding other group (13:8 vs 13:31, p < 0.05; 15:11 vs 11:28, p < 0.05; 20:18 vs 6:21, p < 0.05; 19:17 vs 7:22, p < 0.05, respectively). For asthma, significant differences were observed between the groups based on R20 (6:2 vs 18:39, p < 0.05), X5 (14:12 vs 10:29, p < 0.05), Fres (19:19 vs 5:22, p < 0.05), and AX (20:16 vs 4:25, p < 0.01). There were no differences in the ratios of patients with cancer or cardiovascular disease between the groups defined by any IOS parameter.