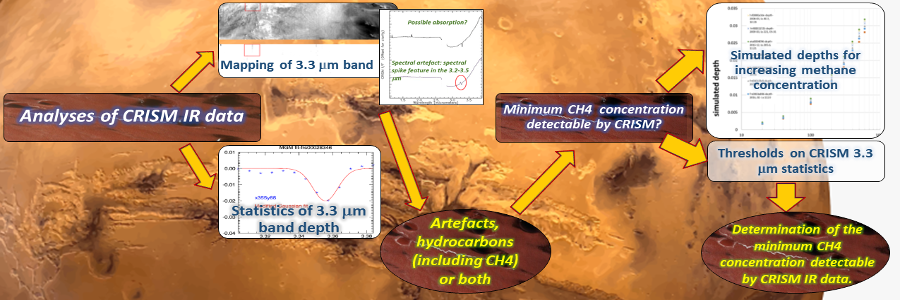
While analyzing NIR-IR CRISM data on a site in Oxia Planum area, in the view of the ExoMars2022 mission, absorptions around 3.3 µm were noted in some pixel spectra. Absorptions in the range 3.1–3.6 mm are under the spotlight in planetary contexts since hydrocarbons molecules show bands in this range. Consequently, we started to search eventual hydrocarbon compounds on Mars surface, using CRISM data in the range 3.2–3.4 mm. To date, methane has been the unique hydrocarbon detected on Mars. Like other hydrocarbons, methane shows absorptions around 3.3 mm. Hence, we begun the investigation on CRISM data, on that locations where methane was detected and where it could form on the basis of the mineralogy of the specific site. The datasets chosen for this study include some sites of observations in Oxia Planum area, Gale Crater and Nili Fossae area. Beside the study of CRISM IR data, in the event that some observed absorptions were related to methane, we tried to calculate a theoretical lower limit of detection for each observation in CRISM data. This was performed using the Planetary Spectrum Generator, simulating the CRISM spectra of the different sites, with the diverse concentrations of CH4. These simulations served to establish the relation between concentration and methane band depths, as seen by CRISM spectrometer. Then, mapping the Modified Gaussian Model (MGM) fit on CRISM data, we extracted the band parameters of the absorptions in the 3.3 µm spectral region. Aside rare, suspected absorptions, an artifact was highlighted. Therefore, we took measures to avoid, as more as possible, this artifact from the interpretation of the 3.3 mm absorptions: distribution of clusters of pixels not vertically stacked and a rather conservative threshold on depth value. As result, we found interesting clusters of pixels which spectra overcome the imposed threshold. Furthermore, the threshold value varies from one observation to another, in a range between 0.0136–0.0237, that would correspond to a range of theoretical lower limits of concentration between 180 and 600 ppbv. Despite all the precautions, we consider that part of these absorptions could still be an artifact. Nevertheless, the aim of this paper is to show that CRISM data can show theoretically absorptions of hydrocarbons, and methane, in such quantities that in some observations are compatible with the order of the methane spikes effectively detected on Mars. Even if this work does not confirm nor deny the occurrences of methane seepages or hydrocarbons in the investigated images, it shows a possible method for searching hydrocarbons in CRISM data and for assessing a confidence limit in the detection methane band in CRISM data.
Full paper
Investigation on the Absorption Bands Around 3.3 μm in CRISM Data
https://doi.org/10.21203/rs.3.rs-103126/v2
This work is licensed under a CC BY 4.0 License
Version 2
posted
You are reading this latest preprint version
Oxia Planum
Absorptions
hydrocarbons molecules
CRISM spectra
Modified Gaussian Model (MGM)
methane band
The great part of the missions on Mars is focused on the research of past/present life on the Mars surface and subsurface. In these last ten years a number of steps forward have been made in the knowledge of Mars environments that could constitute proxies for the development of primitive lifeforms. In this sense, the findings related to methane continue to be intriguing because on the Earth, part of it, formed by microbes from the domain Archaea in anoxic conditions during the Proterozoic age (Pavlov et al., 2003). Nevertheless, methane, like other hydrocarbon compounds, can result from abiogenic geological processes (Etiope et al., 2011, 2013). For the methane gas these can be serpentinization of basalts, (Oze and Sharma, 2005), gas absorbed in the regolith (Meslin et al., 2010; Gough et al., 2010) or geothermal processes (Etiope et al., 2011), release from subsurface clathrates Chassefière, (2009).
For what concerns methane, several instruments both orbiting and onboard rovers have detected this gas on Mars surface. Since 2003, several puzzling detections of methane in the Mars atmosphere were done (Atreya et al., 2007). For example, from Earth: using the Cryogenic Near-IR Facility Spectrograph (CSHELL) at the Infrared Telescope Facility (IRTF) and the Gemini ground telescopes, Mumma et al., (2004), detected localized points with >250 ppbv of methane. This concentration value was then corrected at 45 ppbv, comparing data with PFS measurements, in another paper on the methane mapping on Mars, (Mumma et al., 2009). The Fourier Transform Spectrometer (FTS) at Canada-French-Hawaii Telescope (CFHT) measured 10 ppbv, (Krasnopolsky et al., 2004). From Mars, through the Planetary Fourier Spectrometer on board the Mars Express mission, Formisano et al., (2004) obtained a methane concentration around 10 ppbv.
Therefore, looking also at the successive measurements from 2003, a distinction has to be made for what concerns methane detection on Mars: background detections in atmosphere and detection of “spikes” and “plumes” of methane which differ by orders of magnitude in ppb of concentration.
For what concerns quantitative measurements of methane background, some months ago, Korablev et al., (2019), looking at the first measurements of the Exomars 2016 Trace Gas Orbiter (TGO), which works in solar occultation, provided an upper limit of methane in the atmosphere above 5 km of <0.05 ppbv. Instead, the 3 years measurements of Mars Surface Laboratory (MSL)-Tunable Laser Spectrometer (TLS) onboard Curiosity found a background mixing ratio value in Gale crater of 0.2-0.6 ppbv (Webster et al., 2015, 2018) near the surface at night. To fillet these two measurements Moorees et al. (2019), hypothesized a diurnal cycle for methane in which it is essentially diluted during the martian day for the effect of currents convection, thus justifying the methane abundance found by TGO. During the night the Planetary Boundary Layer (PBL) drastically fall and diffusivity of the Martian atmosphere with it (Guzevich et al., 2017), making possible for the surface to “keep” small quantities of methane.
For what concerns spikes: the detection of Mumma et al., (2009), that observed a strong release of methane up to 50 ppbv during the Northern Hemisphere summer of 2003. Their observations ranged up to 3 years in which they observed a progressive decreasing in the methane mixing ratio over the three years and a substantial variation according to latitude. They concluded that the occurring of this strong release of methane was limited spatially and temporarily.
Later, other spatial-temporal investigations with other instruments confirmed this conclusion.
Using the measurements of the Mars Express Planetary Fourier Spectrometer, (MEX-PFS) in spot tracking mode Giuranna et al., (2019), exploited successfully the chance of finding in the atmosphere an increase of methane just the terrestrial day after the first methane spike detection from the surface by Curiosity on 15 june 2013. The amount of methane detected by PFS was about 15 ppbv vs the 9 ppbv detected by the SAM-TLS (Webster et al., 2015). The last detection of a methane spike was done by the Sample Analysis at Mars (SAM-TLS) onboard the Curiosity rover, on 19 June 2019, measuring an abundance of methane never detected before by a rover, i.e. around 21 ppbv (Announced during the AbSciCon 24-28 June 2019).
All these findings provide interesting constraints on the occurrence of methane on Mars.
In fact, summarizing the results of the previous observations, the source of Mars methane should be spatially restricted but also temporarily restricted with potential sources in form of seepages (Yung et al., 2018): from micro-seepages, (Etiope et al, 2015; Moores et al., 2019), mini-seepages (Etiope et al., 2015) to macro-seepages, (Oehler et al., 2017). Furthermore, the different amounts detected in spikes Table 1, the seasonal oscillations and the non-detections are compatible with geological seepage dynamics. These would involve changes in gradient of pressure and in the permeability of rocks (Etiope and Oehler, 2019) activated by different processes (Etiope and Oehler, 2019; Oehler and Etiope, 2017; Webster et al., 2015, 2018).
The variability of the amount of methane observed in these measurements (Mumma et al., 2009; Webster et al., 2015; Giuranna et al., 2019; Curiosity team, 2019, Korablev et al., 2019) and the estimated time for methane sequestration by photochemistry and oxidation that spans from hours to 3 hundred years (Dartnell et al., 2012), allow to hypothesize also that the plumes release observed was recent at the time of the measurements.
In summary, the seasonal and local variation of the amount of methane suggests that the sources could have an extension of meter to km scale.
As part of this work, we explored the chance to find clues of methane and/or other C-H compounds in CRISM IR data. In fact, the hydrocarbon compounds show absorptions in the IR range between 3.1 and 3.6 mm. On the other hand, CRISM has an IR range up to 3.92 mm with a spatial resolution capable of investigating the surface at a tens meter scale, compatible with localized hydrocarbon sources.
Oheler and Etiope, 2017, point out that due to the transient nature of the methane detected on Mars and the uncertainty on its lifetime in the Martian atmosphere, the only method for studying methane seepages on Mars surface is placing probes on the ground at fixed positions. This would allow constant sampling of the gas methane to determine fluxes and for minimizing the effects of isotopic fractionation of CH4 which is important to ascend to its origin. However, if macro seepages could be, at first, localized from remote sensing data, it would be possible to plan a landing mission for taking ground instruments and measuring methane fluxes directly on these macro seep sources.
Notwithstanding the low concentration of methane in Mars spikes and plumes, we started to look for methane eventual 3.3 mm absorptions in CRISM data with these premises:
- In June 2019, estimated CH4 abundance on Mars surface is about 20 ppbv by SAM-TLS (AbSciCon 24-28 June 2019), and it is unknown the distance of Curiosity from the source of the detected spike.
- Detection of a plume with a peak value of about 40 ppbv from ground telescopes during 2003 (Mumma et al., 2004, 2009) was integrated on a wide area. We hypothesize that this abundance on a broad area would potentially mean a greater concentration in the source sites.
- The time of survival of CH4 in atmosphere spans from hours to 3 hundred years (Dartnell et al., 2012).
- Since August 2012, Curiosity detected only two methane spikes during 2013 and 2019. Assuming that these sudden increases of methane concentration are sporadic, in our work, we were looking for CH4 absorption that eventually would correspond to spikes of CH4 in the scene, i.e. a concentration of methane greater than the values found for the background of some tens/hundreds of ppb. Consequently, we expected to find eventually few featured pixels/none in the greater part of the investigated images.
Beside methane, different studies such as Clark et al., (2009) and Kaplan (2016), Sadjadi et al., (2018) found that hydrocarbons, that represent the main group among organic compounds, show strong absorptions in the NIR range around 2.3 and IR range around 3.3 mm.
Absorptions at longer wavelengths (3.3-3.6 mm) are characteristics of aliphatic compounds whereas between 3.1 and 3.3 mm feature the absorptions of aromatic compounds (Kaplan, 2016).
Diverse remote hyperspectral systems have detected absorptions in these ranges on planetary surfaces for example: VIR on Ceres detected several features in a range between 3.3 to 3.6 μm spectral range characteristic of stretching modes of methyl (CH3) and methylene (CH2) functional groups (De Sanctis et al., 2017).
The feature at 3.3 mm is also typical of other more complex C-H compounds, the Polyciclic Aromatic Hydrocarbons (PAH), (Tokunga et al., 1991). PAH’s can be originated by degradation of organisms (Mckay and Gibson, 1996). In this case, the eventual detection in CRISM data would be related to the time of the single observation with lower chances to find them again in eventual missions. This, for two reasons: nature of PAH’s which origins and eventual relation with the environment could be only studied by in situ chemical facilities, and due to the short time, about 3 days, (Dartnell et al., 2012) of surviving of PAH’s exposed at UV rays on surface.
Moreover, also ethane shows absorptions at 3.3 mm, but the only data are from Krasnopolsky, (2011), with IRTF-CSHELL that placed an upper limit of ethane in Mars atmosphere of 0.3 ppb. It is similar to background values of methane concentration on Mars surface. We did not search, nor expect to detect spectral features in 3.3 mm region at such concentrations.
Finally, also CO2 ice shows a strong absorption at 3.3 mm (Hansen et al., 1997). However, the phase diagram of CO2 for Mars shows that at average temperatures around -50 °C, at average latitudes, and pressure around 6 millibar, CO2 should be present in gas form (Longhi 2006).
Table 1. List of the Mars sites in which methane increases where observed by means of ground telescopes, and spectrometers both orbiting (PFS) and on the Mars surface laboratory (MSL).

Acronyms: Cryogenic Near-IR Facility Spectrograph (CSHELL) - Infrared Telescope Facility (IRTF); NIRSPEC, cross-dispersed echelle spectrograph designed for Keck II; Sample Analysis at Mars- Tunable Laser Spectrometer (SAM-TLS); Trace Gas Orbiter (TGO).
The AIM of this work is to search in hyperspectral data acquired by CRISM over selected areas spectral absorptions that can be linked to the presence of hydrocarbons. To this end, the considered CRISM cubes are processed to obtain the map of 3.3 µm absorption depth, band center, and width. Afterwards, the spectra with potentially true absorptions (absorptions due to surface or atmospheric compounds) are selected, based on the statistics of the depth map at 3.3 µm and excluding those pixels clearly related to artifacts.
Finally, assuming the hypothesis that some of the true absorptions can be related to methane, we did a simulation with Planetary Spectrum Generator (PSG) tool (Villanueva et al., 2018) to obtain a relation that links spectral properties (i.e. absorption depth) to CH4 concentrations.
Areas Selection
To date, there are no data on occurrences of other hydrocarbons than methane on Mars surface. Therefore, the first dataset for searching C-H absorptions were chosen from sites in which methane was detected or in which it theoretically could form. We considered three areas: area of Oxia Planum, in the view of the upcoming Exomars 2022 mission (Vago et al., 2017), to compare the results of this work with data collected on Martian surface by the Rosalind Franklin rover (Voosen, 2017); area of Gale crater in which the increase of methane was proven from orbiter and on ground; area of Nili Fossae which mineralogy is compatible with methane formation (Wray and Elhmann, 2011) and in which the peak value of 40 ppbv of methane was estimated from ground telescopes (Mumma et al., 2009). The three areas chosen for the research are indicated with stars in Fig. 1.
CRISM data processing
CRISM is a hyperspectral imaging spectrometer on the Mars Reconnaissance Orbiter (MRO) that collects images in a spectral range from 0.4 to 4 µm, (Murchie et al., 2007a). It operates in two modes: (1) a 72-channel mapping mode that provide global coverage at 200 m/pixel and (2) a full 544-channel targeted mode that provides a resolution of 15–38 m/pixel. For this study, we considered the version 3 of IR data, 1001–3936 nm, labelled with “L”, as collected by L-detector. We used full resolution targeted observations –FRS and FRT- which have a spatial resolution of about 20 m/pixel; Half-Resolution Long and Short Targeted observations (HRL-HRS) which have a spatial resolution of 36 m/pixel; Along-Track Undersampled (ATU) observations which have a resolution of 18 m/pixel cross-track and 36 m/pixel downtrack. Radiance data were used to verify that eventual absorptions were not introduced by the calibration in reflectance. For each area the CRISM observations considered are listed in table 2. As said, in three years of measurements the SAM-TLS recorded a certain seasonality in the methane abundance (Webster et al., 2015, 2018). Therefore, we investigated on data collected during all the Mars seasons to identify eventual trends.
Table 2. Observation season. List of the investigated CRISM observations (frs, frt, atu, hrs, hrl) and corresponding martian season of the observations.
|
Area |
CRISM-MRO observation |
UTC |
Solar Longitude, Ls, in degree |
|---|---|---|---|
|
Gale Crater |
frs00028346 |
13 Jan 2013 |
243.7 |
|
frt0000a091 |
20 Feb 2008 |
34.5 |
|
|
frt00001968 |
21 Jun 2010 |
107.4 |
|
|
hrs0000336a |
30 Nov 2006 |
143.2 |
|
|
Oxia Planum |
frs0003a896 |
23 Feb 2016 |
112.8 |
|
frs00031523 |
21 Jul 2014 |
165.1 |
|
|
frt00010fe9 |
11 Feb 2009 |
208 |
|
|
atu0004180 |
5 Feb 2017 |
312 |
|
|
hrl0000a3de |
4 Mar 2008 |
40.3 |
|
|
hrs00011725 |
5 Mar 2009 |
221.2 |
|
|
Nili Fossae |
frs00041a28 |
14 Feb 2017 |
317.2 |
|
frs0002a9b2 |
30 Jul 2013 |
359.6 |
|
|
frs0002adc4 |
16 Aug 2013 |
7.7 |
|
|
frs00039936 |
23 Dec 2015 |
85.2 |
Processing of 3.3µm absorption
Then, for what concerns the peak around 3.3 µm, another chain of processing was created. Each whole CRISM I/F cube was processed through a procedure that, as first, removes spectral spikes and results in a hyperspectral cube in which the range of I/F is between 0.0 and 0.3. The spikes occur on single spectral channels and not at the same channel for different locations. We considered as spikes values of IF higher than 1. The values were corrected substituting them with the median value of the neighbor pixels. After this step, a destriping process is applied according to the procedure described in De Angelis et al., (2015). This last processing undergoes another processing that searches the 3.3 µm absorption in the portion of spectrum between 3.2 and 3.4 µm, for each pixel in the scene. Since we are considering a narrow range the continuum was removed by subtracting a linear function passing through the reflectance value of the first and last point of the range.
After continuum removal, a Modified Gaussian Model (Sunshine, 1990) function was fitted to obtain the map of the absorption parameters: band center, depth, width, bias. A specific routine allows to set a threshold for each of the band parameters computed and to print those spectra within such threshold.
Noise estimation and choice of the thresholds
In CRISM data there are different sources of noise. In fact, there is the noise with a Poisson distribution characteristic of the VNIR S-detector and IR L-detector, and thermal noise which characterizes the IR-L detectors (Murchie et al., 2007; Kreisch et al, 2017). In particular, the degradation over time of the cryogenic cooler of L detector generated an increase of the noise in CRISM scenes (Murchie et al., 2007). Moreover, CRISM data can show vertical striping due to misfit in the calibration of detectors. Finally, a stochastic noise can occur as spectral spikes that are related to brusque change in brightness (Leask et al., 2018).
In order to find the detection limit of methane concentration in CRISM data we calculated the statistics of depth values on the absorption map in the range between 3.2 and 3.4 µm. To take into account all the noise sources and the variability of the different CRISM scenes considered for this work, the standard deviation must be calculated for every observation.
Since in the images there are unknown artifacts, for each image, a threshold was set at µ + n*σ, where µ and σ are respectively, the average value and the standard deviation of depth map. From the analyses of data, we found that value of n = 5 for σ is a good compromise for avoiding false positives. This threshold on the 3.3 µm depth set the lower concentration limit for detection of methane through CRISM in real data.
Mars surface modeling
In order to see if the estimated quantities of methane by literature data would be observable by CRISM we used the Planetary Spectrum Simulator (PSG). The PSG for surface modeling using CRISM data combines a realistic Hapke scattering model and the capability to ingest a broad range of optical constants allowing to accurately compute surface reflectances and emissitivities (Villanueva et al., 2018). To simulate spectra of Mars surface for each CRISM observation, the PSG tool requests some parameters: date and season of the observation, the position of target and the geometry of the view, the atmosphere and surface properties, the characteristics of the observing instrument, such as altitude of observation, spectral range and resolution. The noise was not simulated but directly computed on each CRISM observation.
For computing of gas concentrations, PSG refers to several databases. For calculation of methane concentration, the PSG uses the HITRAN 2016 database.
The code that PSG uses for modelling the atmosphere is called PUMAS-Planetary and Universal Model of Atmospheric Scattering. The scattering analysis is based on a Martian scattering model (Smith et al. 2009) (Villanueva et al., 2015; Smith et al., 2009). Through the PSG tool, simulating each CRISM observation, we found the relation between increasing methane concentration and the band depth at 3.3 mm. Then, using CRISM data, we have converted the calculated threshold on depth into lower limits of methane detection, for each observation.
Spectral investigation on CRISM I/F observations
Using the procedure that calculates the Modified Gaussian Model fit (MGM), (Sunshine et al., 1999) on the CRISM I/F observations, the research of band minima in 3.2-3.4 µm range highlighted artifacts that create false absorptions (artefact absorptions from now, on) in some pixels that were distributed along the columns direction. For example, in fig. 2a the observation frs0002a9b2 is considered. The map of the band depth at 3.3 mm of this image shows the spatial distribution of cluster of pixels along columns. The fig. 2c shows the spectrum of one pixel in this cluster.
In all the investigated data the position of artefact absorptions is variable spatially and spectrally between 3.34 and 3.4 µm. To avoid the interpretation of artefact absorptions, we considered only those pixels in clusters that did not show a distribution along the columns of the images. Despite this precaution, there might still be false positives in the selected pixels.
In table 3, for each selected cluster, we listed the x, y coordinate of pixels with highest value of the depth, band center the number of the pixels the average value (µ), and standard deviation (σ) of depth of the cluster.
In figures 3,4,5 there are the results of the band minima in the range of 3.2-3.4 µm for three observations in three investigated areas. In the observation frs0003a896, the depth of the deeper pixel in the cluster (red fig. 3) is -0.0123 with a band center at 3.34 µm.
In the observation frs00028346, the depth of the deepest pixel in the cluster (red fig. 4) is -0.0200 with a band center at 3.35 µm.
In fig. 5 the image frs0002a9b2 is shown. Red pixels indicate the 3.297 µm absorption. The maximum value of absorption depth in the red cluster is 0.045.
In each cluster one/two pixels with increased depth respect to the others that show shallower depths. In the hypothesis that these absorptions are not related to artefacts this kind of distribution could remind diffusion patterns.
Table 3. List of the pixels that show features in the range 3.2-3.4 mm. The pixels belong to clusters, but the x,y coordinates are referred to the pixel with the greater depth. m, s are respectively, the average value and the standard deviation of depth map.
|
Area |
CRISM-MRO observation |
Coordinate of the deepest pixel in the cluster |
Band center |
Depth |
N of pixels in the cluster |
µ, σ of the cluster |
|---|---|---|---|---|---|---|
|
Gale Crater |
frs00028346 |
x355y88 |
3.35 |
-0.022 |
5 |
-0.009, 0.007 |
|
frt0000a091 |
- |
- |
- |
- |
- |
|
|
frt00001968 |
x121y106 |
3.35 |
-0.057 |
5 |
-0.05, 0.007 |
|
|
hrs0000336a |
- |
- |
- |
- |
- |
|
|
Oxia Planum |
frs0003a896 |
x420y133 |
3.29 |
-0.024 |
6 |
-0.002, 0.005 |
|
frs00031523 |
x459y165 |
3.32 |
-0.040 |
7 |
-0.03, 0.013 |
|
|
frt00010fe9 |
x120y139 |
3.31 |
-0.032 |
5 |
-0.03, 0.007 |
|
|
atu0004180 |
x345y172 |
3.28 |
-0.036 |
8 |
-0.03, 0.007 |
|
|
hrl0000a3de |
- |
- |
- |
- |
||
|
hrs00011725 |
x182y8 |
3.29 |
-0.023 |
5 |
-0.17, 0.003 |
|
|
Nili Fossae |
frs00041a28 |
x506y22 |
3.37 |
-0.042 |
6 |
-0.03, 0.007 |
|
frs0002a9b2 |
x47y3 |
3.29 |
-0.045 |
15 |
-0.044, 0.005 |
|
|
frs0002adc4 |
- |
- |
- |
- |
||
|
frs00039936 |
x135y49 |
3.29 |
-0.013 |
4 |
-0.013, 0.0005 |
Next, to establish a threshold for the depth, we computed the average µ and the standard deviation σ of the depth map of absorptions in the 3.3 µm region, for each dataset.
For each image, the average depth value ranged from − 0.01 to -0.003 and the standard deviation of depth maps resulted from 0.002 to 0.004, Table 4.
Therefore, we have considered as threshold only depth values greater than µ + 5σ, for each image. Within the considered dataset, the resulting threshold values range from 0.0136 to 0.0237.
|
Area |
CRISM-MRO observation |
Number of pixels in depth map |
Standard deviation on depth map (σ) |
Average (µ) |
Threshold µ + 5∗σ |
|---|---|---|---|---|---|
|
Gale Crater |
frs00028346 |
84475 |
0.003 |
-0.0055 |
0.0205 |
|
frt0000a091 |
228660 |
0.003 |
-0.005 |
0.02 |
|
|
frt00001968 |
221400 |
0.004 |
-0.007 |
0.027 |
|
|
hrs0000336a |
51940 |
0.002 |
-0.01 |
0.02 |
|
|
Oxia Planum |
frs0003a896 |
83550 |
0.002 |
-0.005 |
0.015 |
|
frs00031523 |
73920 |
0.003 |
-0.004 |
0.019 |
|
|
frt00010fe9 |
228900 |
0.003 |
-0.006 |
0.021 |
|
|
atu0004180 |
91575 |
0.003 |
-0.003 |
0.018 |
|
|
hrl0000a3de |
112518 |
0.004 |
-0.0037 |
0.0237 |
|
|
hrs00011725 |
51900 |
0.002 |
-0.005 |
0.015 |
|
|
Nili Fossae |
frs00041a28 |
82500 |
0.003 |
-0.0036 |
0.0186 |
|
frs0002a9b2 |
90234 |
0.002 |
-0.004 |
0.014 |
|
|
frs0002adc4 |
87920 |
0.002 |
-0.0036 |
0.0136 |
|
|
frs00039936 |
79750 |
0.002 |
-0.004 |
0.014 |
Simulated spectrum of methane gas on Mars surface
The simulation of surface spectra plus increasing content of methane (in ppbv) was computed by the Planetary Spectrum Generator (PSG) tool using different parameters depending on the position respect to the Sun of the investigated CRISM observation site. The use of PSG simulator was intended to estimate the empirical function that link absorption depths, as they would be detected by CRISM, to methane abundances.
As an example, the simulated I/F spectrum, in the 3.2–3.8 µm range of the observation frs0003a896, in Oxia Planum area, shows a weakly visible band absorption at 3.3 µm (Fig. 6) corresponding to the CH4 input value of 100 ppbv. To study how the band can vary in depth according to different concentrations we also simulated: 40, 100, 300, 500 ppbv (Fig. 7) and plot the corresponding depth for each area investigated (Fig. 8, 9, 10). The depth values are calculated as the depth of the minima in the spectrum absorption in the range 3.2–3.4 µm.
As seen, each CRISM observation of this work is collected during a different year, season and time (Table 2, Fig.11). However, the three plots of the increasing simulated CH4 band absorption vs depth in the simulated spectra, show a general agreement among the depths, indipendently from the season and year of observation. Hence, in general, we can say that the depths of the absorption band at 3.3 µm of methane, would correspond to about 0.008 for 100 ppbv for all the sites. Only in the case of the observation frs00041a28, the concentration of 100 ppbv corresponds to a deeper value of absorption (depth=0.012).
|
Area |
CRISM-MRO observation |
Threshold µ + 5∗σ |
Lower limit of concentrations |
|---|---|---|---|
|
Gale Crater |
frs00028346 |
0.0205 |
300 |
|
frt0000a091 |
0.02 |
350 |
|
|
frt00001968 |
0.027 |
600 |
|
|
hrs0000336a |
0.02 |
400 |
|
|
Oxia Planum |
frs0003a896 |
0.015 |
220 |
|
frs00031523 |
0.019 |
350 |
|
|
frt00010fe9 |
0.021 |
300 |
|
|
atu0004180 |
0.018 |
280 |
|
|
hrl0000a3de |
0.0237 |
320 |
|
|
hrs00011725 |
0.015 |
200 |
|
|
Nili Fossae |
frs00041a28 |
0.0186 |
180 |
|
frs0002a9b2 |
0.014 |
210 |
|
|
frs0002adc4 |
0.0136 |
200 |
|
|
frs00039936 |
0.014 |
200 |
In summary, looking at the plot of simulated observations (Fig. 8,9,10), the values of depths correspond to a range of methane concentration between 180 and 600 ppbv, depending on the considered site (Table 5).
The simulations for each site (Fig. 8, 9, 10) show that the depths corresponding to same concentration of methane do not change much from site to site. For example, 100 ppbv corresponds to a range of depths from 0.008 to 0.012.
In these simulations, one exception is the observation frs00041a28 in Nili Fossae area which shows greater depths with respect to the other sites. This could be related to the viewing geometry or season/hour or a combination of these variables, see Fig. 12.
From the investigations on CRISM data resulted that the depths of the deepest pixels in these featured clusters in CRISM observations show different values that goes from − 0.013 to -0.057 (Table 3). To avoid, as more as possible, misinterpretation of false absorptions due to unknown artifacts the threshold for depth to consider was set at µ + 5σ of depth maps. The thresholds range from 0.0136 to 0.0237 (Table 4). It resulted also that the difference in band centers of the absorptions is about 80 nm, for the considered dataset. Therefore, we take into account that some of the absorptions could not be related to methane, which shows a major absorption around 3.31 mm but perhaps to other hydrocarbons.
Furthermore, the statistics of depth map show that the thresholds on absorption depth to consider for calculating the lower limit of methane concentration vary depending on the considered CRISM observation. In general, we could say that, for concentrations lower than 180–600 ppbv, depending on the considered site, would increase the chance to find a false absorption.
Good candidates but artefacts
Despite all the precautions to exclude artifacts from interpretation, the remaining pixels or part of them could still be artifacts. Among the known artifacts of CRISM IR range, there is an optical effect due to out of band leakage in zone 3 of the IR order sorting filter. This leakage peaks appears at 3.4 µm (Murchie et al., 2007). This kind of artifacts generates positive signal peaks. A probable artifact was found in CRISM IR data at 3.18 µm by Viviano-Beck et al., (2014). Leask et al., (2018) found another artifact named “spurious absorptions or absorption-like features”. This last artifact consists of absorptions on over 20 channels, showing gradual shoulders from the continuum value.
To exclude, at least, the artifact was introduced by the I/F pipeline, we analyzed radiance and I/F data. As it can be seen in the example of Fig. 12, the featured pixel of the image frs00029b2 shows the 3.3 mm absorption both in radiance spectrum and in I/F. Therefore, 3.3 µm absorption is not related to the I/F correction.
Good candidates, potential methane spikes?
There is also the possibility, however, that some of the identified locations with absorptions around 3.3 mm could indeed be localized methane sources (Fig. 13).
If some of the clusters were related to methane emissions, their findings would strengthen the hypothesis of localized sources of methane in the subsurface. In fact, data on Martian methane concentrations include background values (Webster et al., 2018), spikes (Mumma et al., 2009), non-detections (Korablev et al., 2019) and seasonality (Moore et al., 2018). The results of this investigation can well fit with sources of methane in form of gas seepages (Etiope and Oheler, 2019). In this work we find that if methane whiffs were present as emissions from gas seepages, in the selected dataset, CRISM could detect the methane spectral features for concentrations > 180–600 ppb, depending on the site.
Unfortunately, it is not possible to calculate the flux of this potential source, because CRISM does not collect data periodically in fixed areas, being conceived for studying the mineralogy of Mars surface. However, the clusters that satisfied the two criteria we set for potential methane detection in CRISM data, consist of few pixels, 4–15. For each cluster, the value of the pixel with a deepest absorption is considered and listed in table 3. In general, the remaining pixels in the cluster show shallower absorptions. Which means that if these absorptions were methane, the clusters could represent diffusion of gas in the atmosphere from a source point, or a diffusion by a more spread source on the surface (Fig. 14a).
The concentrations resulting from PSG simulations are high respect to previous spikes and plumes detections, but remains in the order of hundreds of ppbv, also we do not have precise information regarding the time of methane removal/sinks from the atmosphere. In fact, the oxidation process on Mars destroys methane in about 300 years (Summers et al., 2002; Atreya et al., 2007). This mechanism is too long to explain, for example, the detection of the last spike of 21 ppbv by MSL (AbSciCon 24–28 June 2019) and the non-detection of Mars Express and ExoMars TGO (ESA’s Mars orbiters did not see latest Curiosity methane burst; Korablev et al., 2019), after some hours on the same area.
Several hypotheses were formulated for a shorter lifetime of CH4 that include gas-solids reactions, (Jensen et al., 2014; Holmes et al., 2015) however, the faster mechanism proposed for methane removal is the oxidation CH4 by the action of hydrogen peroxide in the regolith (Lefevre and Forget, 2009). This mechanism could shorten the methane life from 200 days to few hours near the surface.
If in some of the featured pixels observed, the 3.3 µm band was due to increase of methane gas, then it would be one of the few detections of 3.3 µm by an imaging spectrometer. The imaging spectrometer VIMS onboard Cassini mission detected a strong deep band of methane at 3.3 µm on Titan’s upper atmosphere. The estimation of abundance in this case was around 1.4% of the atmosphere (Maltagliati et al., 2014).
On the Earth, in 2010, a field experiment was performed at the former Rocky Mountain Oilfield Testing Center (RMOTC), Wyoming (USA), in which controlled flow rates of methane were released on surface and subsurface to simulate anthropogenic and natural sources. Simultaneously, the spectral imager on the SEBASS platform flew at 462 m and 762 m over these artificial sources of methane. The 3.3 µm band was detected on few pixels on surface and, in one station, also on the subsurface source (Scafutto et al., 2018).
Finally, very recently, the mid-infrared channel (MIR) of Atmospheric Chemistry Suite spectrometer onboard Trace Gas Orbiter (Korablev, et al., 2018) detected new bands in the range of methane absorptions, around 3.3 mm. These new bands were attributed to both ozone (Olsen et al., 2020) and to magnetic dipole and electric quadrupole 01111-00001 (ν2 + ν3) absorption bands of the main CO2 isotopologue (Trokhimovskiy et al., 2020).
The spectral features we observed at 3.3 mm in CRISM data could be also assigned to magnetic dipole CO2 absorption bands. Nevertheless, some of the differences between our investigation on CRISM data and ACS results stand in the geometry of the scene and location of investigations. The variation of latitude and geometry of the scene correspond also to variation in temperatures and pressures. In this work, we analyzed CRISM data acquired at Nadir whereas data from ACS were collected at solar occultation conditions. Moreover, we focused the investigation on CRISM data at mid latitudes; the ACS spectrometer focused to northern latitudes (> 65°N). However, currently, the new bands of ozone and CO2 magnetic dipole are not integrated in the HITRAN database. Consequently, it is not possible to model the absorption of CO2 and O3 at 3.3 mm with the PSG tool.
Organic matter and PAH’s
Some clusters that show absorptions at longer wavelengths, could be related to aliphatic hydrocarbons such as methane, as well as other aliphatic compounds that show absorptions at about 3.3–3.6 µm.
For example, aliphatic compounds were individuated in the spectral features of the comet 67P/Churyumov-Gerasimenko nucleus by VIRTIS spectrometer during the Rosetta mission (Raponi et al., 2020; Capaccioni et al., 2015).
Aliphatic features similar to kerite and asphaltite at 3.38 to 3.50 µm were found in the spectra of the crater Ernutet on Ceres asteroid by VIR spectrometer onboard Dawn mission.
Beside aliphatic compounds, the absorptions found in some cluster with bands around 3.28–3.3 mm (Fig. 15) could be also assigned to some aromatic hydrocarbons like Polycyclic Aromatic Hydrocarbons (PAHs), for example: naphthalene, anthracene, phenanthrene. Polycyclic Aromatic Hydrocarbons have been found in different planetary environments and materials. In particular, polycyclic aromatic hydrocarbons (PAHs) have been found in the organic fraction in carbonaceous chondrites (CCs) (Sephton et al. 1998; Botta and Bada 2002; Sephton 2002). Moreover, PAHs include up to 20% of the carbon material in the interstellar medium (ISM) (Allamandola et al. 1985). Signatures of PAHs have recently been identified in the atmosphere of Titan (López-Puertas et al., 2013).
Campbell et al., 2018 investigated on hydrocarbons detection on Mars South Polar Cap although the feature at 3.3 µm was difficult to interpret due to the strong absorption by the CO2 ice, Oancea et al., 2012.
Even if studies (Dartnell et al., 2012; Pavlov et al., 2012) on Mars surface revealed a short lifetime and rapid degradation for PAH’s in the shallow surface due to UV and ionizing radiations the eventual occasional occurrence of PAH’s on surface images and the related 3.3 µm band absorption in CRISM data can be linked to PAH’s bearing impacting bodies on Mars surface or in correspondence of fresh crater outcrops (Blanco et al., 2018).
Implications for ExoMars2022 and other rover missions
In 2022 the Exomars mission (Vago et al., 2017) will deliver the Kazachock surface platform and the Rosalind Franklin rover on Mars surface that will host several instruments onboard.
On the rover, almost all these instruments will provide data on eventual C-H compounds and organic molecules. Therefore, for what concerns Oxia Planum the results of this investigation would potentially be compared.
Once landed the rover, the Infrared Spectrometer for ExoMars (ISEM) will work coupled with the PanCam camera to select interesting sites for biosignatures. It has a spectral range of 1.15 to 3.3 µm with a spectral resolution 3.3 nm at 1.15 µm and 28 nm at 3.30 µm. As already seen, the range just end at the value of C-H absorption at 3.3 µm, therefore a potential comparison could be done with CRISM spectra, also checking for absorptions in the 2.2–2.4 µm range of C-H compounds in ISEM spectra. At micrometric scale, MicrOmega (Micro observatoire pour la mineralogie, l'eau, les glaces et l'activité) -IR will analyse in situ the powder material derived from crushed samples collected by the rover's core drill MaMISS. MicrOmega-IR has an IR range from 0.95 to 3.65 µm in 320 channels of about 8 nm of spectral resolution. Therefore, also the data from MicrOmega in the range around 3.3 mm could be compared with the CRISM data.
The analyses of samples collected in a depth up to 2 m by MaMISS will be very useful. In fact, either sample extracted will be not so much irradiated and damaged as the surface materials, and this increases the probability to find organic compounds. Moreover, in case of methane, this will be rapidly detected in the original abundance with respect to methane detected on the surface, which is mixed and/or removed from the Mars near surface atmosphere. This would be potentially possible, searching for other C-H absorptions at also in the region from 2.2 to 2.6 um, range that is characterized by combination and overtone bands (Cloutis, 1989). Eventual absorptions in this range 2.2–2.6 mm could be compared with the CRISM data in the range around 3.3 mm in the same area.
In this work, we aimed to search eventual hydrocarbon compounds on Mars surface, using CRISM data in the range 3.2–3.4 mm. To date, the only hydrocarbon detected and localized on Mars surface, by the SAM-TLS, onboard Curiosity rover, is methane. Therefore, we begun the research of hydrocarbons features, around 3.3 mm, in CRISM data, starting the investigation from that sites where a hydrocarbon (methane) was effectively detected, or it could be formed on the basis of mineralogy.
We found clusters of pixels in which the band center of absorptions ranged from 3.28 to 3.37 mm. These band centers are typical of different kind of hydrocarbon compounds, from PAH to aliphatic ones.
We adopted some criteria to exclude as more as possible from the interpretation clear artifacts. Nevertheless, we cannot exclude that artifacts could simulate or mask absorptions.
Hypothesizing that some of these absorptions, could have been related to methane, we used an online simulator, the PSG tool, to convert different methane concentrations in band depths.
Then the statistics of depth map was calculated for each image, in order to set a conservative threshold on depth, for excluding the more as possible artifacts and noise from the interpretation.
As a consequence, hypothesizing that some of absorptions were related to methane, the thresholds place the theoretical lower limit of methane detection in each CRISM observation.
Among the interesting clusters we found interesting spectra in some observations of Oxia Planum. We will use these results to be compared with the data that will be collected on the surface of Oxia Planum site during the Exomars 2022 mission.
Since CRISM is devoted to discovering the mineralogy of Mars surface and not for hydrocarbons detection, it does not collect data time to time, to monitor spectral changes in the same zone periodically.
Furthermore, the comparison with other instruments conceived to detect gas in atmosphere is difficult for different reasons: time of persistence of methane in Mars atmosphere (hours, months, years?), different spatial and spectral resolution, different viewing geometry, and/or the non-correspondence of time of observations.
Due to artifacts and noise, in this work we cannot confirm the presence of methane or other hydrocarbons in the analyzed datasets. But neither we exclude that absorptions in some pixels can effectively be related to C-H compounds. Overall, we wanted to show a method to exploit CRISM data to search for C-H signatures in areas of Mars surface. The method illustrated in this work could be applied to hundreds of images to explore the chance to find potential methane macro-seepages or other hydrocarbon signatures on Mars surface.
List of abbreviations: Not applicable
Availability of data and materials: The dataset analyzed in this work can be downloaded from https://ode.rsl.wustl.edu/mars/, the planetary simulator tool is available at this address https://psg.gsfc.nasa.gov/.
Competing interests: The authors declare that they have no conflict of interest.
Funding: This work was supported by Italian Space Agency, Rome, Italy
Authors' contributions: Paola Manzari: Conceptualization, Investigation, Elaboration of the code tool for hyperspectral data, Writing - review & editing.
Cosimo Marzo: Elaboration of the code tool for hyperspectral data, Conceptualization.
Eleonora Ammannito: Writing, Review, Editing.
All authors discussed the results and implications and commented on the manuscript at all stages.
Acknowledgements: Not applicable
- Atreya, S. K., Mahaffy, P. R., & Wong, A.‐S. (2007). Methane and related species on Mars: Origin, loss, implications for life and habitability. Planetary Space Science, 55(3), 358–369.
- Blanco Y, de Diego-Castilla G, Viúdez-Moreiras D, Cavalcante-Silva E, Rodríguez-Manfredi JA, Davila AF, McKay CP, Parro V. Effects of Gamma and Electron Radiations on the Structural Integrity of Organic Molecules and Macromolecular Biomarkers Measured by Microarray Immunoassays and Their Astrobiological Implications. Astrobiology. 2018 Aug 2;18(12):1497–1516. doi: 10.1089/ast.2016.1645. [Epub ahead of print]. PMID: 30070898; PMCID: PMC6276817.
- Campbell J.D., Sidiropoulos P., Muller J-P., A search for polycyclic aromatic hydrocarbons over the Martian South Polar Residual Cap, Icarus, Volume 308, 2018, Pages 61-70, ISSN 0019-1035, https://doi.org/10.1016/j.icarus.2018.03.008.
- Chassefière E., 2009, Metastable methane clathrate particles as a source of methane to the Martian atmosphere, Icarus 204, 137-144.
- Clark R.N., Curchin J.M., Hoefen T., Swayze G. (2009). Reflectance spectroscopy of organic compounds: 1. Alkanes. Journal of Geophysical Research,114, 1-19, 10.1029/2008JE003150.
- Clancy, R.T., Sandor, B.J., Wolff, M.J., Christensen, P.R., Smith, M.D., Pearl, J.C., Conrath, B.J., and Wilson, R.J.: Journal of Geophys. Res 105, p 9553, 2000.
- Cloutis E., Spectral Reflectance Properties of Hydrocarbons: Remote-Sensing Implications, 1989, Science, 165-168.
- Dartnell L.R., Page K., Jorge-Villar S.E., Wright G., Munshi T., Scowen I.J., Ward J.M., and Edwards H.G.M. (2012) Destruction of Raman biosignatures by ionising radiation and the implications for life detection on Mars. Anal Bioanal Chem 403:131–144.
- De Angelis S, Ammannito E, Di Iorio T, De Sanctis MC, Manzari PO, Liberati F, Tarchi F, Dami M, Olivieri M, Pompei C, Mugnuolo R. The spectral imaging facility: Setup characterization. Rev Sci Instrum. 2015 Sep;86(9):093101. doi: 10.1063/1.4929433. PMID: 26429423.
- De Sanctis, M. C., Ammannito, E., McSween, H. Y., Raponi, A., Marchi, S., Capaccioni, F., et al. (2017). Localized aliphatic organic material on the surface of Ceres. Science, 355(6326), 719–722. https://doi.org/10.1126/science.aaj2305
- Dohm, J.M., Anderson, R.C., Barlow, N.G., Miyamoto, H., Davies, A.G., Jeffrey Taylor, G., Baker, V.R., Boynton, W.V., Keller, J., Kerry, K., Janes, D., Fairen, A.G., Schulze-Makuch, D., Glamoclija, M., Marinangeli, L., Ori, G.G., Strom, R.G., Williams, J.-P., Ferris, J.C., Rodriguez, J.A.P., de Pablo, M.A., and Karunatillake, S. (2008) Recent geological and hydrological activity on Mars: the Tharsis/Elysium corridor. Planet Space Sci, 56:985–1013.
- Etiope, G., & Oehler, D. Z. (2019). Methane spikes, background seasonality and non‐detections on Mars: A geological perspective. Planetary and Space Science, 168, 52–61.
- Etiope G. (2015) Natural Gas Seepage. The Earth's Hydrocarbon Degassing, Springer, Cham, Switzerland. Google Scholar
- Etiope G. and Sherwood Lollar B., Abiotic Methane on Earth, Rev Geophys, 51 (2013), pp. 276-299.
- Etiope G., Oehler D. Z., Allen C. C. (2011). Methane emissions from Earth's degassing: Implications for Mars. Planetary and Space Science 59, 182-195.
- Alberto G. Fairén, James M. Dohm, Esther R. Uceda, Alexis P. Rodríguez, Victor R. Baker, David Fernández-Remolar, Dirk Schulze-Makuch, Ricardo Amils, Prime candidate sites for astrobiological exploration through the hydrogeological history of Mars, Planetary and Space Science, Volume 53, Issue 13, 2005, Pages 1355-1375, ISSN 0032-0633, https://doi.org/10.1016/j.pss.2005.06.007.
- Formisano, V., Atreya S., Encrenaz T., Ignatiev N., and Giuranna, M. (2004). Detection of Methane in the Atmosphere of Mars. Science (New York, N.Y.). 306. 1758-61. 10.1126/science.1101732.
- Goetz et al., The Challenge To Search For Organics And Biosignatures On Mars By The Exomars-2020 Rover. 2018, 49th Lunar and Planetary Science Conference 2018 (LPI Contrib. No. 2083), abs#2615.
- Giuranna M., Viscardy S., Daerden F., Neary, L., Etiope G., Oehler D.Z., Formisano V., Aronica A., Wolkenberg P., Aoki S., Cardesín-Moinelo A., Parra J.M., Merritt D.R., Amoroso M. (2019). Independent confirmation of a methane spike on Mars and a source region east of Gale Crater. Nature Geoscience, 12, 326-332.
- Gough R. V., Tolbert M. A., McKay C. P., Toon O. B., Methane adsorption on a martian soil analog: An abiogenic explanation for methane variability in the martian atmosphere, Icarus 207, 165–174 (2010).
- Guzewich, S. D., Newman, C. E., Smith, M. D., Moores, J. E., Smith, C. L., Moore, C., … Battalio, M. (2017). The vertical dust profile over Gale Crater, Mars. Journal of Geophysical Research: Planets, 122, 2779– 2792. https://doi.org/10.1002/2017JE005420
- Hansen G.B., The infrared absorption spectrum of carbon dioxide ice from 1.8 to 333 mm - Journal Of Geophysical Research, Vol. 102, No. E9, Pages 21,569-21,587, September 25, 1997.
- Holm N.G., Oze C., Mousis O., Waite J.H., and Guilbert-Lepoutre A. (2015) Serpentinization and the formation of H2 and CH4 on celestial bodies (planets, moons, comets). Astrobiology 15:587–600.
- Jensen S.J.K., Skibsted J., Jakobsen H.J., Kate I.L.T., Gunnlaugsson H.P., Merrison J.P., Finster K., Bak E., Iversen J.J., Kondrup J.C., and Nørnberg P. (2014) A sink for methane on Mars? The answer is blowing in the wind. Icarus 236:24–27.
- C.D. Kreisch, J.A. O'Sullivan, R.E. Arvidson, D.V. Politte, L. He, N.T. Stein, J. Finkel, E.A. Guinness, M.J. Wolff, M.G.A. Lapôtre, Regularization of Mars Reconnaissance Orbiter CRISM along‐track oversampled hyperspectral imaging observations of Mars,
- Icarus, Volume 282, 2017, Pages 136-151, ISSN 0019-1035, https://doi.org/10.1016/j.icarus.2016.09.033.
- Kaplan H.H., Milliken R. E.; Reflectance Spectroscopy of Organic Matter In Sedimentary Rocks At Mid-Infrared Wavelengths. Clays and Clay Minerals, 66 (2): 173–189, 2018, doi: https://doi.org/10.1346/CCMN.2018.064092
- Krasnopolsky A., Search for methane and upper limits to ethane and SO2 on Mars, Icarus, 217, 1, 2012, 144-152, ISSN 0019-1035, https://doi.org/10.1016/j.icarus.2011.10.019.
- Krasnopolsky A., J.P. Maillard, T.C. Owen, Detection of methane in the Martian atmosphere: evidence for life? Icarus, 172 (2004), pp. 537-547.
- Korablev O., Vandaele A.C., Montmessin F., and the ACS and NOMAD Science Teams (2019). No detection of methane on mars from early Exomars Trace Gas Orbiter observations, Nature, 568 (2019), p. 517, https://doi.org/10.1038/s41586-019-1096-4.
- Korablev, O., Montmessin, F., Trokhimovskiy, A. et al. The Atmospheric Chemistry Suite (ACS) of Three Spectrometers for the ExoMars 2016 Trace Gas Orbiter. Space Sci Rev 214, 7 (2018). https://doi.org/10.1007/s11214-017-0437-6 Leask, E. K., Ehlmann, B. L., Dundar, M. M., Murchie, S. L., & Seelos, F. P. (2018). Challenges in the search for perchlorate and other hydrated minerals with 2.1-μ m absorptions on Mars. Geophysical Research Letters, 45, 12,180–12,189. https://doi.org/10.1029/2018GL080077
- Lefèvre F. and Forget F. (2009) Observed variations of methane on Mars unexplained by known atmospheric chemistry and physics. Nature 460:720–723.
- Longhi, J. Phase equilibrium in the system CO2-H2O: Application to Mars, Journal Of Geophysical Research, Vol. 111, E06011, Doi:10.1029/2005je002552, 2006.
- McKay, D., Gibson, E., 1996. Search for past life on Mars; possible relic biogenic activity in Martian meteorite ALH84001. Science 273, 924–930.
- Maltagliati, Luca, Bruno Bézard, Sandrine Vinatier, Matthew M. Hedman, Emmanuel Lellouch, Philip D. Nicholson, Christophe Sotin, Remco J. de Kok, and Bruno Sicardy. "Titan’s atmosphere as observed by VIMS/Cassini solar occultations: CH4, CO and evidence for C2H6 absorption." arXiv preprint arXiv:1405.6324 (2014).
- Meslin P.-Y., Gough R., Lefevre L., Forget F., Planet. Space Sci., 59, 247–258 (2010).
- Moores J. E., King P. L., Smith C. L., Martinez G. M., Newman C. E., Guzewich S. D., et al. (2019). The methane diurnal variation and microseepage flux at Gale crater, Mars as constrained by the ExoMars Trace Gas Orbiter and Curiosity observations, Geophysical Research Letters, 46.
- Mumma, M.J., Novak, R.E., DiSanti, M.A., Bonev, B.P., Dello Russo, N., (2004). Detection and mapping of methane and water on Mars. American Astronomical Society, DPS meeting 36, 26.02.
- Mumma M. J.; Villanueva G. L.; Novak R. E.; Hewagama T.; Bonev B. P.; DiSanti M. A.; Mandell A. M.; Smith M. D. (2009), "Strong Release of Methane on Mars in Northern Summer 2003", Science, 323 (5917): 1041–1045.
- Murchie, S. L., et al. (2009), Compact Reconnaissance Imaging Spectrometer for Mars investigation and data set from the Mars Reconnaissance Orbiter's primary science phase, J. Geophys. Res., 114, E00D07, doi:10.1029/2009JE003344.
- Murchie S., Arvidson R., Bedini P., Beisser K., Bibring J.-P., Bishop J., Boldt J., Cavender P., Choo T., Clancy R.T., Darlington E.H., Des Marais D., Espiritu R., Fort D., Green R., Guinness E., Hayes J., Hash C., Heffernan K., Hemmler J., Heyler G., Humm D., Hutcheson J., Izenberg N., Lee R., Lees J., Lohr D., Malaret E., T., M., McGovern J.A., McGuire P., Morris R., Mustard J., Pelkey S., Rhodes E., Robinson M., Roush T., Schaefer E., Seagrave G., Seelos F., Silverglate P., Slavney S., Smith M., Shyong W.-J., Strohbehn K., Taylor H., Thompson P., Tossman B., Wirzburger M., Wolff M., 2007, Compact Reconnaissance Imaging Spectrometer for Mars (CRISM) on Mars Reconnaissance Orbiter (MRO), J. Geophys. Res. 112, E05S03, doi:10.1029/2006JE002682.
- Mustard, J. F., F. Poulet, A. Gendrin, N. Mangold, J.-P. Bibring, Y. Langevin, B. Gondet, G. Bellucci, F. Altieri, and the OMEGA Science Team (2005), Olivine and pyroxene diversity in the crust of Mars, Science, 307, 1594–1597, doi:10.1126/science.1109098.
- Nielsen, A.H.; Nielsen, H.H. The infrared absorption bands of methane. Phys. Rev. 1935, 48, 864.
- Oancea A., Grasset O., Le Menn E., Bollengier O., Bezacier L., Le Mouélic S., Tobie G., Laboratory infrared reflection spectrum of carbon dioxide clathrate hydrates for astrophysical remote sensing applications, Icarus, Volume 221, Issue 2, 2012, Pages 900-910.
- Oehler D. Z. and Etiope G., Methane Seepage on Mars: Where to Look and Why, Astrobiology, Vol.17, N. 12, 2017.
- K. S. Olsen, F. Lefèvre, F. Montmessin, A. Trokhimovskiy, L. Baggio, A. Fedorova, J. Alday, A. Lomakin, D. A. Belyaev, A. Patrakeev, A. Shakun and O. Korablev, First detection of ozone in the mid-infrared at Mars: implications for methane detection, A&A, 639 (2020) A141, DOI: https://doi.org/10.1051/0004-6361/202038125.
- Oze C., and Sharma M. (2005), Have olivine, will gas: Serpentinization and the abiogenic production of methane on Mars, Geophys. Res. Lett., 32, L10203, doi:10.1029/2005GL022691.
- Pavlov A.A., Hurtgen M.T, Kasting J.F., Arthur M.A., 2003, Methane-rich Proterozoic atmosphere, Geology 31, 87–90.
- Pavlov, A. A., Vasilyev, G., Ostryakov, V. M., Pavlov, A. K., and Mahaffy, P. (2012), Degradation of the organic molecules in the shallow subsurface of Mars due to irradiation by cosmic rays, Geophys. Res. Lett., 39, L13202, doi:10.1029/2012GL052166.
- Fernando Rull, Sylvestre Maurice, Ian Hutchinson, Andoni Moral, Carlos Perez, Carlos Diaz, Maria Colombo, Tomas Belenguer, Guillermo Lopez-Reyes, Antonio Sansano, Olivier Forni, Yann Parot, Nicolas Striebig, Simon Woodward, Chris Howe, Nicolau Tarcea, Pablo Rodriguez, Laura Seoane, Amaia Santiago, Jose A. Rodriguez-Prieto, Jesús Medina, Paloma Gallego, Rosario Canchal, Pilar Santamaría, Gonzalo Ramos, Jorge L. Vago, and on behalf of the RLS Team. Astrobiology. http://doi.org/10.1089/ast.2016.1567 Published in Volume: 17 Issue 6-7: July 1, 2017.
- Sadjadi, S.A., Zhang Y. and Kwok S. (2017). On the Origin of the 3.3 mm Unidentified Infrared Emission Feature. The Astrophysical Journal, 845, 10.3847/1538-4357/aa8141.
- Scafutto, R.D.P.M.; De Souza Filho, C.R. Detection of Methane Plumes Using Airborne Midwave Infrared (3–5 µm) Hyperspectral Data. Remote Sens. 2018, 10, 1237.
- Smith, M. D., Wolff, M. J., Clancy, R. T., and Murchie, S. L. (2009), Compact Reconnaissance Imaging Spectrometer observations of water vapor and carbon monoxide, J. Geophys. Res., 114, E00D03, doi:10.1029/2008JE003288.\
- Summers, M. E., B. J. Lieb, E. Chapman, and Y. L. Yung (2002), Atmospheric biomarkers of subsurface life on Mars, Geophys. Res. Lett., 29 (24), 2171, doi:10.1029/2002GL015377.
- Sunshine, J. M., Pieters, C. M., Pratt, S. F., McNaron-Brown, K. S., Lunar and Planetary Science Conference, 1999, https://ui.adsabs.harvard.edu/abs/1999LPI....30.1306S, Absorption Band Modeling in Reflectance Spectra: Availability of the Modified Gaussian Model, (www.planetary.brown.edu).
- Tokunga A.T., Sellgren K., Nagata T. Smith., Sakata A. and Nakada Y.- High-resolution spectra of the 3.29 micron interstellar emission feature: a summary. Astrophys. J., 380 (1991), pp. 452-460.
- A. Trokhimovskiy, V. Perevalov, O. Korablev, A. F. Fedorova, K. S. Olsen, J.-L. Bertaux, A. Patrakeev, A. Shakun, F. Montmessin, F. Lefèvre and A. Lukashevskaya, First observation of the magnetic dipole CO2 absorption band at 3.3 μm in the atmosphere of Mars by the ExoMars Trace Gas Orbiter ACS instrument, A&A, 639 (2020) A142 DOI: https://doi.org/10.1051/0004-6361/202038134.
- Jorge L. Vago, Frances Westall, Pasteur Instrument Teams, Landing Site Selection Working Group, and Other Contributors, Andrew J. Coates, Ralf Jaumann, Oleg Korablev, Valérie Ciarletti, Igor Mitrofanov, Jean-Luc Josset, Maria Cristina De Sanctis, Jean-Pierre Bibring, Fernando Rull, Fred Goesmann, Harald Steininger, Walter Goetz, William Brinckerhoff, Cyril Szopa, François Raulin, Frances Westall, Howell G. M. Edwards, Lyle G. Whyte, Alberto G. Fairén, Jean-Pierre Bibring, John Bridges, Ernst Hauber, Gian Gabriele Ori, Stephanie Werner, Damien Loizeau, Ruslan O. Kuzmin, Rebecca M. E. Williams, Jessica Flahaut, François Forget, Jorge L. Vago, Daniel Rodionov, Oleg Korablev, Håkan Svedhem, Elliot Sefton-Nash, Gerhard Kminek, Leila Lorenzoni, Luc Joudrier, Viktor Mikhailov, Alexander Zashchirinskiy, Sergei Alexashkin, Fabio Calantropio, Andrea Merlo, Pantelis Poulakis, Olivier Witasse, Olivier Bayle, Silvia Bayón, Uwe Meierhenrich, John Carter, Juan Manuel García-Ruiz, Pietro Baglioni, Albert Haldemann, Andrew J. Ball, André Debus, Robert Lindner, Frédéric Haessig, David Monteiro, Roland Trautner, Christoph Voland, Pierre Rebeyre, Duncan Goulty, Frédéric Didot, Stephen Durrant, Eric Zekri, Detlef Koschny, Andrea Toni, Gianfranco Visentin, Martin Zwick, Michel van Winnendael, Martín Azkarate, Christophe Carreau, and the ExoMars Project Team. Habitability on Early Mars and the Search for Biosignatures with the ExoMars Rover, Astrobiology. Jul 2017.471-510.http://doi.org/10.1089/ast.2016.1533
- Villanueva, G. L., Smith, M. D., Protopapa, S., Faggi, S., Mandell, A. M., Planetary Spectrum Generator: An accurate online radiative transfer suite for atmospheres, comets, small bodies and exoplanets. Journal of Quantitative Spectroscopy and Radiative Transfer, Volume 217, p. 86-104., DOI:10.1016/j.jqsrt.2018.05.023 (2018).
- Villanueva, G. L. M. J. Mumma, R. E. Novak, H. U. Käufl, P. Hartogh, T. Encrenaz, A. Tokunaga, A. Khayat, M. D. Smith, Strong water isotopic anomalies in the martian atmosphere: Probing current and ancient reservoirs. Science, 2015, Vol. 348, Issue 6231, pp. 218-221, DOI: 10.1126/science.aaa3630.
- Villanueva G. L., Mumma M. J., Novak R. E., Hewagama T., Identification of a new band system of isotopic CO2 near 3.3 μm: Implications for remote sensing of biomarker gases on Mars, Icarus, Volume 195, Issue 1, 2008, Pages 34-44, ISSN 0019-1035, https://doi.org/10.1016/j.icarus.2007.11.014.
- Viviano-Beck C.E., Seelos F.P., Murchie S.L., Kahn E.G., Seelos K.D., Taylor H.W., Taylor K.F., Ehlmann B.L., Wiseman S.M., Mustard, J.F., Morgan, M. (2014). Revised CRISM spectral parameters and summary products based on the currently detected mineral diversity on Mars, J. Geophys. Res. Planets, 119, 1403– 1431, doi:10.1002/2014JE004627.
- Voosen P., Mars rover steps up hunt for molecular signs of life, 2017, Science, Vol. 355, Issue 6324, pp. 444-445, DOI: 10.1126/science.355.6324.444
- Webster, C. R., Mahaffy, P. R., Atreya, S. K., Flesch, G. J., Mischna, M. A., Meslin, P. Y., et al., & the MSL Science Team (2015). Mars methane detection and variability at Gale crater. Science, 347(6220), 415–417. https://doi.org/10.1126/science.1261713
- Webster, C. R., Mahaffy, P. R., Atreya, S. K., Moores, J. E., Flesch, G. J., Malespin, C., et al. (2018). Background levels of methane in Mars' atmosphere show strong seasonal variations. Science, 360(6393), 1093–1096.
- Wray J. J., Ehlmann B. L., Geology of possible Martian methane source regions, Planetary and Space Science, Volume 59, Issues 2–3, 2011, Pages 196-202.
- Yung Y.L., Chen P., Nealson K., Atreya S., Beckett P., Blank J.G., Ehlmann B., Eiler J., Etiope G., Ferry J.G., Forget F., Gao P., Hu R., Kleinböhl A., Klusman R., Lefèvre F., Miller C., Mischna M., Mumma M., Newman S., Oehler D., Okumura M., Oremland R., Orphan V., Popa R., Russell M., Shen L., Sherwood Lollar B., Staehle R., Stamenković V., Stolper D., Templeton A., Vandaele A.C., Viscardy S., Webster C.R., Wennberg P.O., Wong M.L., Worden J., Methane on Mars and Habitability: Challenges and Responses. Astrobiology. 2018 Oct;18(10):1221-1242. doi: 10.1089/ast.2018.1917.