3.1. Magnitude of the color inconstancy of samples with changes in illumination
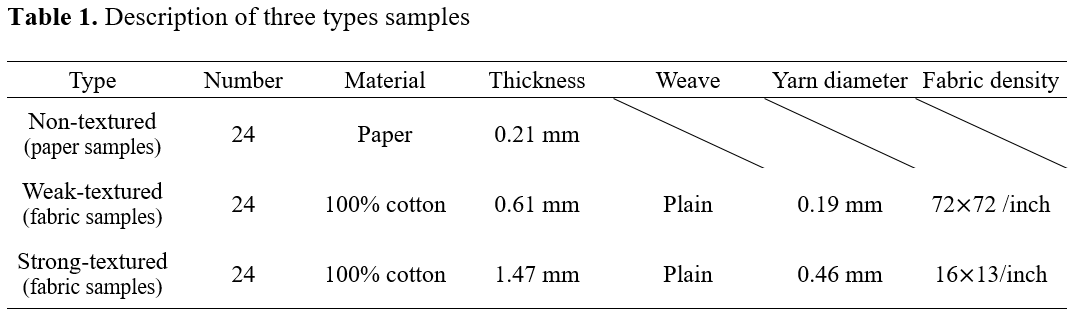
The color inconstancy of samples having different surface texture strengths was numerically analyzed by calculating the ranges of the varying lightness, chroma, and hue of the samples under four different CIE standard illuminants, that is, A, F11, F2, and D65. The color attributes that vary with the illuminant are different from physical color attributes, which are regarded as true colors, and embody perceptual color appearance attributes. To distinguish between these two concepts of constant physical color and inconstant color appearance attributes, the latter will henceforward be denoted by L*A, a*A, b*A, C*A, and hA. Meanwhile, the ranges of the varying L*A, C*A, and hA of samples were calculated by subtracting the minimum value from the maximum value of each sample in the respective color appearance attributes. Figure 5 demonstrates the inconstant lightness, chroma, and hue induced by illuminants, in which L*A, C*A, and hA changes ranged up to 4.86 (weak-textured fabric sample), 10.23 (weak-textured fabric sample), and 197.69 (strong-textured fabric sample), respectively.
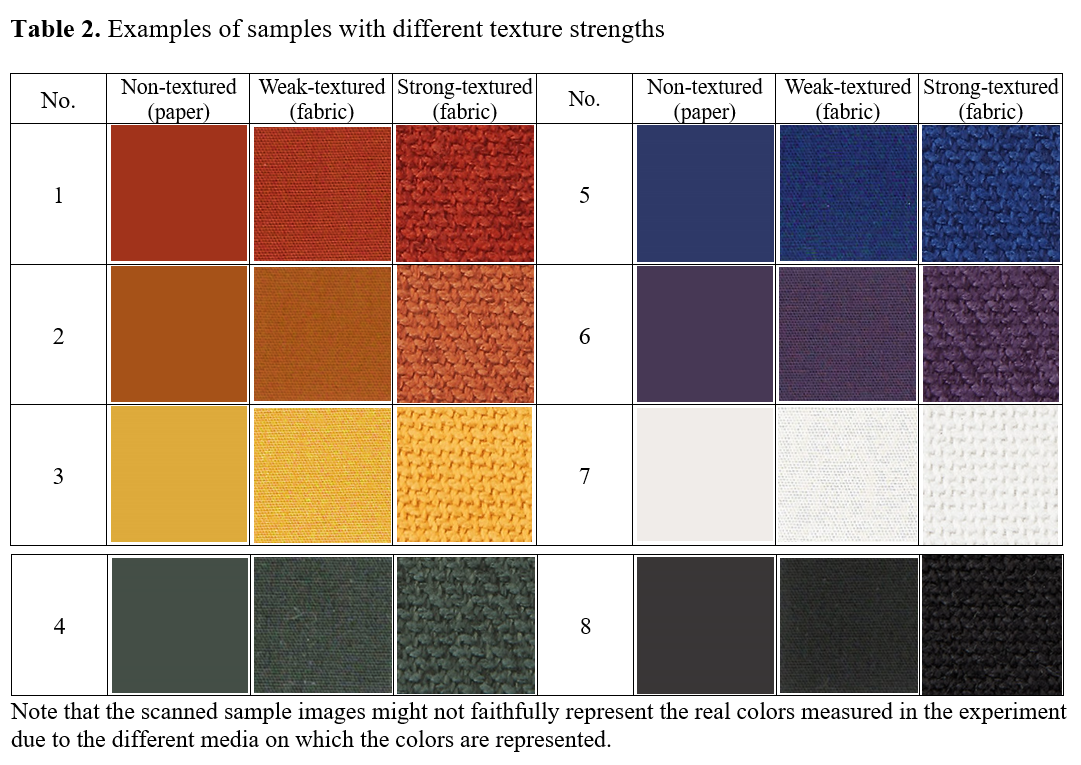
As can be seen in Figure 5, each sample with different texture strengths and physical color attributes (see Figure 2) had different L*A, C*A, and hA ranges. The L*A ranges of non-textured paper samples ranged from 0.09 to 4.39 (average: 1.00; S.D.: 1.12; see Figure 5(a)), their C*A ranges ranged from 0.15 to 9.81 (average: 2.16; S.D.: 2.01; see Figure 5(d)), and their hA ranges ranged from 7.75 to 58.04 (average: 15.81; S.D.: 11.98; see Figure 5(g)). In the case of weak-textured fabric samples, the L*A ranges ranged from 0.27 to 4.86 (average: 1.27; S.D.: 1.20; see Figure 5(b)), the C*A ranges ranged from 0.15 to 10.23 (average: 2.79; S.D.: 2.24; see Figure 5(e)), and the hA ranges ranged from 6.86 to 70.82 (average: 23.75; S.D.: 18.31; see Figure 5(h)). Lastly, the L*A, C*A, and hA ranges of strong-textured fabric samples were 0.25 to 4.53 (average: 1.24; S.D.: 1.17; see Figure 5(c)), 0.31 to 9.91 (average: 2.82; S.D.: 2.34; see Figure 5(f)), and 7.53 to 197.69 (average: 33.89; S.D.: 42.16; see Figure 5(i)), respectively. Regardless of the texture strength of samples, when considering their maximum color appearance ranges, illuminants had huge effects on the color appearance changes of the samples. In particular, the maximum and even average ranges of chroma and hue appearances were far higher than the color discrimination thresholds of the human eye reported previously. According to the experimental results of Melgosa et al. [13], chroma difference-thresholds ranged from approximately 0.7 to 1.2 ΔC*ab,10 depending on the hue, and smaller chroma differences were not perceived. Also, the hue difference-thresholds found by Montag and Berns [14] and Qiao et al. [15] ranged from approximately 1 to 3 Δhab,10. Thus, it can be assumed that people can easily detect the color appearance changes under different standard illuminants observed in this study.
Meanwhile, the 19th color center in all non-textured, weak-textured, and strong-textured sample sets, that is orange color (of which physical hab,10 is close to 45; see Figure 5(g), (h), and (i)), had the maximum ranges of L*A and C*A, indicating that the lightness and chroma appearances of the color varied most considerably depending on the illuminant. On the other hand, as for the hue appearance of samples, the color center with the largest hue appearance range depended on the texture strength of the sample– that is, the 13th, 12th, and 15th color centers for non-textured, weak-textured, and strong-textured sample sets, respectively. However, in the case of textured fabric samples, the color centers which had the largest hue appearance ranges, that is, the 12th and 15th color centers (of which physical hab,10 were 89.99 and 64.41, respectively), were both close to yellow.
All these results indicate that the magnitude of the illumination effect on the color appearance changes of samples varied depending not only on the texture strength of the samples, but also on their physical color attributes. It can also be seen in Figure 5 that different samples with different texture strengths in different color centers had the different directions as well as the different magnitudes of color appearance changes from their true physical colors (indicated by circles). In other words, in each color appearance attribute, some samples had the single direction of color appearance changes, either positive or negative, while others had the both directions.
3.3. Illumination and sample factors affecting the color appearance changes of samples
To determine the statistically significant illumination and sample factors affecting the color appearance changes of the samples, a Pearson’s correlation analysis was performed. For independent variables, the correlated color temperature (CCT) of four CIE standard illuminants was considered as an illumination factor, and the texture strength (i.e., measured surface roughness) and the overall physical lightness L*10, chroma C*ab,10, and hue hab,10 values of paper and fabric samples were considered as sample factors. For dependent variables, the lightness, chroma, hue, and overall color appearance changes of samples from their true physical colors induced by illuminants were used. Among the dependent variables, for lightness, chroma, and hue appearance changes, the absolute values, that is, \(\left|{{{\Delta }L}^{*}}_{10}\right|\), \(\left|{{{\Delta }C}^{*}}_{ab, 10}\right|\), and \(\left|{{\Delta }h}_{ab, 10}\right|\), were used (overall color appearance change ΔECMC(2:1) always have positive values). That is because the illumination and sample factors have resulted in both positive and negative values of those color appearance changes (see Figure 5), which would be deducted from each other when averaged. Table 3 shows Pearson’s correlation coefଁcients between the variables studied.
Table 3
Pearson’s correlation coefficients between the variables studied.
Independent variables | Dependent variablesb |
|---|
\(\left|{{{\Delta }L}^{*}}_{10}\right|\)
|
\(\left|{{{\Delta }C}^{*}}_{ab, 10}\right|\)
|
\(\left|{{\Delta }h}_{ab, 10}\right|\) | ΔECMC(2:1) |
|---|
Illumination factor | CCT | -0.419** | -0.480** | -0.336** | -0.627** |
Sample factorsa | Texture strength | 0.021 | 0.056 | 0.160** | 0.140* |
Physical L*10 | -0.010 | 0.003 | -0.053 | -0.087 |
Physical C*ab,10 | 0.649** | 0.577** | -0.245** | 0.472** |
Physical hab,10 | -0.149* | -0.151* | -0.034 | -0.081 |
aSample factors.
Notes. Texture strength: measured surface roughness.
Physical L*10, C*ab,10, and hab,10: spectrophotometrically measured L*10, C*ab,10, and hab,10 values of the sample.
bDependent variables.
Notes. Color appearance changes of samples from their physical colors caused by illumination:
\(\left|{{{\Delta }L}^{*}}_{10}\right|\) = \(\left|{{L}^{*}}_{\text{A}} \text{u}\text{n}\text{d}\text{e}\text{r} \text{t}\text{h}\text{e} \text{i}\text{l}\text{l}\text{u}\text{m}\text{i}\text{n}\text{a}\text{n}\text{t} - \text{s}\text{p}\text{e}\text{c}\text{t}\text{r}\text{o}\text{p}\text{h}\text{o}\text{t}\text{o}\text{m}\text{e}\text{t}\text{r}\text{i}\text{c}\text{a}\text{l}\text{l}\text{y} \text{m}\text{e}\text{a}\text{s}\text{u}\text{r}\text{e}\text{d} {{L}^{*}}_{10}\right|\); \(\left|{{{\Delta }C}^{*}}_{ab, 10}\right|\)=\(\left|{{C}^{*}}_{\text{A}} \text{u}\text{n}\text{d}\text{e}\text{r} \text{t}\text{h}\text{e} \text{i}\text{l}\text{l}\text{u}\text{m}\text{i}\text{n}\text{a}\text{n}\text{t}- \text{s}\text{p}\text{e}\text{c}\text{t}\text{r}\text{o}\text{p}\text{h}\text{o}\text{t}\text{o}\text{m}\text{e}\text{t}\text{r}\text{i}\text{c}\text{a}\text{l}\text{l}\text{y} \text{m}\text{e}\text{a}\text{s}\text{u}\text{r}\text{e}\text{d} {{C}^{*}}_{ab,10}\right|\);
\(\left|{{\Delta }h}_{ab, 10}\right|\) = \(\left|{h}_{\text{A}} \text{u}\text{n}\text{d}\text{e}\text{r} \text{t}\text{h}\text{e} \text{i}\text{l}\text{l}\text{u}\text{m}\text{i}\text{n}\text{a}\text{n}\text{t}- \text{s}\text{p}\text{e}\text{c}\text{t}\text{r}\text{o}\text{p}\text{h}\text{o}\text{t}\text{o}\text{m}\text{e}\text{t}\text{r}\text{i}\text{c}\text{a}\text{l}\text{l}\text{y} \text{m}\text{e}\text{a}\text{s}\text{u}\text{r}\text{e}\text{d} {h}_{ab,10}\right|;\)
ΔECMC(2:1): Total color difference between physical color and color appearance.
*P < 0.05; **P < 0.01.
As presented in Table 3, the CCT of illuminants and the physical C*ab,10 of samples significantly affected the magnitudes of the changes in all the color appearance attributes of lightness, chroma, and hue appearances, and overall color appearance of samples at a significance level of 0.01 (P < 0.01). In particular, the effects of the CCT of illuminants found in this study were inconsistent with the findings of a previous study on the effect of illumination on the color appearance changes of fabrics [6]. In the previous study, the effects of the CCT and luminance of illuminants were studied with the use of colored-yarn mixed woven fabrics and it was found that the CCT of illuminants affected only the lightness appearance changes of the fabrics. This indicates that different types of fabrics with different surface characteristics have different effects of illumination on their color appearance changes. Meanwhile, the texture strength of samples significantly affected their changes in hue and overall color appearances under illuminants, while the physical hab,10 of samples significantly affected their lightness and hue appearance changes (P < 0.05).
Effects of the correlated color temperature of illuminants
To illustrate the significant effects of the CCT of illuminants, a one-way ANOVA with Tukey's post-hoc test was conducted. Figures 7-10 compare the average magnitudes of color appearance changes, that is, lightness, chroma, hue, and overall color appearance changes, respectively, of samples from their true physical colors under 2856 K, 4000 K, 5000 K, and 6500 K illumination conditions. For the magnitudes of lightness and chroma appearance changes, the relative values of the changes, that is, ΔL*10 and ΔC*ab,10, as well as the absolute values, that is, \(\left|{{{\Delta }L}^{*}}_{10}\right|\) and \(\left|{{{\Delta }C}^{*}}_{ab, 10}\right|\), were analyzed to see not only the effect sizes, but also their different directions. On the other hand, for the magnitudes of hue appearance changes, the absolute values of the changes, that is, \(\left|{{\Delta }h}_{ab, 10}\right|\), were observed. This is because hab,10 indicates the degree of the four unique hues red (hab,10 = 0 or 360), yellow (hab,10 = 90), green (hab,10 = 180), and blue (hab,10 = 270), which are arranged orthogonally making four quadrants (red-yellow, yellow-green, green-blue, and blue-red). Therefore, unlike ΔL*10 and ΔC*ab,10, discussing whether the value of Δhab,10 is positive or negative is meaningless if the two hues to be compared belong to different quadrants [6]. Meanwhile, in Figures 7-10, the superscripts a, b, c, and d denote the four groups that were determined to be significantly different from each other by Tukey's test.
It can be seen in Figures 7-(b) and 8-(b) that among four illuminants with different CCTs, illuminant A caused the largest magnitude of lightness and chroma appearance changes on average resulting in the largest overall color appearance change accordingly, which is shown in Figure 10. This means that the lightness and chroma appearances of paper and fabric samples differed more greatly from their actual physical lightness and chroma under the reddish illuminant with the lowest CCT of 2856 K than other illuminants with higher CCTs, which have more bluish hues. This (the results presented in Figures 7-(a) and 8-(a) as well) also implies that even if samples presented under illuminant A and other illumination conditions of higher CCTs have exactly the same physical color attributes, the sample under illuminant A tends to appear brighter and more colorful than others (since ΔL*10 and ΔC*ab,10 were calculated by subtracting the spectrophotometrically measured color values, that is, L*10 and C*ab,10, from the relevant color appearance values, that is, L*A and C*A, respectively, under the illuminant). Meanwhile, it is of note that a lower CCT condition of illumination did not always result in larger color appearance changes from actual colors. As can be seen in Figures 8-(b) and 9, the average chroma and hue appearance changes induced by illuminants F11 and F2 with CCT of 4000 K and 4230 K, respectively, were not significantly different from each other. Furthermore, illuminant F2 with a higher CCT generally induced the larger overall color appearance change of samples than illuminant F11 as shown in Figure 10. This inconsistent result is thought to be due to the minute difference between the CCTs of these two illuminants. Also, since each color appearance attribute is differently affected by the CCT of illuminants, it is safe to say that the desired lightness, chroma, and hue appearances of products can be obtained by changing the CCT of the illuminants differently in the sales environment. For example, increasing the CCT of the illuminant from 4000K to 6500K, even though it is a relatively huge change, may not cause a significant change in the lightness appearance of products (see Figure 7-(a)), while it is likely to cause the significant chroma and hue appearance changes (see Figures 8-(a) and 9).
The specific trend of the illumination effect according to the physical color attributes of samples will be discussed later.
Effects of the texture strength of samples
As stated previously, the texture strength of samples significantly affected their hue and overall color appearance changes under different illuminants. To illustrate these significant effects of texture strength, a one-way ANOVA with Tukey's post-hoc test was conducted. Figures 11 and 12 compare the average magnitudes of hue and overall color appearance changes, respectively, of three types of differently textured samples, non-textured paper samples and weak-textured and strong-textured fabric samples, under standard illuminants. The reason for using absolute values for hue appearance changes was discussed previously.
As can be seen in Figures 11 and 12, strong-textured fabric samples had larger hue appearance changes and consequent overall color appearance changes from their true colors due to illuminants than non-textured paper samples. Between the two types of textured fabric samples, namely weak-textured and strong-textured samples, there was no significant difference in the magnitude of color appearance changes. This indicates that when the difference in texture strength (Ra) of two surfaces is greater than 0.43 mm (strong-texture 0.46 mm - no-texture 0.03 mm = 0.43 mm), significant differences in the hue appearance and overall color appearance changes induced by illumination can be made. Meanwhile, it is interesting to note that there was no significant effect of texture strength on the lightness and chroma appearance changes under illuminants despite the fact that when three-dimensional textures of different heights meet with illumination, they create dark and desaturated shadows on the surface, which are likely to cause different degrees of overall lightness and chroma appearance changes of the surface. This is thought to be due to the not tremendously large difference in texture strength between samples, and further investigation with the use of more diverse samples in terms of texture strength will be useful to obtain more reliable results.
Effects of the physical C* ab,10 of samples
The physical chroma C*ab,10 of samples significantly affected the magnitudes of all their lightness, chroma, hue, and overall color appearance changes under different CIE illuminants. To describe these effects, a simple regression analysis was conducted. Figures 13-16 show the plots of ΔL*10, ΔC*ab,10, Δhab,10, and ΔECMC(2:1), respectively, of 72 samples induced by illumination against the C*ab,10 of the samples. The third-order polynomial was employed to derive the best fitting lines shown in the Figures 13-16.
The trend lines in Figures 13-(b) and 14-(b) indicate that the magnitude of the lightness and chroma appearance changes of samples induced by illumination generally increased with the increment of C*ab,10 of the samples. As for the direction of these effects, Figures 13-(a) and 14-(a) show that, under the CIE illuminants, samples had lighter and more saturated appearances than the actual colors having positive values of ΔL*10 and ΔC*ab,10 in general, and samples with higher physical chroma showed this trend more strongly. These greater lightness and chroma appearance changes of the samples of higher C*ab,10 resulted in greater overall color appearance changes as shown in Figure 16. Meanwhile, the hue appearance changes of samples induced by illumination showed a different trend from their lightness, chroma, and overall color appearance changes - that is, samples with higher C*ab,10 did not always had larger hue appearance changes. It was also found that when the C*ab,10 of samples was close to 0, which indicates an achromatic color, the hue appearances of the samples were most affected by illumination overall having the widest \(\left|{{\Delta }h}_{ab,10}\right|\) distribution and its highest average value of approximately 25. The inconstancy of achromatic colors in terms of hue appearances due to illumination was also reported by Chae and Lee [16]. On the other hand, when the C*ab,10 of samples was between 10 and 20 and close to 50, their hue appearances were least affected by illumination, maintaining their original physical hues.
Effects of the physical h ab,10 of samples
The physical hue hab,10 of samples significantly affected the magnitudes of their lightness and chroma appearance changes under different CIE illuminants. Figures 17 and 18 show the plots of ΔL*10 and ΔC*ab,10, respectively, of 72 samples against the hab,10 of the samples with the best fitting lines. As can be seen in Figures 17-(b) and 18-(b), when the hab,10 of samples was between 0 and 90, which indicates orangish hues, the lightness and chroma appearances of the samples were generally the most different from their actual colors under the illuminants. On the other hand, when samples were of bluish-red hues having the hab,10 between 270 and 360, relatively small lightness and chroma appearance changes were caused. Meanwhile, as for the direction of lightness appearance changes under the CIE illuminants, Figure 17-(a) shows that samples with the hab,10 between approximately 0 (red) and 135 (yellowish-green) and between approximately 315 (bluish-red) and 360 (red) tended to have lighter appearances than their actual colors having positive values of ΔL*10. The samples of which hab,10 was between approximately 135 (yellowish-green) and 315 (bluish-red), however, generally had darker appearances than the actual colors. Unlike the direction of lightness appearance changes, that of chroma appearance changes, which is described in Figure 18-(a), indicates that samples generally had more chromatic appearances than their actual colors under the CIE illuminants regardless of their physical hue. All the results found in this study imply different effects of illumination on color appearances depending on the surface texture and physical color attributes and thus illumination can be used effectively so that objects with different surface characteristics can have intended color appearances.