Cell culture
The PANC-1, MIA PaCa-2, and BxPC-3 cell lines were purchased from the Type Culture Collection Cell Bank of the Chinese Academy of Sciences (Shanghai, China). PANC-1 and MIA PaCa-2 cells were cultured in Dulbecco’s Modified Eagle’s Medium (DMEM) (#30030, Thermo Fisher Scientific) supplemented with 10% fetal bovine serum (FBS) (#10099141, Thermo Fisher Scientific) and 1% penicillin/streptomycin at 37 °C in a 5% CO2 incubator. BxPC-3 cells were cultured in RPMI-1640 medium (#88365, Thermo Fisher Scientific) supplemented with10% FBS and 1% penicillin/streptomycin at 37 °C in a 5% CO2 incubator.
Antibodies and chemicals
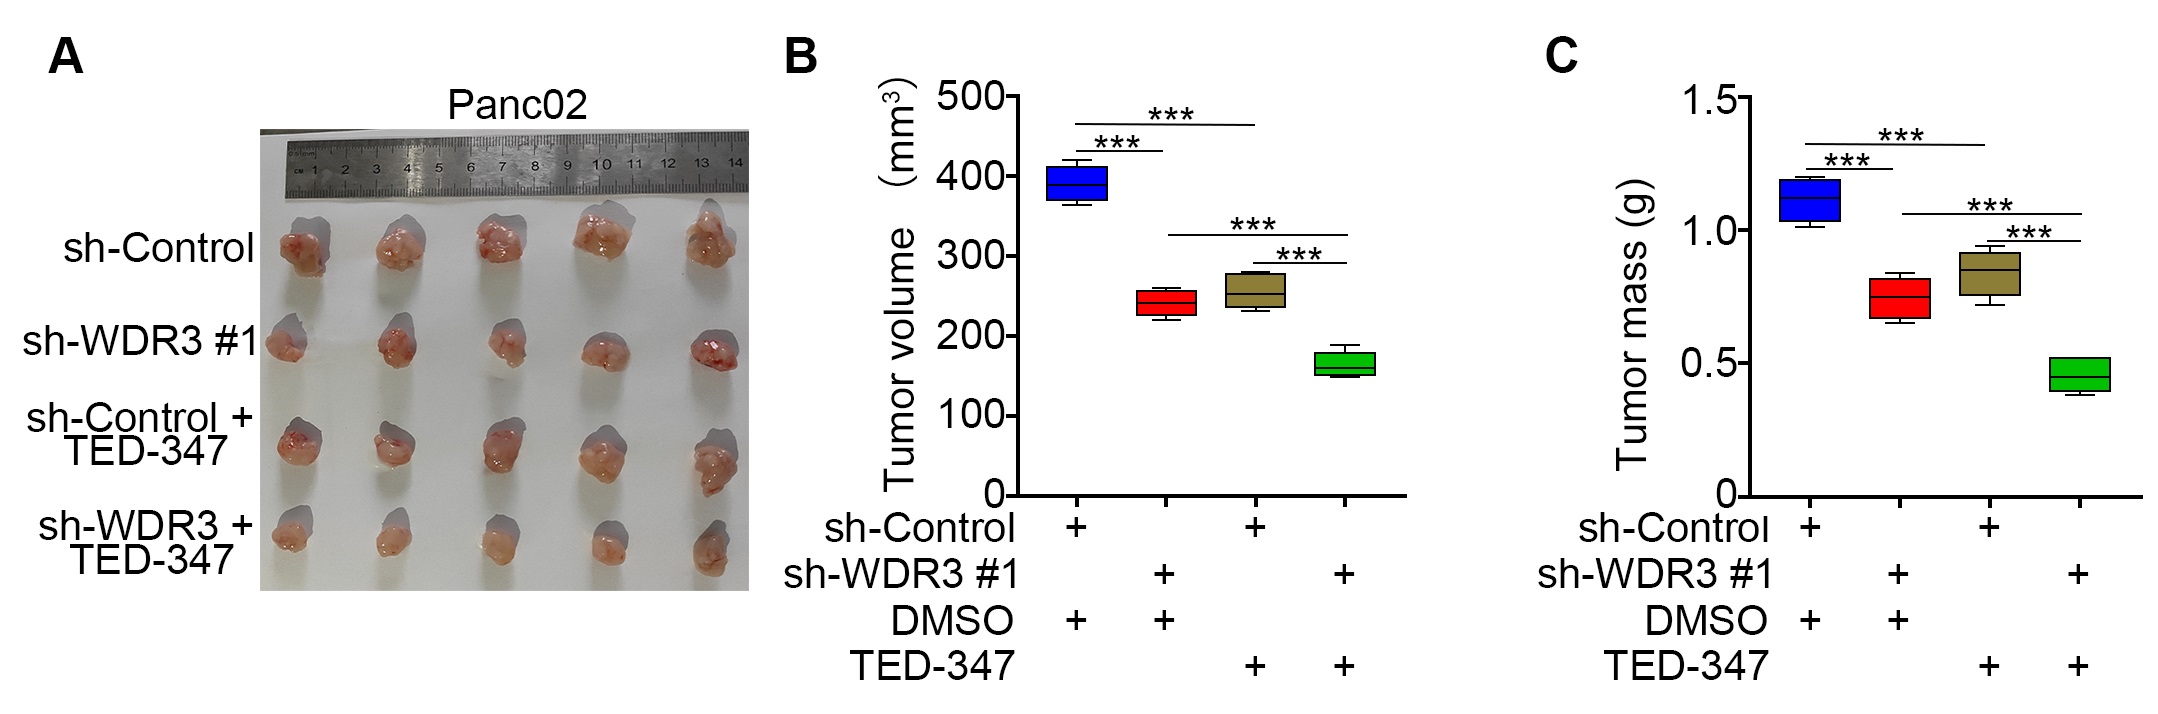
An anti-WDR3 antibody (#ab176817, working dilution 1:1000) was purchased from Abcam. An anti-GAPDH antibody (#10494-1-AP, working dilution: 1:3000), anti-GATA4 antibody (#19530-1-AP, working dilution: 1:1000), and anti-YAP1 antibody (#13584-1-AP, working dilution: 1:1000) were acquired from Proteintech. TED-347 (HY-125269, working concentration: 10 µM) was procured from MedChemExpress (USA).
Immunoprecipitation and western blot analysis
Whole cell lysates were obtained with RIPA lysis buffer (Cell Signaling Technology, Danvers, MA) containing 1% protease and phosphatase inhibitors (Sigma-Aldrich) on ice. The resulting cell lysates were centrifuged at 12,000 rpm for 15 min at 4 °C to remove undissolved impurities and collect the supernatants. The protein concentration was quantified using a BCA assay (#P0012S, Beyotime). Protein extracts (500 μg) were incubated with appropriate primary antibody beads overnight for an immunoprecipitation assay or directly evaluated for western blot analysis. The precipitated immune complexes were subjected to SDS-PAGE, transferred to 0.45-µm polyvinylidene difluoride (PVDF) membranes, and then immunoblotted with specific primary antibodies. The signal intensities of bands were quantified using ImageJ software.
Liquid Chromatography-Tandem Mass Spectrometry/Mass Spectrometry (LC-MS/MS) analysis
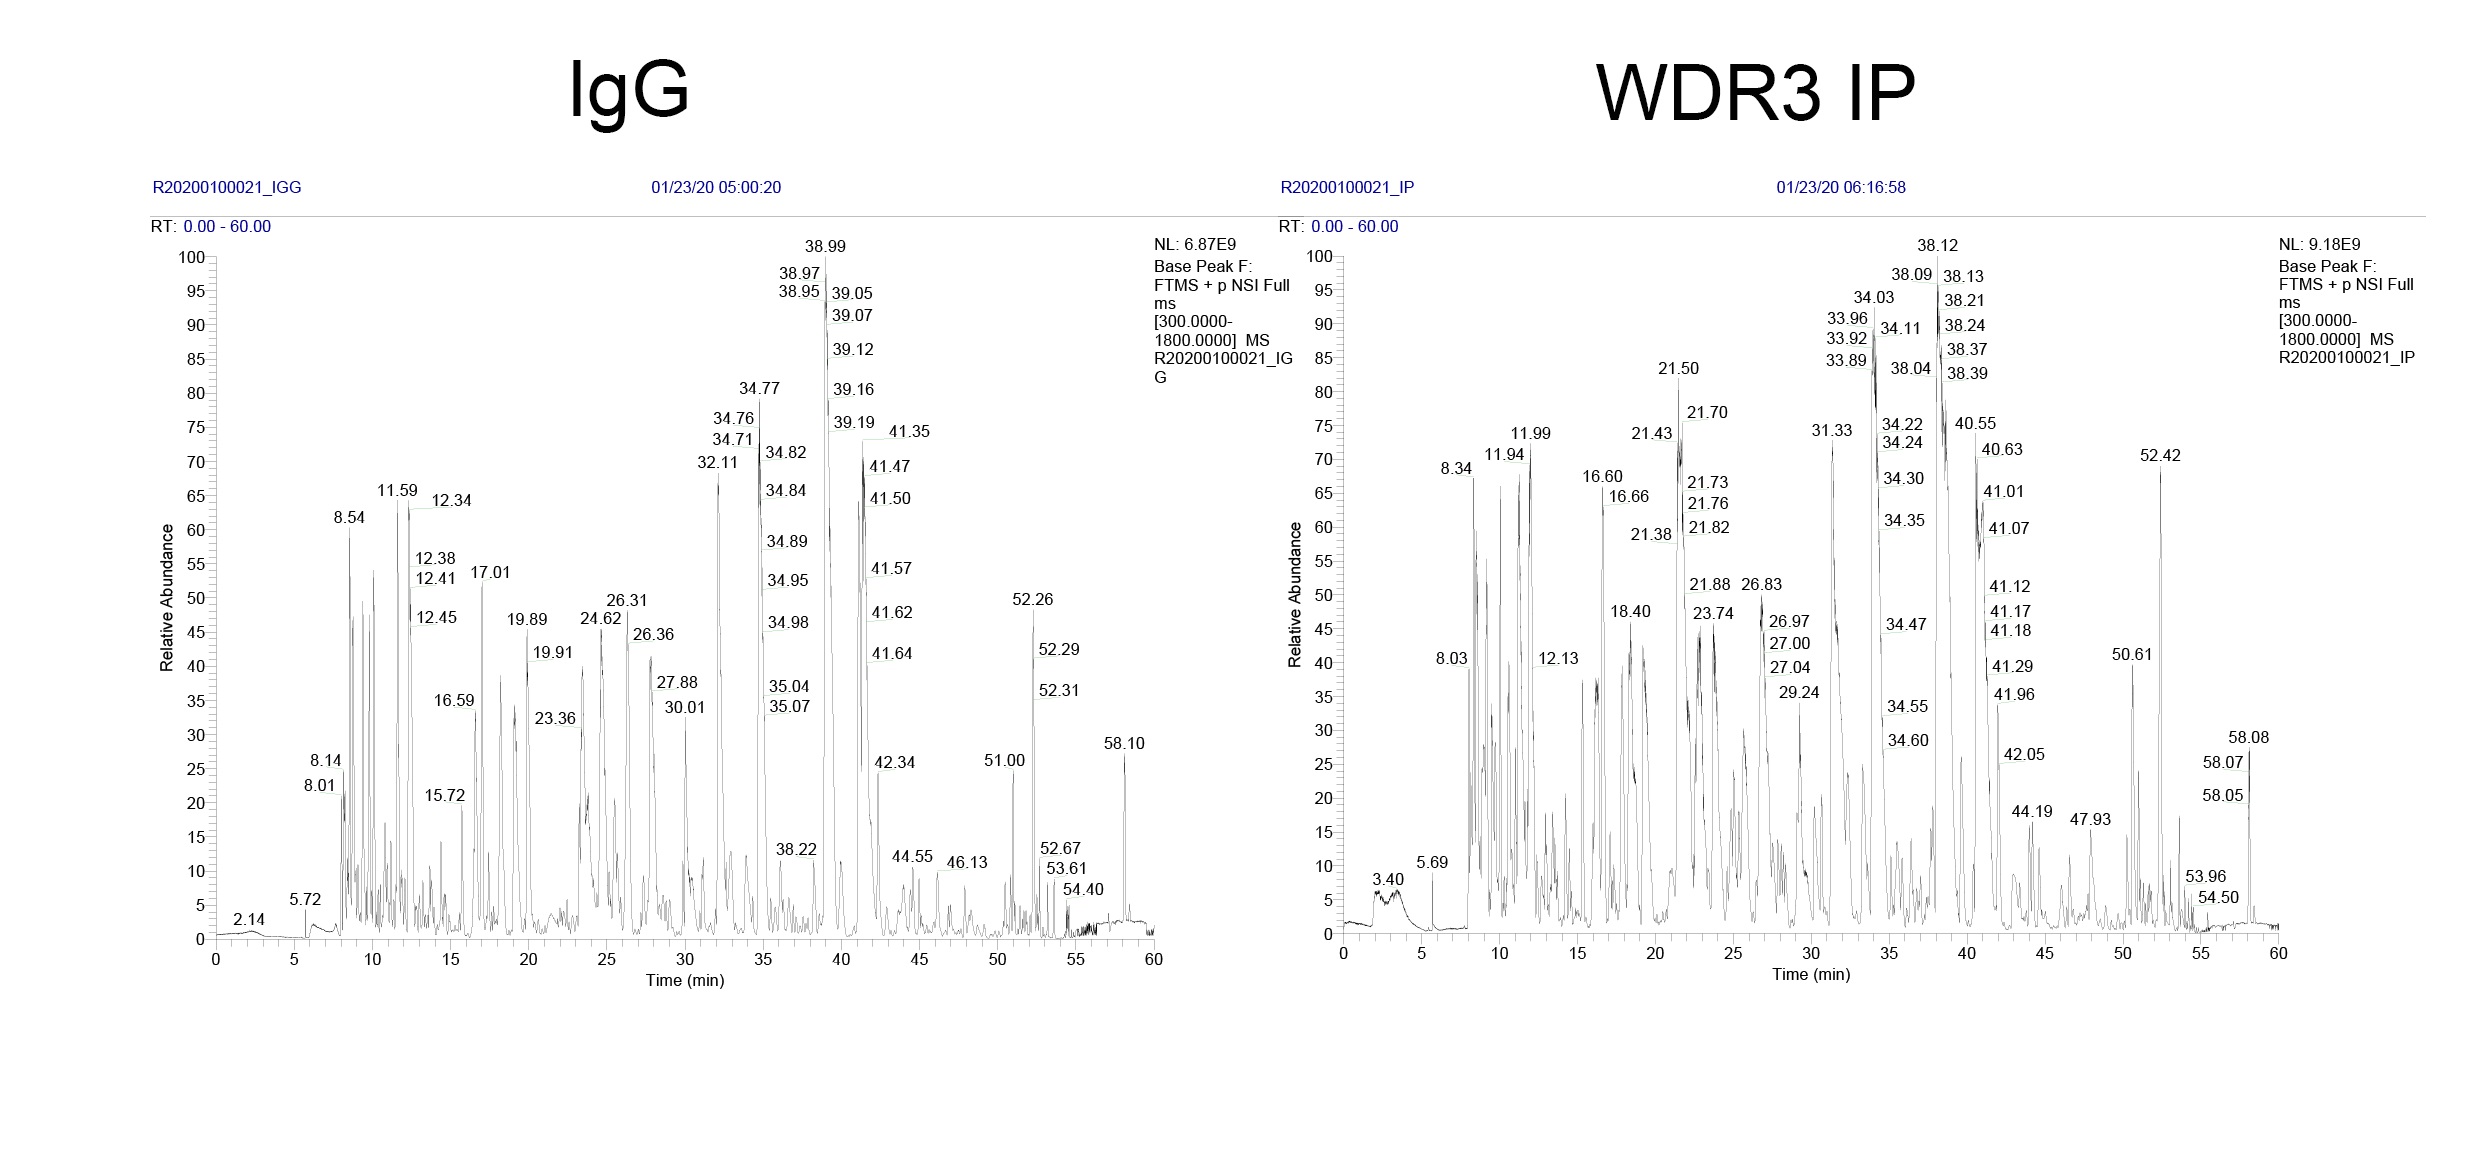
To identify potential WDR3-binding proteins, 293T cells transduced with pcDNA3-WDR3 were collected for assays. WDR3 was pulled down by IP using an anti-WDR3 antibody and protein A+G agarose (#P2012, Beyotime) at 4 °C. LC-MS/MS analysis was performed using a Thermo Ultimate3000 liquid phase combined with Q Exactive Plus high-resolution mass spectrometry at Shanghai Applied Protein Technology. The data were retrieved with maxquant (v1.6.6) software, and the database retrieval algorithm was Andromeda. The database used in the search was the human proteome reference database of UniProt. The results were screened with a 1% FDR at the protein and peptide levels.
RNA-seq
A total amount of 1 µg of RNA per sample was used as the input material for RNA sample preparations. Sequencing libraries were generated using the NEBNext® UltraTM RNA Library Prep Kit for Illumina® (NEB, USA) following the manufacturer’s recommendations, and index codes were added to attribute sequences to each sample. Clustering of the index-coded samples was performed on the cBot Cluster Generation System using the TruSeq PE Cluster Kit v3-cBot-HS (Illumina) according to the manufacturer’s instructions. After cluster generation, the library preparations were sequenced on an Illumina Novaseq platform, and 150-bp paired-end reads were generated. FeatureCounts v1.5.0-p3 was used to count the read numbers mapped to each gene. Differential expression analysis of two conditions/groups (two biological replicates per condition) was performed using the DESeq2 R package (1.16.1). We used the cluster Profiler R package to test the statistical enrichment of differentially expressed genes in KEGG pathways.
Quantitative RT-PCR assay
Total RNA was extracted with RNAiso Plus (#15596026, Invitrogen). The PrimeScript RT Reagent Kit (#RR047A, TAKARA, Japan) was used for reverse transcription. Real-time PCR (RT-PCR) was conducted with a TB Green™ Fast qPCR Mix kit (#RR430A, TAKARA, Japan). The 2-ΔCt method was used to quantify fold changes with normalization to GAPDH. Detailed information on the primer sequences is shown in Table S1.
RNA interference
Sh-Control and gene-specific shRNAs were procured from Sigma-Aldrich, and si-Control and gene-specific siRNAs were provided by RiboBio. Pancreatic cancer cells were transfected with siRNA using Lipofectamine 2000 (#11668019, Thermo Fisher Scientific) in accordance with the manufacturer's instructions for 24 h, and then the Lipofectamine 2000-containing medium was replaced with fresh DMEM containing 10% FBS. 293T cells were transfected with shRNA plasmids and packaging plasmids (pVSV-G and pEXQV) in Lipofectamine 2000 according to the manufacturer's instructions for 24 h, and the Lipofectamine 2000-containing medium was replaced with fresh DMEM containing 10% FBS and 1 mM sodium pyruvate. At 48 h post transfection, the virus culture medium was collected and added to pancreatic cancer cells for 24 h of culture, after which the infected cells were selected with 1 μg/ml puromycin. The shRNA and siRNA sequences are shown in Table S2.
Chromatin immunoprecipitation (ChIP) and ChIP-qPCR
ChIP was performed with the Chromatin Extraction Kit (#ab117152, Abcam) and ChIP Kit Magnetic-One Step (#ab156907, Abcam) according to the manufacturer’s instructions. Purified DNA was analyzed using RT-PCR with a TB Green™ Fast qPCR Mix kit (#RR430A, TAKARA, Japan) following the manufacturer’s protocols. The ChIP-qPCR primers are shown in Table S3.
Nuclear and cytoplasmic extracts preparation
Cells were collected and the cell pellet was resuspended in 1 mL of Buffer A (10 mM HEPES-KOH, pH 7.9, 1.5 mM MgCl2, 10 mM KCl, 0.1% NP-40) to lyse the cells on ice for 10 min. Samples were spined down at 6,500 rpm 4℃ for 3 min to pellet the nuclei. Nuclei pellet was washed with Buffer A and spined down at 3,500 rpm for 5 min at 4℃. The cell pellet was lysed by IP buffer (50 mM Tris-HCl, pH 7.4, 150 mM NaCl, 1% Triton X-100, 1% sodium deoxycholate, and 1% protease inhibitor cocktails) on ice for more than 30 min. Protein concentration was determined by BCA protein quantification assay.
Colony formation assay
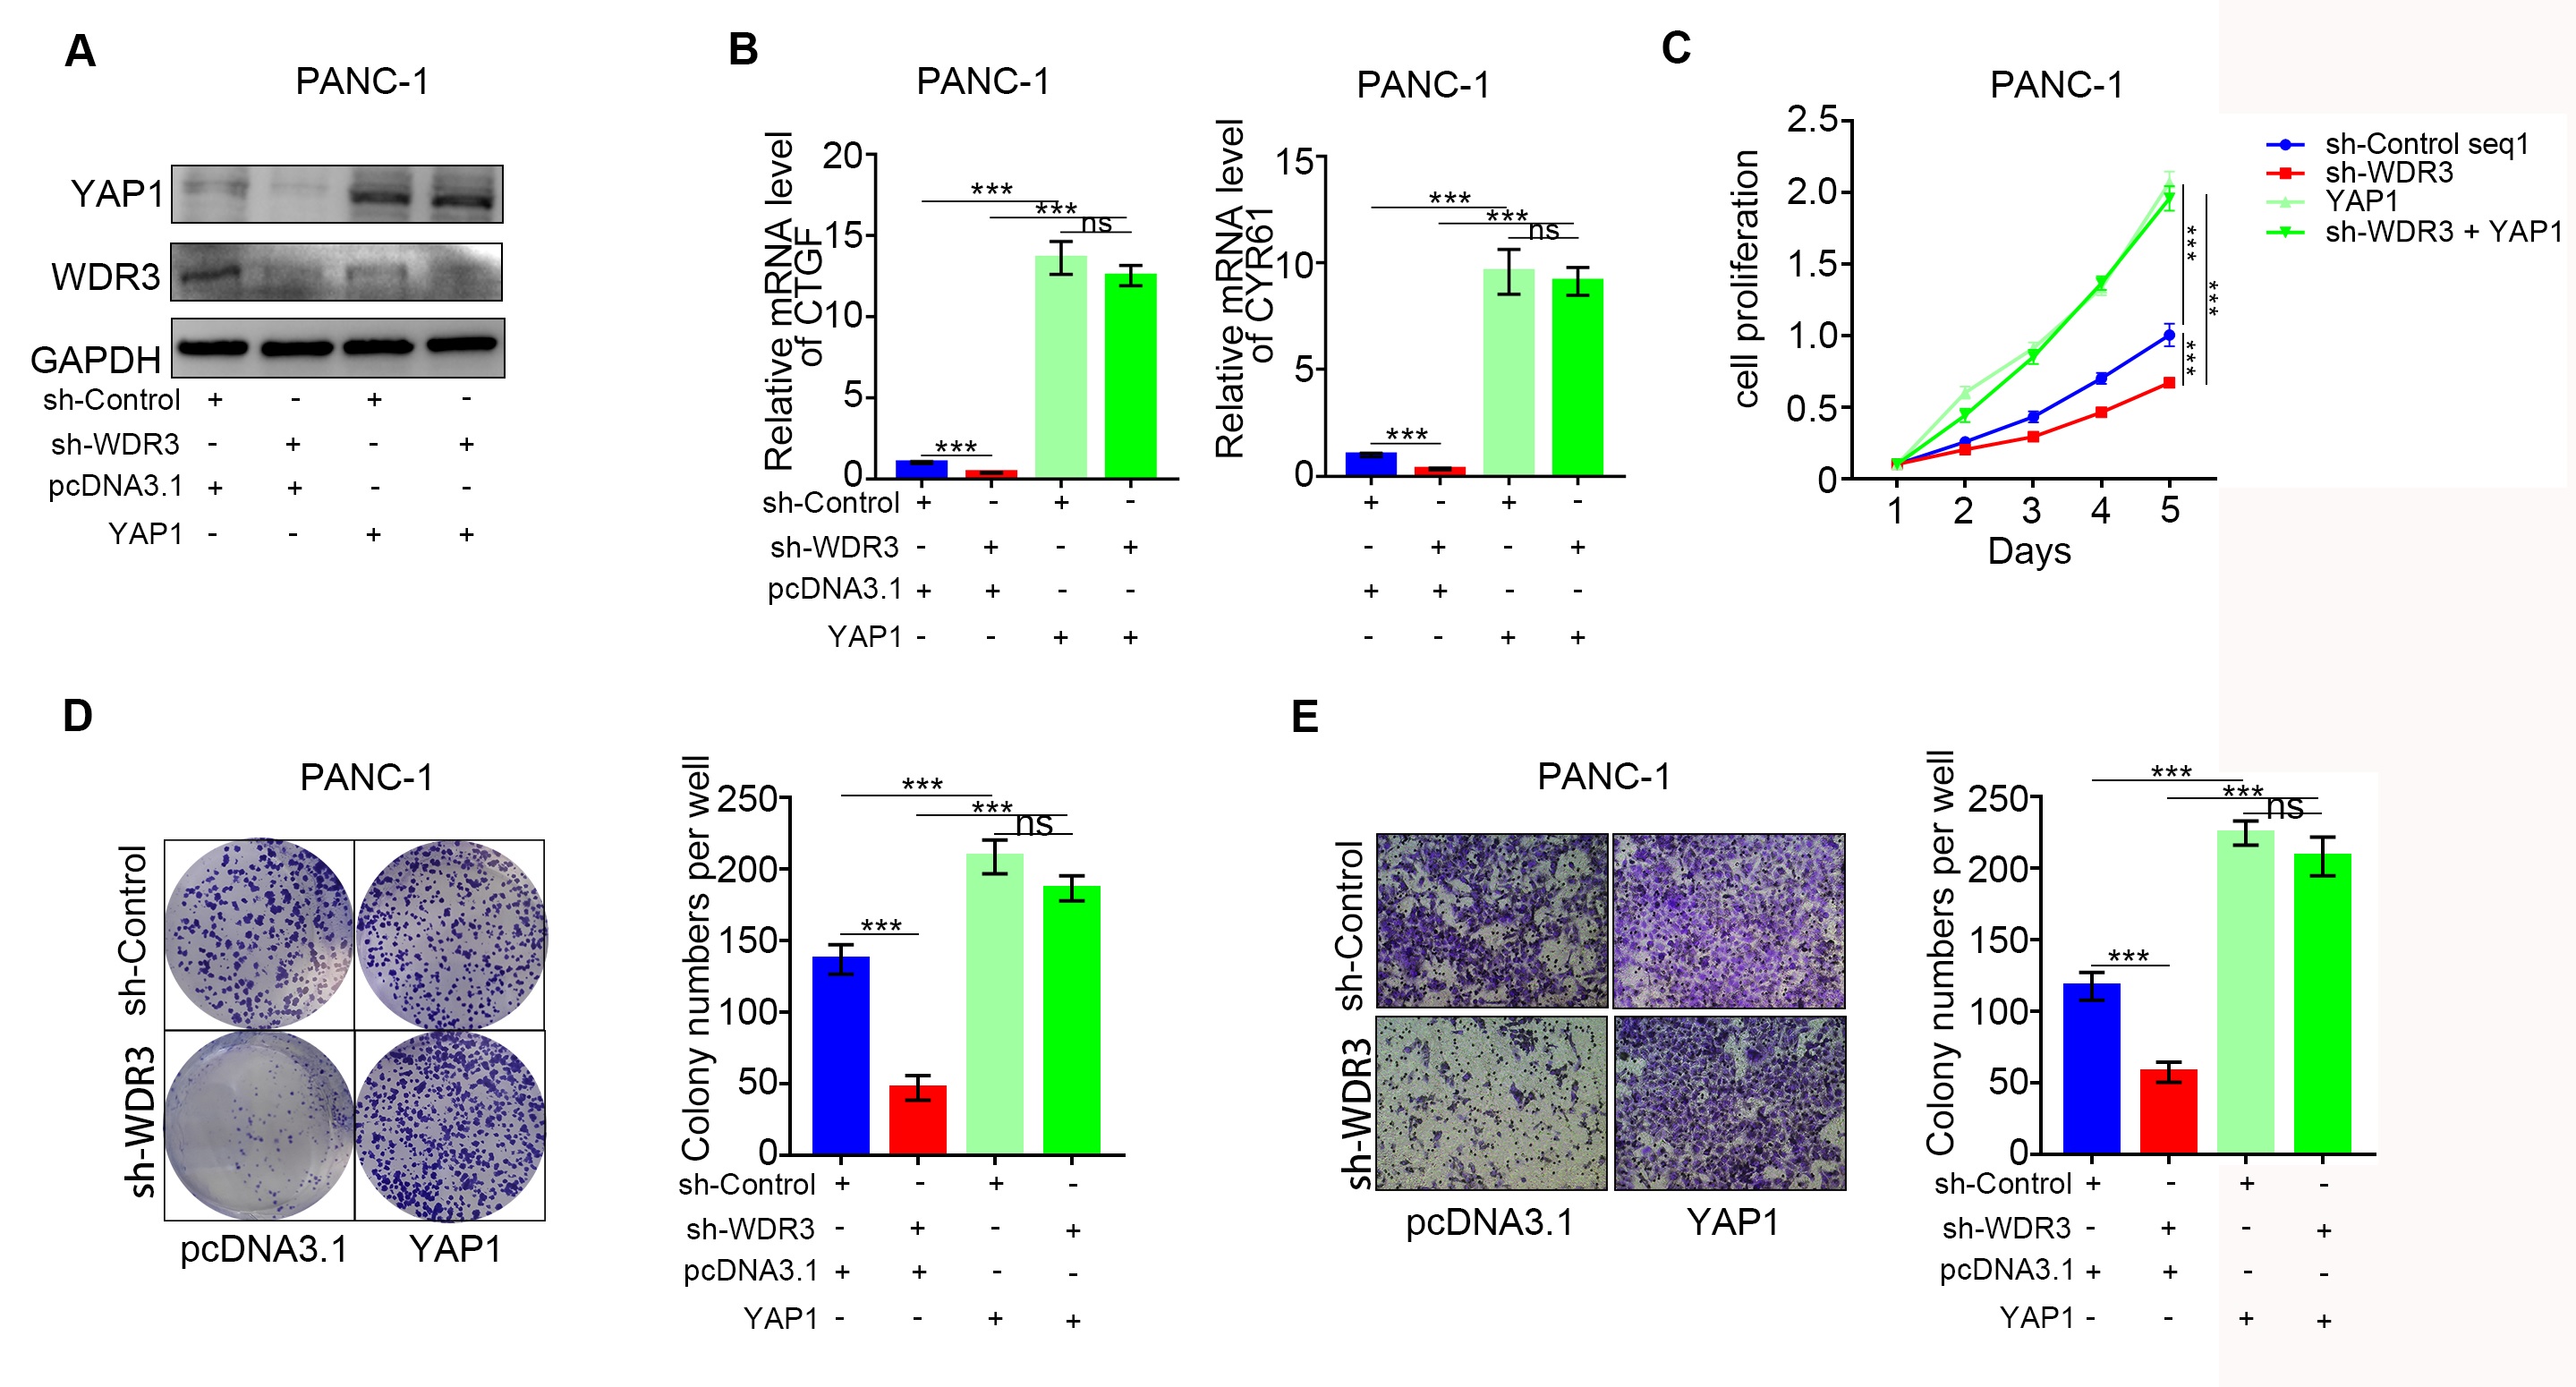
For colony formation assays, 500 pancreatic cancer cells transfected with sh-Control or sh-WDR3s were seeded in a six-well plate and cultured for approximately 10-12 days. Then, the colonies were fixed in methanol for 30 mins and stained with a 4 g/l crystal violet solution for 30 mins. The colonies were photographed, and the number of colonies was counted. All assays were performed in triplicate.
MTS assay
For MTS assays, transfected pancreatic cancer cells were seeded in 96-well plates with 2500 cells per well. After 72 h of culture, [3-(4,5-dimethylthiazol-2-yl)-5-(3-carboxymethoxyphenyl)-2-(4-sulfophenyl)-2H-tetrazolium] (MTS reagent) (Abcam, #ab197010, USA) was added to each well for three hours of culture according to the manufacturer's instructions. The absorbance in each well was measured with a microplate reader at 490 nm. Each experiment included five replicates and was performed in triplicate.
Cell invasion assay
Cell invasion assays were performed using transwell chambers (8-μm pore size; Millipore) with a Matrigel (BD Biosciences, CA, USA) matrix. In brief, 600 μl of complete medium supplemented with 30% FBS was added to the bottom chamber, and 105 transfected pancreatic cancer cells were suspended in 200 µL of serum-free medium and added to the upper chamber. After culturing for 12-24 h, the cells on the top surface of the membrane were mechanically removed using a cotton swab. The cells on the bottom surface of the membrane were fixed in methanol for 30 mins and stained with a 4 g/l crystal violet solution for 30 mins. The invaded cells were counted under a microscope, with five fields per well evaluated. Each experiment was performed in triplicate.
Bioinformatic mining
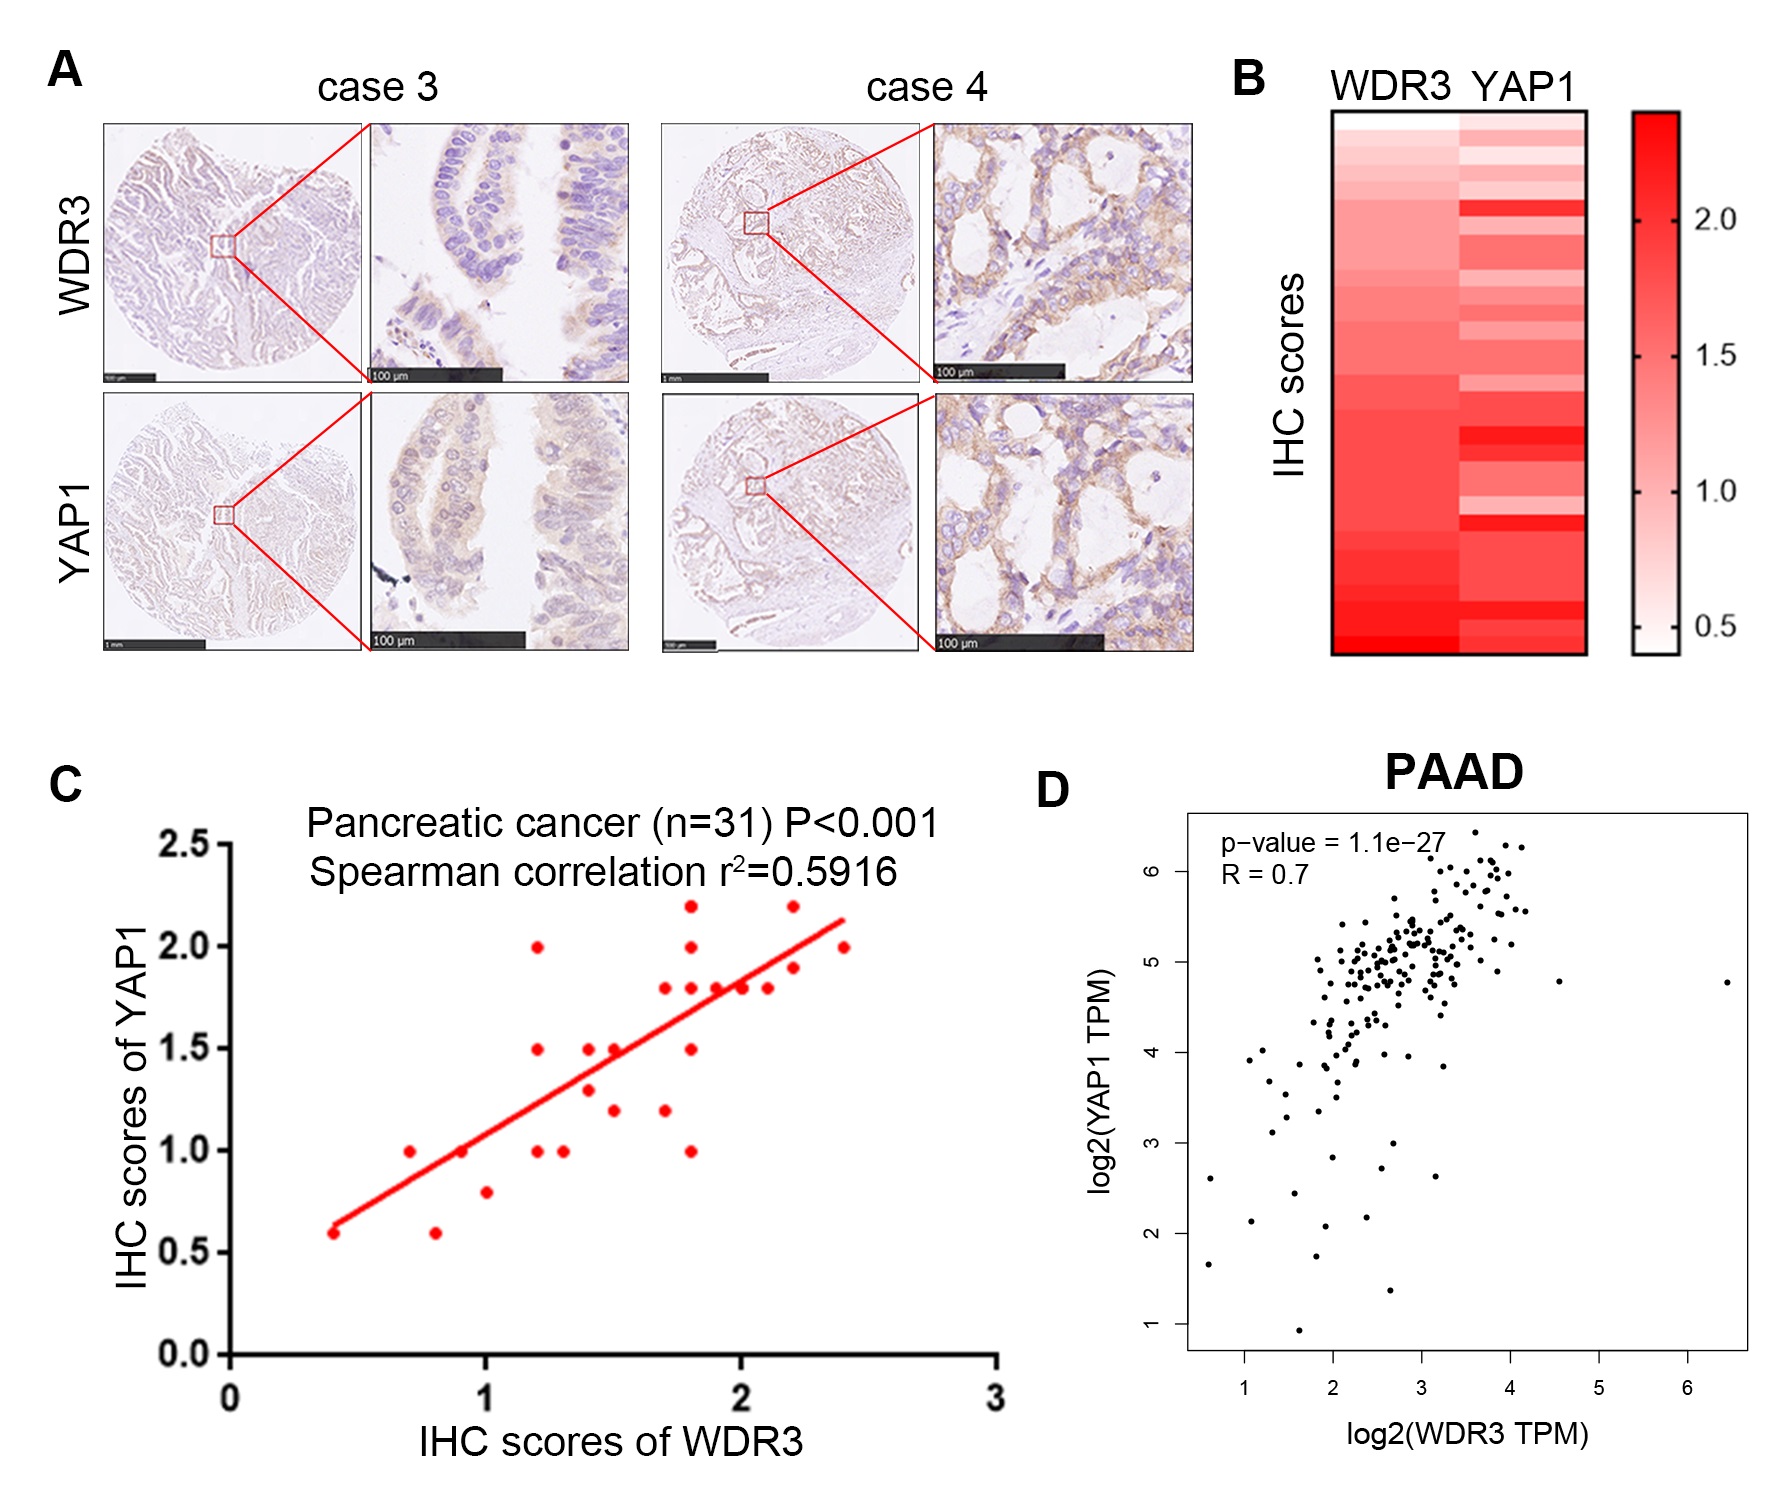
Gene correlation analyses between the mRNA expression levels of WDR3 and YAP1 were carried out with the GEPIA database (http://gepia.cancer-pku.cn/) for all given sets of GTEx and TCGA expression data. The Eukaryotic Promoter Database (https://epd.epfl.ch//index.php) was used to determine the potential binding sites of GATA4 in the promoter of the YAP1 gene.
PDAC xenografts in nude mice
Animal experiments were approved by the Ethical Committee on Animal Experiments of the Sichuan Provincial People’s Hospital in Chengdu, China. PANC-1 cells (3 x 10⁶) infected with sh-Control or sh-WDR3 #1 were subcutaneously injected into the left flank of BALB/c-nu mice (4-5 weeks old, male) purchased from Vital River. Tumor sizes were assessed with a digital Vernier caliper every three days. Tumors were harvested 3 weeks after injection, and tumor weights were measured.
Orthotopic syngeneic model of pancreatic cancer to C57BL/6 mice
We used 8-week-old wild-type C57BL/6 mice in the experiments. For orthotopic implantation, mice were anesthetized with pentobarbital sodium, and hair was removed from their abdomens. We incised each mouse longitudinally along the abdomen to expose the pancreas, injected 20 μL of the cell suspension into the pancreas, and closed the incision with sutures. Each experimental group consisted of five mice. All mice were weighed and checked for signs of distress regularly. Abdominal palpation was used to monitor tumor size. Tumors were harvested 3 weeks after injection, and tumor weights were measured.
Statistical analysis
All data are expressed as the mean ± standard deviation (SD) of three independent experiments. Comparisons between two groups were performed using Student’s t-test, and two-way ANOVA or one-way ANOVA together with the Bonferroni post hoc test was used for multigroup analysis. A P value less than 0.05 was considered significant. GraphPad Prism 6 software (GraphPad Software, Inc.) was used for statistical analysis.