This work focused on the effects of chitosan (CS) and 9,10-dihydro-9-oxo-10-phosphaphenanthrene-10-oxide (DOPO) on the flammable properties of epoxy resin matrix. The EP composites were fabricated by direct mixing method following a general curing method. The influence of CS, DOPO and CS / DOPO on the resin was investigated through cone calorimetry tests (CC), UL-94 vertical burning, limiting oxygen index (LOI), thermal gravimetric analyzer (TGA), differential scanning calorimeter (DSC) and thermogravimetric analyzer-Fourier infrared combined system (TG-FTIR). The char residues of the modified EPs after CC tests were investigated by FTIR, EDX and XPS. Under the 10% addition of CS/DOPO with the mass ratio of CS and DOPO of 1 : 1, 1 : 2, 1 : 3, 2 : 1 and 3 : 1 in EP, the flame retardancy of the all EPs increased, but only EP/10% CS1/DOPO2 and EP/10% CS2/DOPO1 achieved a V-0 rating and their values of LOI were 33.7% and 32.5%, respectively. Compared with EP, the peak heat release rate, peak smoke produce rate and total heat release of EP/10% CS1/DOPO2 and EP/10% CS2/DOPO1 decreased, especially, total smoke release decreased by 61.9% and 71.0%, the char residuals amount increased by 84.3% and 41.6%, and the average CO2 yield decreased by 55.4% and 55.0%, respectively. It is worth nothing that the mechanical properties were improved, especially the flexural strength increased by 36.0% and 38.4%, respectively. The results indicated that DOPO and CS had important synergistic effects for simultaneous increase both the flame retardancy and mechanical properties of EP composites.
Research Article
Flame Retardancy and Mechanical Properties of Chitosan and DOPO with Different Mass Ratios in Epoxy Resin
https://doi.org/10.21203/rs.3.rs-1095633/v2
This work is licensed under a CC BY 4.0 License
Version 2
posted
You are reading this latest preprint version
Epoxy resin
Chitosan
DOPO
Flame retardancy
Different mass ratios
Epoxy resin is a kind of polymer material that is widely used and has obvious merits and demerits (Wang et al. 2020; Kandola et al. 2010; Ai et al. 2020). Applications in some fields were limited due to its significant flammable defects (Wang et al. 2006). At present, the fire resistancy of epoxy resins has been extensively studied and the addition of flame retardants is considered to be the most direct, efficient and economical usage mode (Tang et al. 2019; Netkueakul et al. 2020). However, the addition of flame retardants will generally reduce the mechanical properties of epoxy resin (Zou et al. 2020). The DOPO derivatives were widely used as phosphorous flame retardants in EP. Xie et al. synthesized a flame retardant named MBF-DOPO, when 4% MBF-DOPO was added, the samples obtained the V-0 rating in UL-94 test, and the limiting oxygen index (LOI) reached to 32.9%. Compared to EP, the peak heat release rate and total smoke production values were decreased by 29.3% and 33.6%, respectively (Xie et al. 2020). A flame retardant TAD was synthesized by Tang et al., when the mass fraction of TAD reached 12 wt.%, the samples acquired the highest LOI value of 33.5% and passed the UL94 V-0 rating (Tang et al. 2016). However, the addition of all above mentioned flame retardants in EP resulted in the decrease of the mechanical properties of EP composites.
Intumescent flame retardant (IFR) is a kind of green flame retardant, mainly composed of nitrogen and phosphorus, which is foamed and expanded when heated. It is halogen-free and does not use antimony oxide as a synergist (Lai et al. 2011). Hereby, it is a kind of environmentally flame retardant with high efficiency and low toxicity (Chen et al. 2015; Li et al. 2009). The flame retardancy of IFR mainly depends on the density, quality and strength of the carbon layer, and the matching between the components is essential (Liu et al. 2015; Huang et al. 2020). Previously, PER (pentaerythritol)-based carbon source, a basic petroleum derivative, had been paid much attention by researchers (Xu et al. 2018). The main mechanism was that the hydroxyl group in its molecular structure could crosslink with the inorganic acid produced by the decomposition of acid source during combustion (Xie et al. 2013).
Chitosan is a kind of natural biomass with abundant content in nature, and the molecular structure contains both hydroxyl and amine groups (Kim et al. 2017). It is a kind of alkaline polysaccharide with rich carbon source (Hoqani et al. 2020). Not only that, nonflammable gases can be supplied during combustion. However, when single chitosan was used as flame retardant, its poor thermal stability and low charring efficiency at high temperature limited its application in the field where flame retardancy is required. To increase the carbonization efficiency and the thermal stability of chitosan, some chemical modifications have been done on chitosan through the active amine and hydroxyl groups of chitosan itself (Chen et al. 2020; Pan et al. 2015; Goda et al. 2021).
In order to improve efficiency and reduce energy consumption and cost, in this work, CS and DOPO were directly compounded in a certain mass ratio, and the halogen-free flame retardancy EP composites were prepared by melt blending. The influence of the addition of the CS/DOPO flame retardant on the flame retardancy of epoxy resin was analyzed, and on the basis, the influence mechanism of different mass ratios of CS and DOPO on the flame retardancy properties of epoxy resin composites was also investigated, which provided basic experimental data and theoretical support for the wide application of chitosan in polymers. When the addition amount of CS/DOPO was 10% and the mass ratio of CS to DOPO was 1:2 and 2:1, the LOI value of EP/10% CS1/DOPO2 and EP/10% CS2/DOPO2 increased to 33.7% and 32.5%, respectively, and both passed UL-94 V-0 rating.
Meanwhile, the thermal properties of modified EPs were tested by thermogravimetric analyzer (TGA) and differential scanning calorimeter (DSC). The flame retardancy of modified EPs was analyzed by LOI (limiting oxygen index), UL-94 vertical burning test and cone calorimeter (CC). The morphology and composition of the char residual layer of modified thermosetting polymer were studied by SEM (Scanning Electron Microscope), Raman spectra, EDX (Energy Dispersive Spectxrmleter) and the flame retardancy mechanism were analyzed.
2.1. Raw materials
Epoxy resin (DGEBA, E-44, diglycidyl ether of bisphenol A, expoxy equiv 210-230 g/mol, hydrolysable chlorine ≤ 0. %, inorganic chlorine ≤ 50 mg/kg and softening point 14-23 ℃) was provided by Nantong Xingchen Synthetic Materials Co., LTD, Huangshi, China. Chitosan, DOPO and Diamino diphenylmethane (DDM), were purchased from Sinopharm Chemical Reagent Co., Ltd, Shanghai, China.
2.2. Preparation of modified EPs
In order to investigate the flame retardancy of CS/DOPO in EP, CS and DOPO were added to EP at different total additions and mass ratios. The modified EPs were prepared according to the procedure shown in Fig. 1. Firstly, CS, DOPO and DGEBA were mixed uniformly in a two-necked flask at 100 ℃ under vacuum for about 30 min, and stirred vigorously to obtain a homogeneous liquid. Then, the temperature dropped to 95°C, DDM was added, and stirred under vacuum condition. Finally, the curing process was carried out on the plate vulcanization machine. The mixture was poured into the prepared mold and put into the plate vulcanization machine. The whole curing process included two stages: curing at 100°C for two hours and at 150°C for another two hours. The various modified EP samples labeled on the basis of their compositions, were listed in Table 1. For example, the label EP/10% CS1/DOPO2 indicated that the total amount of CS and DOPO in the samples was 10%, and the mass ratio of CS and DOPO was 1 : 2.
| Samples | EP(g) | DDM (g) | CS/DOPO (wt/wt) | DOPO (g) | CS (g) | P wt% |
|---|---|---|---|---|---|---|
| EP | 25 | 6.5 | - | 0 | 0 | 0 |
| EP/8% CS | 25 | 6.5 | - | 0 | 2.74 | 0 |
| EP/8% DOPO | 25 | 6.5 | - | 2.74 | 0 | 0.54 |
| EP/8% CS1/DOPO1 | 25 | 6.5 | 1:1 | 1.37 | 1.37 | 0.27 |
| EP/8% CS1/DOPO2 | 25 | 6.5 | 1:2 | 0.91 | 1.83 | 0.36 |
| EP/8% CS2/DOPO1 | 25 | 6.5 | 2:1 | 1.83 | 0.91 | 0.18 |
| EP/8% CS1/DOPO3 | 25 | 6.5 | 1:3 | 0.69 | 2.05 | 0.41 |
| EP/8% CS3/DOPO1 | 25 | 6.5 | 3:1 | 2.05 | 0.69 | 0.14 |
| EP/10% CS | 25 | 6.5 | - | 3.5 | 0 | 0 |
| EP/10% DOPO | 25 | 6.5 | - | 0 | 3.5 | 0.68 |
| EP/10% CS1/DOPO1 | 25 | 6.5 | 1:1 | 1.75 | 1.75 | 0.34 |
| EP/10% CS1/DOPO2 | 25 | 6.5 | 1:2 | 1.17 | 2.33 | 0.46 |
| EP/10% CS2/DOPO1 | 25 | 6.5 | 2:1 | 2.33 | 1.17 | 0.23 |
| EP/10% CS1/DOPO3 | 25 | 6.5 | 1:3 | 0.87 | 2.63 | 0.51 |
| EP/10% CS3/DOPO1 | 25 | 6.5 | 3:1 | 2.63 | 0.87 | 0.22 |
2.3. Methods
Differential scanning calorimeter (DSC) spectra were obtained by a TA Q10 DSC instrument to investigate the glass transition temperature (Tg) of the modified EPs. The Tg of epoxy thermosets samples were determined by heating from 40 ℃ to 200 ℃ at a heating rate of 10 ℃/min.
Thermogravimetric analysis was recorded with a thermal analyzer (TGA, TGA/DSC3+, Switzerland). The test was conducted by heating from 30°C to 790°C under nitrogen and air. The heating rate was 10 ℃/min.
Dynamic mechanical analysis (DMA) was performed on specimens with a size of 60 mm × 10 mm × 4 mm, in a three-point bending model by using a TA DMA850 apparatus (TA, USA). The heating frequency was 5 ℃/min, the oscillation amplitude was 10 µm, and the constant frequency was 1.0 HZ.
The LOI value was obtained on an HC-2C oxygen index instrument with sheet dimensions of 130 × 6.5 × 3.2 mm3. The UL-94 rating was measured with sheet dimensions of 130 × 13 × 3.2 mm3. The cone calorimeter (CC) tests were conducted following the standard ISO 5660 with sheet dimensions of 100 × 100 × 3.2 mm3 under an external heat flux of 50 kW/m2.
Scanning Electron Microscopy (SEM) and Energy Dispersive X-ray spectroscopy (EDX) were used to determine the sample morphologies and elemental distribution throughout the sample granules, respectively. The JEOL model JSM-5900LV SEM was applied to determine morphologies of char residuals. EDX was performed using Link Isis series 300 program to determine various elements distribution as a density mapping of the specified element.
FTIR spectra of the char residues for EPs were recorded on a Thermo Nicolet 5700 FTIR spectrophotometer using the KBr disk in a wavenumber range of 4000 - 400 cm−1.
X-ray photoelectron spectra (ESCALAB 250xi, US) of the char residues after cone calorimeter tests were recorded on using AlKα radiation (1486.6 eV) in ultrahigh vacuum conditions.
Raman spectroscopy (LabRAMHR800) was conducted to characterize the types of the carbon under 514 nm helium-neon laser line with wavelength range of 200-4000 cm−1.
TG-FTIR was used to analyze the FTIR spectra of the gas components from the TGA, and the real time FTIR analysis of the pyrolysis gases was conducted on a thermogravimeter (TG219 F3, Netzsch Instruments, Germany) and a Fourier transforminfrared spectrometer (Nicolet IS50, Thermo Fisher Scientific, USA.), the transfer line of gases from TGA to FTIR was heated at 280 ℃. The investigation was carried out at temperatures ranging from 40 ℃ to 800 ℃.
The flexural and tensile tests of the samples were recorded on CMT4104 universal testing machine (SANS) with a dumbbell sheet dimensions of 75 × 4 ×2 mm3 and a rectangle of 80 × 10 × 4 mm3, separately, according to the standard of GB/T 9341-2008 and GB/T 1040.2-2006. Three samples were measured each time, and the average value was taken.
3.1. Thermal stability
The glass transition temperature (Tg) of the modified EPs was characterized by DSC tests. In Fig. 2, EP exhibited a high Tg value of 160.7 oC. In the all modified EPs, EP/10% CS had the highest Tg, while EP10% DOPO had the lowest one, and the Tg values of CS/DOPO modified EPs were in between the above two values. With CS/DOPO supplementation, the Tg values of EP/CS/DOPO samples were all decreased. When the mass ratios of CS to DOPO were 1 : 1, 1 : 2 and 1 : 3, respectively, equivalent to the gradual increase of DOPO content, the Tg of EPs gradually decreased. Two aspects for the decrease of Tg values were concluded: 1) stereo-hindrance of DOPO structure decreased the cross-linking density of EPs (Liu et al. 2014); 2) only part of active N-H and -OH groups in CS could act as chain extenders, leading to the decrease of the crosslinking density of EPs. Meanwhile, when the mass ratio of CS/DOPO was 1: 1, 2 : 1 and 3 : 1, the Tg of EPs were 132.8 oC, 146.8 oC and 143.7 oC, respectively. It can be seen that when the mass ratio of CS to DOPO was 2 : 1, the Tg value of EP10%CS2/DOPO1 was the highest in CS/DOPO modified EPs, indicating that the EP composite formed a relatively dense cross-linking structure with epoxy resin. This is consistent with the mechanical properties of the materials.
TGA tests were further carried out to study the thermal stability and decomposition behaviors of EP and CS / DOPO modified EP samples. Fig. 3 showed the TGA curve of EP, EP / CS, EP / DOPO, and EP / CS / DOPO samples, and the corresponding results were listed in Table 2. It can be seen from Fig. 3(a, b) that under N2 atmosphere, the initial decomposition temperature (T5%) and the maximum weight loss temperature (Tmax %) of EP were 366.6 oC and 383.8 oC, respectively. The T5% and Tmax % of EP/10% DOPO and EP/10% CS samples were 285.2 oC, 385.6 oC and 366.3 oC, 385.3 oC, respectively. The T5% of all modified EPs is higher than the curing temperature of EP ranged from 100 - 150oC, indicating that DOPO, CS or CS / DOPO can meet the solidification condition. The T5% of the other samples decreased to varying degrees, but the Tmax % of the other samples did not change much. It can be inferred that the decrease of initial decomposition temperature Tg of modified materials was attributed to the addition of DOPO. It can be seen from Fig. 3 that, unlike EP, the pyrolysis process of modified materials had two rapid weight loss stages, 240 ± 10 oC and 285 ± 5 oC, respectively. The main reasons were as follows: on one hand, the thermal decomposition temperature of CS and DOPO is lower than that of EP, it can be assigned to the preferential decompose of CS and DOPO that did not react with EP over EP/CS/DOPO materials during the heating process. On the other hand, with the loading of CS and DOPO, the epoxy groups of the EPs were correspondingly reduced, thereby reducing the crosslinking density of EP more or less. Except EP/10% DOPO, the char residues at 750°C were all higher than that of EP, indicating that these EPs had superior high temperature stability and better carbonization capacity than EP.
Simultaneously, the thermal degradation process of the modified EPs was also investigated by TGA under air atmosphere. As seen in Figure 3(c, d), the thermal decomposition process of pure EP showed two stages, which was consistent with the literature (Zhang et al. 2013). The Tmax1% in the first stage appeared at 380.4°C, and the maximum mass loss rate was 9.7 wt %·min−1, which was close to that under nitrogen (383.8°C), and both were caused by the severe thermal decomposition of epoxy resin itself. Therefore, this stage was also the main stage of the thermal weight loss of epoxy resin. The Tmax2% of the second stage appeared at 576.5°C and the maximum mass loss rate was 2.9 wt %·min−1, which corresponded to the further oxidation reaction of the carbon residue at high temperature. (Liu et al. 2006) The char residue of EP was only 0.8 wt % at 800°C, indicating that EP had poor thermal stability at high temperature in air. The thermal degradation of EP/10% CS, EP/10% DOPO, EP/10% CS1/DOPO2 and EP/10% CS2/DOPO1 also had two decomposition stages, which was basically the same as that of EP. Through the analysis of specific data in Table 2, the two-stage thermal decomposition temperature of the modified EPs decreased, which can be assigned to the early decomposition of flame retardant CS/DOPO into phosphorus-containing substances. Different from EP (αmax1 = 9.7, αmax2 = 2.9), all αmax1 of the modified EPs decreased in the first stage and αmax2 increased in the second stage, where αmax1 and αmax2 represented the first and second maximum decomposition rate, respectively. The first stage was mainly contributed to the decomposition of chitosan and DOPO, which accelerated the decomposition rate of resin matrix to carbon at low temperature, while the phosphorus-containing substances decomposed by DOPO in the second stage further promoted the carbon formation.
|
Sample |
N2 |
||
|---|---|---|---|
|
T5% (°C) |
Tmax (°C) |
Residue at 750°C (%) |
|
|
EP |
366.6 |
383.8 |
17.7 |
|
EP/10% CS |
366.3 |
385.6 |
18.9 |
|
EP/10% DOPO |
285.2 |
384.6 |
16.3 |
|
EP/10% CS1/DOPO1 |
326.6 |
382.4 |
19.7 |
|
EP/10% CS1/DOPO2 |
311.5 |
383.7 |
18.7 |
|
EP/10% CS1/DOPO3 |
305.5 |
382.2 |
19.3 |
|
EP/10% CS2/DOPO1 |
320.5 |
384.5 |
21.6 |
|
EP/10% CS3/DOPO1 |
335.8 |
381.3 |
20.2 |
Additionally, the thermodynamic properties of the materials were analyzed by dynamic thermodynamics (DMA). The results were shown in Figure 4 and Table 3. Tan-δ peaks of different materials were obtained from Fig. 4a, namely, the glass transition temperatures (Tg) of EP, EP/10% CS2/DOPO1 and EP/10% CS1/DOPO2 were 161.5 ℃, 147.1 ℃ and 135.7 ℃, respectively, which were basically consistent with the Tg obtained in DSC tests. The results showed that when a certain mass of CS/DOPO was added to the epoxy resin, the corresponding Tg decreased. The reason can be attributed to the decrease of the number of epoxy groups in epoxy resin due to the addition of CS/DOPO and space steric hindrance formed by DOPO, which reduced the ring-opening crosslinking of DDM and epoxy resin. The magnitude of storage modulus at Tg + 30 ℃ was E'EP/10% CS1/DOPO2 < E'EP < E'EP/10% CS2/DOPO1, indicating that the mass ratio of CS/DOPO affected E' greatly. The higher E' value of EP/10% CS2/DOPO1 was attributed to the fact that the higher CS content in EP can provide more active hydroxyl and -NH- groups to participate in the ring-opening reaction of EP, increasing the flexibility of EPs. Inversely, with the increase of DOPO content in EP, the low reactivity and rigid structure of DOPO will reduce the mobility of the chain in EP, thereby reducing the flexibility of EP materials (Xu et al. 2018). The above analyses were consistence with the crosslink density magnitude of the samples. Fig. 4b showed that the magnitude order of the storage modulus was E'EP < E'EP/10%CS1/DOPO2 < E'EP/10% CS2/DOPO1 in the temperature range of 65 – 120 ℃, and the storage modulus of the CS/DOPO modified EP samples below 120 ℃ was much greater than that of pure EP. The higher storage modulus was corresponding to the higher resistant ability to deformation of the materials. Moreover, it is generally believed that higher E′′ means higher damping energy dissipation in polymer networks, which is beneficial for the transformation of the potentially damageable vibration energy to heat. As seen in Fig. 4c, below 69 ℃, the values of E′′ of two modified Eps were lower than that of EP, and the E′′ of EP/10% CS2/DOPO1 was higher than that of EP/10% CS1/DOPO2, indicating that the increase of CS content in biomass polymer contributed to the movement of polymer chains and increased crosslink density (Jian et al. 2017).
|
Samples |
Storage modulus at 50°C (MPa) |
Tg (oC) |
Tan δ |
E' (Tg+30K) MPa |
νea (mol/m3) |
|---|---|---|---|---|---|
|
EP |
1305.5 |
161.5 |
0.71 |
27.1 |
2258.3 |
|
EP/10% CS1/DOPO2 |
2050.1 |
135.7 |
0.81 |
19.1 |
1752.3 |
|
EP/10% CS2/DOPO1 |
2004.9 |
147.1 |
0.88 |
31.5 |
2863.6 |
| a νe = E'/3RT; E' equals to the storage modulus corresponding to T taken as 30°C above Tg; R is the gas constant. | |||||
3.2. Flame retardance of EP composites
3.2.1 UL-94 tests and LOI
UL-94 rating of the EPs is determined by the length of combustion times and burning dripping at self-extinguishing (Wang et al. 2009). Limiting oxygen index (LOI) refers to the minimum oxygen concentration (volume percentage) that supports the combustion of materials. The test results of flame retardancy of EPs studied by LOI and UL-94 vertical combustion tests were summarized in Table 4. As can be seen from Table 4, all the modified EPs did not obtain V-0 rating when the total addition amount was 8%. However, when the total addition was 10%, EP/10% DOPO modified EPs passed the V-0 rating. Interestingly, when the mass ratio of CS / DOPO was 1 : 2 or 2 : 1, the modified EPs passed the V-0 rating, but the other mass ratio of CS / DOPO modified EPs only obtained the V-1 or V-2 rating. It indicated that under the premise of a certain total amount of addition with the mass ratio of 1 : 2 or 2 : 1, the synergistic effect of CS and DOPO on EPs was prominent. For LOI tests, the LOI value of EP sample was 22.6%, however, with the incorporation of CS or/and DOPO, there was a improvement on LOI values, especially with the incorporation of CS and DOPO both, the increase of LOI value was considerable. The value of EP/10% CS1/DOPO2 and EP/10% CS2/DOPO1 samples reached up to 35.1% and 34.3%, respectively, and simultaneously obtained V-0 rating. According to the analyses above, it was concluded that when the total addition amount was 10% and the mass ratios of CS and DOPO were 1 : 2 and 2 : 1, EP can be endowed with good flame retardancy.
|
Samples |
EP |
DDM |
CS/DOPO |
CS |
DOPO |
LOI |
UL-94 |
|
|---|---|---|---|---|---|---|---|---|
|
(g) |
(g) |
(wt/wt) |
(g) |
(g) |
(%)(±0.3%) |
Dripping |
Rating |
|
|
EP |
25 |
6.5 |
- |
0 |
0 |
22.6 |
Y |
None |
|
EP/8% CS |
25 |
6.5 |
- |
2.74 |
0 |
24.4 |
N |
None |
|
EP/8% DOPO |
25 |
6.5 |
- |
0 |
2.74 |
34.2 |
N |
V-1 |
|
EP/8% CS1/DOPO1 |
25 |
6.5 |
1:1 |
1.37 |
1.37 |
31.3 |
N |
V-2 |
|
EP/8% CS1/DOPO2 |
25 |
6.5 |
1:2 |
0.91 |
1.83 |
35.1 |
N |
V-1 |
|
EP/8% CS2/DOPO1 |
25 |
6.5 |
2:1 |
1.83 |
0.91 |
34.3 |
N |
V-1 |
|
EP/8% CS1/DOPO3 |
25 |
6.5 |
1:3 |
0.69 |
2.05 |
34.8 |
N |
V-1 |
|
EP/8% CS3/DOPO1 |
25 |
6.5 |
3:1 |
2.05 |
0.69 |
32.6 |
N |
V-1 |
|
EP/10% CS |
25 |
6.5 |
- |
3.5 |
0 |
23.3 |
N |
None |
|
EP/10% DOPO |
25 |
6.5 |
- |
0 |
3.5 |
30.5 |
N |
V-0 |
|
EP/10% CS1/DOPO1 |
25 |
6.5 |
1:1 |
1.75 |
1.75 |
32.8 |
N |
V-2 |
|
EP/10% CS1/DOPO2 |
25 |
6.5 |
1:2 |
1.17 |
2.33 |
33.7 |
N |
V-0 |
|
EP/10% CS2/DOPO1 |
25 |
6.5 |
2:1 |
2.33 |
1.17 |
32.5 |
N |
V-0 |
|
EP/10% CS1/DOPO3 |
25 |
6.5 |
1:3 |
0.87 |
2.63 |
34.8 |
N |
V-1 |
|
EP/10% CS3/DOPO1 |
25 |
6.5 |
3:1 |
2.63 |
0.87 |
30.2 |
N |
V-1 |
3.2.2 Cone calorimeter
CC tests, as one of the most effective bench-scale methods, were employed to assess the combustion behavior of materials. Various parameters can be obtained from the CC tests, some representative data were presented in Table 5 and the curves were illustrated in Fig. 5. As can be seen, the time for ignitions (TTI) of EP/10% CS1/DOPO2 and EP/10% CS2/DOPO1 was longer than that of EP consistently. Mainly due to the presence of unreacted CS and DOPO with EP, the EP composites with CS/DOPO additives would preferentially decompose into non-combustible gases, such as H2O, NH3, CO2 and N2, diluting the combustible gases on the surface of the material in combustion. Comparison with EP, the PHRR and THR values of EP/10% CS1/DOPO2 and EP/10% CS2/DOPO1 decreased, indicating that CS/DOPO increased flame retardancy of EP. FIGRA (Fire index growth rate), defined as PHRR/tP, as an important parameter for evaluating fire hazard, is calculated by the maximum value of HRR/t and always equal to PHRR/tp, which can estimate both the fire spread rate and fire scale. The lower the value of FIGRA can be considered the slower the flame spread and flame growth. It can be seen from Table 5 that the FIGRA values of EP/10% CS1/DOPO2 and EP/10% CS2/DOPO1 were significantly lower than that of EP, indicating that the CS / DOPO could reduce fire hazard. In addition, it is worth noting that the PHRR, THRP and SPR values of the two modified EPs were smaller than those of EP, especially, TSP decreased by 61.5% and 70.9%, indicating that the CS / DOPO can not only reduce heat release, but also greatly enhance the smoke inhibition of EP. The possible reason was that the CS/DOPO formed a stable and dense carbon layer during combustion, which hindered the heat transfer inside the samples during ignition and reduced the flue gas release, thus achieving the quenching effect. In terms of reducing heat release, EP/10% CS1/DOPO2 had better performance. The av-EHC value of EP was 29.3 MJ·kg−1, while the av-EHC values of EP/10% CS1/DOPO2 and EP/10% CS2/DOPO1 were decreased by 27.6% and 0.7%, respectively, indicating that the gas phase flame retardancy effect was more obvious when the mass ratio of CS and DOPO was 1:2. Moreover, compared with EP, the average CO2 yield decreased by 55.4% for EP/10% CS1/DOPO2 and 55.0% for EP/10% CS2/DOPO1, while the relative average CO yield only increased by 6% and 9%, respectively. The results indicated that the complete combustion degree of the modified EPs significantly reduced. The reason for the good flame retardancy of EP composites with 10% CS/DOPO additives can be explained according to the individual and synergistic functions of CS or DOPO with the same amount in the EP. It can be seen from Table 5 that EP/10% DOPO had the lowest PHRR and FIGRA values and the highest TTI value among the four samples, indicating good fire resistance. However, PSPR, TSP and av-COY values of EP/10% DOPO were the highest ones except pure EP, revealing poor smoke suppression performance. As for EP/10% CS, it exhibited the lowest PSPR and av-COY values and the highest THR and av-EHC values among the four samples, revealing better smoke suppression performance and worse heat resistance. The reverse behaviors of EP/10% CS and EP/10% DOPO endow the 10% CS/DOPO modified EP composites with good performance in almost all parameters related to the evaluation of flame retardancy. It can be contributed to the synergistic effect of CS and DOPO on EP.
Furthermore, the flame retardancy related to flame inhibition, charring, and formation of a protective barrier layer were quantify according to the calculation method reported in the literature (Tang et al. 2017). The values of the three main modes of action can be obtained from the following equations (1)-(3) and were summarized in Table S1. A significant improvement in the flame-inhibition effect 27.60% was obtained when the addition amount of CS and DOPO was 10% with the mass ratio of CS and DOPO of 1 : 2. The reason can be contributed to the obvious quenching effect caused by more PO· free radicals released during thermal decomposition by adding more DOPO. Both EP/10% CS1/DOPO2 and EP/10% CS2/DOPO1 exhibited higher barrier and protection effects, which were 20.36% and 36.52%. The better barrier and protection effects of the latter was due to the higher content of CS in it, it was also the reason why EP/10% CS2/DOPO1 can achieve V-0 rating in the UL-94 tests.

Table 5
The CC test results of EP and its flame-retardant EP samples
|
Sample |
EP |
EP/10% CS |
EP/10% DOPO |
EP/10% CS1/DOPO2 |
EP/10% CS2/DOPO1 |
|---|---|---|---|---|---|
|
Time for ignitions(s) (TTI) (s) |
59.0±2 |
46±2 |
96±2 |
81.0±2 |
87.0±2 |
|
Time to peaks (s) tp (s) |
130±3 |
105±2 |
150±2 |
130.0±3 |
130.0±3 |
|
Peak heat release rate (PHRR) (KW·m−2) |
1063.1±45 |
999.8±45 |
718.3±45 |
791.9±45 |
770.4±45 |
|
Fire growth rate index (FIGRA) |
8.2 |
9.5 |
4.8 |
6.1 |
5.9 |
|
Peak smoke produce rate (PSPR) (m2·s−1) |
0.55±0.1 |
0.24±0.1 |
0.41±0.1 |
0.39±0.1 |
0.31±0.1 |
|
Total smoke release (TSP) (m2) |
70.53±3 |
23.66±3 |
29.53±3 |
27.18±3 |
20.56±3 |
|
Total heat release (THR) (MJ·m−2) |
94.85±5 |
99.23±5 |
92.10±5 |
69.73±5 |
85.44±5 |
|
Average effective heat of combustion (av-EHC) (MJ·kg−1) |
29.3±0.5 |
36.8±0.5 |
24.2±0.5 |
21.2±0.5 |
29.1±0.5 |
|
Average CO yield (av-COY) (kg·kg−1) |
0.33±0.1 |
0.19±0.1 |
0.38±0.1 |
0.35±0.1 |
0.36±0.1 |
|
Average CO2 yield (av-CO2Y) (kg·kg−1) |
7.38±1 |
5.26±1 |
3.97±1 |
3.29±1 |
3.32±1 |
|
Char residue (%) |
8.9 |
14.1 |
14.3 |
16.4 |
12.6 |
|
Total mass loss (TML) (%) |
91.1 |
85.9 |
85.7 |
83.6 |
87.4 |
3.3. Flame-retardant mechanism
3.3.1 Char residues analyses after CC tests
To disclose the flame-retardant mechanism in the condensed phase, the element composition, chemical structure and morphology of char residues surface were investigated by EDX, FTIR, Raman and SEM. Firstly, the elemental composition of the surface of the char residuals without crushing was studied, the results were shown in Fig. S1. In the char residue of EP/10% CS1/DOPO2, the content of carbon decreased and the content of oxygen and phosphorus increased significantly in comparison with EP, indicating that there were a large number of phosphorus-containing oxides on the surface of residual carbon. For the char residue of EP/10% CS2/DOPO1, the carbon content increased, and the content of oxygen and phosphorus was lower than those in EP/10% CS1/DOPO2, indicating that the formed char residual in the former contained more graphitized carbon than the latter, which was consistent with the results of Raman. By enlarging EDX elemental mapping images, it was found that a small amount of N atoms were dispersed in all samples. To further illustrate the changes of N atoms before and after CC tests, the N contents in the fresh EP/10% CS1/DOPO2 and EP/10% CS2/DOPO1 were calculated according to the components and relative N contents, they were 2.90% and 3.17%, respectively. The N contents in the char residues of EP/10% CS1/DOPO2 and EP/10% CS2/DOPO1 can be seen relatively lower than those of P atoms. Considering that P contents were found very low, so, the N atoms must be much lower than those of P atoms, which was why EDX did not give their content.
Further EDX elemental mapping analysis was conducted on the cross-section of char residual, and the detailed distribution of elements was shown in Fig. 6. As seen in Fig. 6, all elements except carbon were increased and distributed evenly. That proved the presence of carbon, nitrogen and oxygen in the chars of EPs. In addition, it can be seen that phosphorus elements were evenly distributed in the char residuals of EP/10% CS1/DOPO2 and EP/10% CS2/DOPO1, and these phosphorus-containing substances prevented the heat release and oxygen entry.
Figure 7 showed the digital and SEM images of char residues after CC tests. As shown in Figure 7 (a1-a4), the char residuals of EP showed that there was only a small amount of char residuals left on the margin of the base plate, along with a large amount holes in its microstructure, which did not have the ability to protect the matrix from combustion. While the char residuals of EP/10% CS1/DOPO2 and EP/10% CS2/DOPO1 increased by 84.3% and 41.6% when compared with EP, respectively, and exhibited more uniform carbon layer with relatively smaller holes in the microstructure. In addition, the carbon layer of EP was discontinuous and loose, while the carbon layer of the modified EPs showed a more continuous and dense structure. The dense carbon layer can be used as a protective layer to prevent the continuous combustion of the matrix. At the same time, the char residuals particles of EP were a dispersion state, while the char residuals particles of modified EPs had good agglomeration. The agglomeration of char residuals of EP/10% CS2/DOPO1 was more obvious among them.
It is known that the barrier effect of condensed phase is not only affected by its quantity, but also closely related to its structure. Raman spectroscopy is an effective technique for analyzing the internal structure of carbonaceous materials after combustion. As shown in Fig. 8, two remarkable peaks at 1360 and 1590 cm−1 in all spectra are belong to D band (vibrations of amorphous carbon atoms) and G band (vibration of sp2 −hybridized carbon atoms), respectively. Generally, the ratio of the integrated intensities of D to G band (ID / IG) is usually used to measure the degree of graphitization (Ai et al. 2018). The lower the ID/IG value, the higher the graphitization degree and the better the flame retardancy. As seen, the values of ID/IG follow the sequence of EP (3.93) > EP/10% CS1/DOPO2 (2.88) > EP/10% CS2/DOPO1 (2.65), indicating that the graphitization degree of modified EPs had significantly increased. This denser char layer can better hinder the escape of flammable gases and entrance of oxygen in the condensed phase during combustion, thus protecting the inner materials from further decomposition.
The chemical structure of char residual was studied by FTIR. As shown in Fig. 9, the main absorption peaks were observed at 2927 cm−1, 1607 cm−1 and 1080 cm−1, which belonged to the vibration of aromatic rings (Li and Yang 2014). By comparison with EP, the new peaks at 1236 and 1040 cm−1 were attributed to the stretching vibration of P=O and P-O-C, and the absorption peaks of C-P and phenol were observed at 1510 and 754 cm−1, respectively (Zhang et al. 2012a; Yang et al. 2016). The above results showed that the char residue was mainly composed of graphite-like compounds and organic phosphorus compounds.
Simultaneously, the chemical compositions of char residues for EP, EP/10% CS1/DOPO2 and EP/10% CS2/DOPO1 after CC test were further analyzed by XPS. The XPS spectra and the atom percent of C1s, N1s, O1s and P2s for the char residues of EPs were shown in Fig. 10 and Table S2, respectively. In the C1s spectrum, there were three kinds of carbon binding states in the three samples, among which the peak at 289.7 eV belongs to C=C and C=O bonds, the peak at 285.8 eV belongs to C-O and C-N bonds, and the peak at 284.7 eV belongs to C-H and C-C bonds in alipha FIGRA tic and aromatic components (Li et al. 2019; Cao et al. 2022). Moreover, it can be clearly seen that the peak at 285.8 eV of the two modified EPs increased compared with EP, suggesting that more cross-linked carbon composed of C-O and C-N was formed in the residual carbon. In the N1s spectrum, all three samples presented two peaks at 400.3 eV and 398.7 eV, wherein the former was the contribution of N-H bond, and the latter was assigned to C-N bond (Wang et al. 2010). In the O1s spectrum, similarly, all three samples had peaks at 533.3 eV and 532.3 eV, the former was attributed to the C-OH and C-O-C groups and the latter belonged to C=O (Zhang et al. 2012b; Wu et al. 2022). However, the modified EPs both had a larger peak at 533.3 eV than that of EP, which was due to the formation of C-O-P or C-O-C, P-O-P groups in the char residues of the modified EPs. In the P2s spectrum, there were two new peaks, 134.4 eV and 133.3 eV in the char residues of modified EPs (Huang et al. 2018; Sun et al. 2016), which assigned to P-O-P, P-O-C and/or PO3− group in phosphate. This further indicated the formation of phosphate-containing compounds in the char residuals, which were covered on the surface of the materials and prevented the further combustion.
3.3.2 TG-FTIR analysis of EP and modified EPs samples
In order to evaluate comprehensively the influence of the CS / DOPO on the thermal stability of EP composites, TG-FTIR spectra were applied to further disclose the decomposition behavior of the modified EPs under programmed heating process. The detailed characteristics of each TG-FTIR spectrum for EP, EP/10% CS1/DOPO2 and EP/10% CS2/DOPO1 obtained at 100 ℃, 200 ℃, 300 ℃, 400 ℃, 500 ℃, 600 ℃, 700 ℃ and 800 ℃ were shown in Fig. 10. The 3D TG-FTIR images of EP, EP/10% CS1/DOPO2 and EP/10% CS2/DOPO1 at various temperatures were shown in Fig. S2. It can be seen that the peaks of EP between 2250 cm−1 and 2500 cm−1 attributed to CO2 in EP were much stronger than other samples, indicating that epoxy produced more CO2 than other three samples. The absorption peak of phosphorus-containing substances can be clearly observed in EP/10% CS1/DOPO2 and EP/10% CS2/DOPO1.
As shown in Fig. 11, all EPs exhibited the characteristic absorption peaks of nonflammable gases, such as H2O and CO2, which could be demonstrated by the broad bands at 3500-4000 and 2300-2390 cm−1, respectively (Wang et al. 2011a; Wen et al. 2018). It can be seen that in terms of carbon dioxide release, EP released the most. Compared with EP/10% CS1/DOPO2, EP/10% CS2/DOPO1 released more CO2, which was coincided with the results of CC tests. Furthermore, hydrocarbons can be clearly identified at the broad bands at 600-700 cm−1, 1100-1500 cm−1, and 2900-3100 cm−1 between 400°C and 800°C, as the peak at about 661 cm−1 attributed to =CH- bonds, peaks at 1180 cm−1, 1460 cm−1 and 2972 cm−1 belonged to the -CH3 bonds, the peak at 2927 cm−1 was assigned to -CH2- bonds (Wang et al. 2011b; Wu et al. 2011). In addition, some sharp peaks appeared in the range of 1550-1800 cm−1, which might be carbonyl-containing compounds such as carboxylic acids (1706 cm−1), ketones (1720 cm−1) and aldehydes (1738 cm−1) (Yan et al. 2018).
Significant difference was observed compared to EP and EP/10% CS. As shown in Fig. 11, the peak at about 1129 cm−1 for EP/10% CS1/DOPO2 and EP/10% CS2/DOPO1 was attributed to the Ph-P bond (Xu et al. 2016). Moreover, the peak at about 1260 cm−1 assigned to the stretching vibration of P=O, which was probably overlapped with the characteristic absorbance of ether bonds. A weak absorption peak at 1642 cm−1 was the stretching vibration of P-OH (Yuan et al. 2018). On the basis of the analysis above, a variety of phosphorus-containing compounds were generated during the thermal decomposition process of the modified EPs, which can increase the flame retardancy of EP significantly. It is worth noting that compared with EP/10% CS1/DOPO2, most of the absorption peaks of nonflammable gas for EP/10% CS2/DOPO1 were larger, so it was speculated that EP/10% CS2/DOPO1 was mainly gas-phase flame retardancy while EP/10% CS1/DOPO2 was mainly condensed-phase flame retardancy, which was consistent with the results of CC tests.
In order to explore the time when these EPs began to decompose into gas in the process of thermal decomposition, the curves were made with time as abscissa and infrared absorption intensity as ordinate, simultaneously the first derivative curve was drawn. As seen in the Fig. S3, the pyrolysis products of EP began to release at approximately 31.2 min. Surprisingly, the time of EP/10% CS1/DOPO2 and EP/10% CS2/DOPO1 began to release pyrolysis products almost identical, which were 30.3 min and 30.2 min, respectively, a little less than that of EP. The results showed that the thermal stability of the modified EPs slightly decreased after adding CS / DOPO, which was consistent with the test results of Tg and TGA.
3.4 Mechanical properties
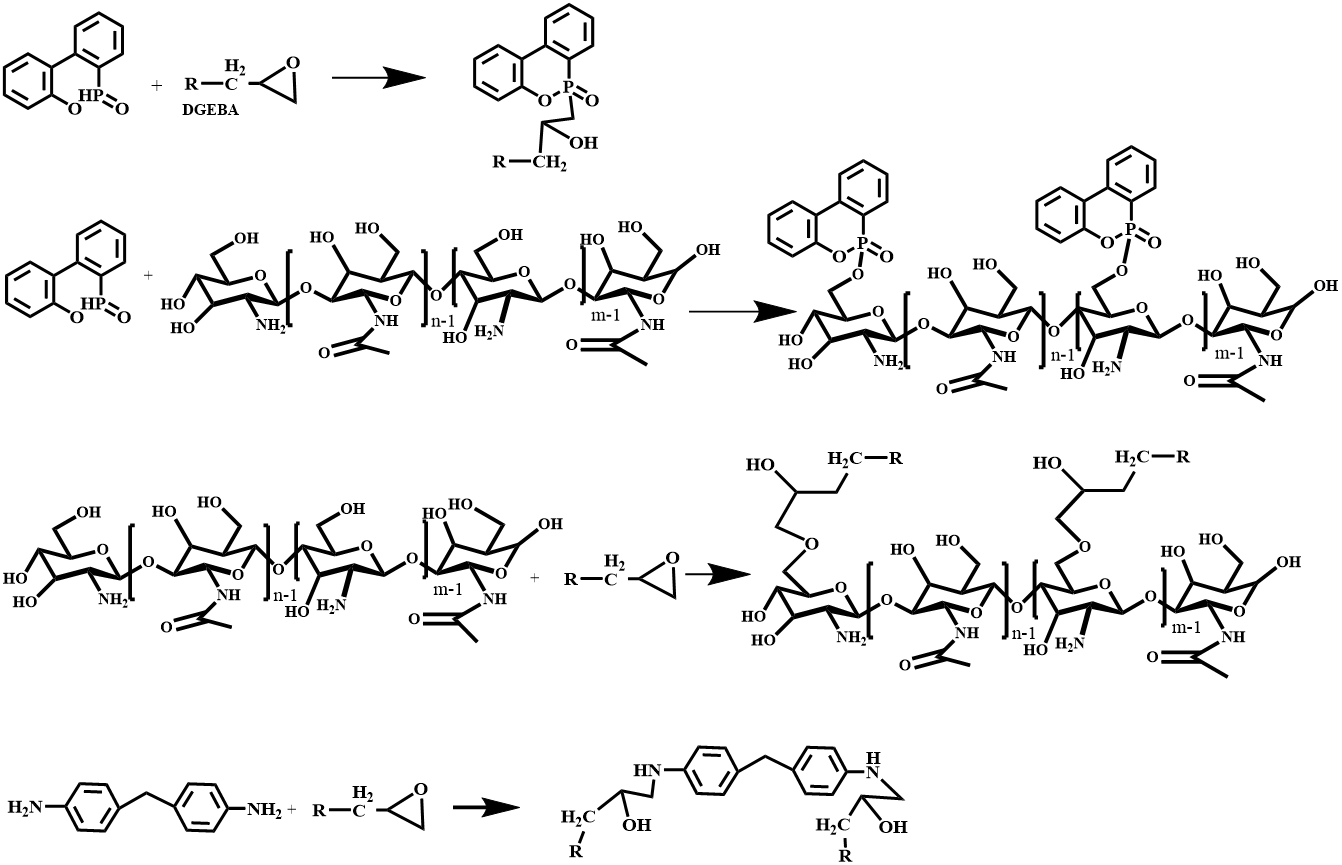
The mechanical properties of materials are important in some areas, so it is necessary to study the mechanical properties of modified EPs. The mechanical properties were analyzed from three indexes: tensile strength, flexural strength and izod impact strength. The results were summarized in Fig. 12. As can be seen from the figure that the tensile strength, flexural strength and izod impact strength of EP were 54 MPa, 86 MPa and 21 KJ·m−2, respectively. Compared with EP, the tensile strength, the flexural strengths of EP/10% CS and EP/10% DOPO increased by 2.3% and 7.0%, while, EP/10% CS1/DOPO2 and EP/10% CS2/DOPO1 increased by 36.0% and 38.4%, respectively. The flexural strength of CS/DOPO modified EP was significantly higher than those of EP/10% CS and EP/10% DOPO under the same addition amount in EP, which can be contributed to the synergistic effect of CS and DOPO in EP when the mass ratio was 1 : 2 or 2 : 1. The main reason was that there were -NH2 and -OH active groups in CS and P-H active bonds in DOPO. On the one hand, -NH2 and -OH groups would form intramolecular and intermolecular hydrogen bonds, increasing the compatibility of CS and DOPO with EP. On the other hand, these active groups would react with epoxy groups in EP to undergo ring-opening reaction, which enhanced the formation of cross-linking network in the curing process (Luo et al. 2021). What’s more, the π-π stacking among the aromatic rings were also conducive to improving its mechanical strength (Ma et al. 2021). The possible chemical reactions were shown in Scheme 1.
In this work, biomass and DOPO were directly used to modify the EP by a solution blending method. The results showed that the flame retardancy of EP was improved by adding CS/DOPO, especially when the total amount of CS/DOPO was 10% and the mass ratios of CS and DOPO were 1:2 and 2:1, both modified EPs obtained V-0 rating, and LOI increased from 22.6% for EP to 33.7% and 32.5%, respectively. Meanwhile, the PHRR, THR, PSPR and TSP values of EP/10% CS1/DOPO2 and EP/10% CS2/DOPO1 decreased greatly, indicating it was very efficiency for simply mixing the functional materials. In comparison with each other, EP/10% CS1/DOPO2 and EP/10% CS2/DOPO1 exhibited the flame retardancy in both gas phase and condensed phase, respectively. The general flame retardant mechanism was summarized as follows according to the results of CC, FTIR, SEM, EDX, TG-FTIR, etc. 1) part of DOPO and CS that didn’t involve in curing process was preferentially decomposed into some non-combustible gases such as CO2 and NH3 during the early stage of combustion, diluting the combustible gases; 2) DOPO released P-containing radicals during the pyrolysis process, which helped to capture free radicals of chain reaction; 3) the obstructing function on heat transfer of the dense char residue. In addition, the mechanical properties of the EPs did not decrease but increased in comparison with EP, especially the flexural strength. Therefore, under the 10% total addition amount with the mass ratio of CS and DOPO of 1 : 2 or 2 : 1, the EPs were endowed with good flame retardancy and mechanical properties.
Funding:
This study was funded by Hubei provincial science and technology department (2018ACA158).
Conflicts of interests:
All authors certify that they have no affiliations with or involvement in any organization or entity with any financial interest or non-financial interest in the subject matter or materials discussed in this manuscript.
Availability of data and material:
All data generated or analyzed during this study were included in this published article (and its supplementary information files).
Code availability:
No software application or custom code.
Authors' contributions:
Junjie Wang, synthesis, writing and analysis; Xinyu Wang, characterization; Chengyu Zhou, analysis; Zhiquan Pan, analysis; Hong Zhou, Design and revise of the work.
- Ai L, Chen S, Zeng J, Liu, P, Liu W, Pan Y, Liu D (2018). Synthesis and flame retardant properties of cyclophosphazene derivatives containing boron. Polym Degrad Stabil 155: 250-261. doi:10.1016/j.polymdegradstab.2018.07.026
- Ai YF, Xia L, Pang FQ, Xu YL, Zhao HB, Jian RK Yuanfang A, Long X, Fuqu P, Yanlian X, Haibo Z, Rongkun J (2020) Mechanically strong and flame-retardant epoxy resins with anti-corrosion performance. Compos Part B-Eng 193: 108019. doi:10.1016/j.compositesb.2020.108019
- Chen XL, Liu L, Jiao CM (2015) Influence of Iron Oxide Brown on Smoke-Suppression Properties and Combustion Behavior of Intumescent Flame-Retardant Epoxy Composites. Adv Polym Tech 34(4): 21516. doi:10.1002/adv.21516
- Chen R, Luo ZJ, Yu XJ, Tang H, Zhou Y, Zhou H (2020) Synthesis of chitosan-based flame retardant and its fire resistance in epoxy resin. Carbohyd Polym 245: 116530. doi:10.1016/j.carbpol.2020.116530
- Cao CF, Yu B, Guo BF, Hu WJ, Sun FN, Zhang ZH, Li SN, Wu W, Tang LC, Song PA, Wang H (2022) Bio-inspired, sustainable and mechanically robust graphene oxide-based hybrid networks for efficient fire protection and warning. Chem Eng J. 134516. doi.org/10.1016/j.cej.2022.134516
- Goda ES, Elella MHA, Hong SE, Pandit B, Yoon KR, Gamal H (2021) Smart flame retardant coating containing carboxymethyl chitosan nanoparticles decorated graphene for obtaining multifunctional textiles. Cellulose 28(8): 5087-5105. doi: 10.1007/s10570-021-03833-7
- Hoqani HASA, AL-Shaqsi N, Hossaina MA, Sibani MAA (2020) Isolation and optimization of the method for industrial production of chitin and chitosan from Omani shrimp shell. Carbohyd Res 492: 108001. doi:10.1016/j.carres.2020.108001
- Huang HW, Dong DX, Li WJ, Zhang XY, Zhang L, Chen Y, Sheng XX, Lu X (2020) Synergistic effect of MXene on the flame retardancy and thermal degradation of intumescent flame retardant biodegradable poly (lactic acid) composites. Chinese J Chem Eng 28: 1981-1993. doi:10.1016/j.cjche.2020.04.014
- Huang WJ, He WT, Long J, Yan W, He M, Qin SH, Yu J (2018) Highly efficient flame-retardant glass-fiber-reinforced polyamide 6T system based on a novel DOPO-based derivative: Flame retardancy, thermal decomposition, and pyrolysis behavior. Polym Degrad Stabil 148: 26-41. doi:10.1016/j.polymdegradstab.2018.01.008
- Jian RK, Wang P, Xia L, Zheng XL (2017) Effect of a novel P/N/S-containing reactive flame retardant on curing behavior, thermal and flame-retardant properties of epoxy resin. J Anal Appl Pyrol 127: 360-369. doi:10.1016/j.jaap.2017.07.014
- Kandola BK, Biswas B, Price D, Horrocks AR (2010) Studies on the effect of different levels of toughener and flame retardants on thermal stability of epoxy resin. Polym Degrad Stabil 95(2): 144-152. doi:10.1016/j.polymdegradstab.2009.11.040
- Kim UJ, Kim HJ, Choi JW, Kimura S, Wada M (2017) Cellulose-chitosan beads crosslinked by dialdehyde cellulose. Cellulose 24(12): 5517-5528. doi:10.1007/s10570-017-1528-y
- Liu L, Chen XL, Jiao CM (2015) Influence of ferrocene on smoke suppression properties and combustion behavior of intumescent flame-retardant epoxy composites. J Therm Anal Calorim 122(1): 437-447. doi:10.1007/s10973-015-4928-y
- Li LY, Chen GH, Liu W, Li JF, Zhang S (2009) The anti-dripping intumescent flame retardant finishing for nylon-6,6 fabric. Polym Degrad Stabil 94(6): 996-1000. doi:10.1016/j.polymdegradstab.2009.02.009
- Liu YF, Du ZJ, Zhang C, Li HQ (2006) Thermal Degradation of Bisphenol A Type Novolac Epoxy Resin Cured with 4,4′-Diaminodiphenyl Sulfone. Int J Polym Anal Ch 11(4): 299-315. doi:10.1080/10236660600750224
- Liu YL, He JY, Yang RJ (2016) The Thermal Properties and Flame Retardancy of 9,10-Dihydro-9-oxa-10-phosphaphenanthrene 10-Oxide (DOPO)-Mg/Polyisocyanurate-Polyurethane Foam Composites. B Chem Soc Jpn 89(7): 779-785. doi:10.1246/bcsj.20160064
- Luo Y, Wang S, Du X, Du Z, Cheng X,Wang H (2021) Durable flame retardant and water repellent cotton fabric based on synergistic effect of ferrocene and DOPO. Cellulose 28(3):1809-1826. doi:10.1007/s10570-020-03636-2
- Li JL, Wang C, Lu KY (2019) Enhanced cryogenic mechanical properties and liquid oxygen compatibility of DOPO-containing epoxy resin reinforced by epoxy-grafted polysiloxane. Polym Bull 77(7): 3429-3442. doi:10.1007/s00289-019-02931-8
- Liu H, Wang XD, Wu DZ (2014) Novel cyclotriphosphazene-based epoxy compound and its application in halogen-free epoxy thermosetting systems: Synthesis, curing behaviors, and flame retardancy. Polym Degrad Stabil 103: 96-112. doi: 10.1016/j.polymdegradstab.2013.02.008
- Li ZQ, Yang RJ (2014) Study of the synergistic effect of polyhedral oligomeric octadiphenylsulfonylsilsesquioxane and 9,10-dihydro-9-oxa-10-phosphaphenanthrene-10-oxide on flame-retarded epoxy resins. Polym Degrad Stabil 109: 233-239. doi:10.1016/j.polymdegradstab.2014.07.024
- Lai XJ, Zeng XR, Li HQ, Liao F, Yin CY, Zhang HL (2011) Synergistic Effect of Phosphorus-Containing Montmorillonite with Intumescent Flame Retardant in Polypropylene. J Macromol Sci B 51(6): 1186-1198. doi:10.1080/00222348.2011.625909
- Ma ZW, Liu XC, Xu XD, Liu L, Yu B, Maluk C, Huang GB, Wang H, Song PA (2021) Bioinspired, Highly Adhesive, Nanostructured Polymeric Coatings for Superhydrophobic Fire-Extinguishing Thermal Insulation Foam. ACS Nano 15: 11667-11680. doi.org/10.1021/acsnano.1c02254
- Netkueakul W, Fischer B, Walder C, Nüesch F, Rees M, Jovic M, Gaan S, Jacob P, Wang J (2020) Effects of Combining Graphene Nanoplatelet and Phosphorous Flame Retardant as Additives on Mechanical Properties and Flame Retardancy of Epoxy Nanocomposite. Polymers-Basel 12(10): 2349. doi:10.3390/polym12102349
- Pan HF, Wang W, Pan Y, Zeng WR, Zhan J, Song L, Yuan Hu, Liew KM (2015) Construction of layer-by-layer assembled chitosan/titanate nanotubes based nanocoating on cotton fabrics: flame retardant performance and combustion behavior. Cellulose 22(1): 911-923. doi:10.1007/s10570-014-0536-4
- Sun F, Yu T, Hu CQ, Li Y (2016) Influence of functionalized graphene by grafted phosphorus containing flame retardant on the flammability of carbon fiber/epoxy resin (CF/ER) composite. Compos Sci Technol 136: 76-84. doi:10.1016/j.compscitech.2016.10.002
- Tang S, Qian LJ, Liu XX, Dong YP (2016) Gas-phase flame-retardant effects of a bi-group compound based on phosphaphenanthrene and triazine-trione groups in epoxy resin. Polym Degrad Stabil 133: 350-357. doi:10.1016/j.polymdegradstab.2016.09.014
- Tang S, Wachtendorf V, Klack P, Qian LJ, Dong YP, Schartel B (2017) Enhanced flame-retardant effect of a montmorillonite/phosphaphenanthrene compound in an epoxy thermoset. RSC Adv 7(2): 720-728. doi:10.1039/c6ra25070j
- Tang H, Zhu ZM, Chen R, Wang JJ, Zhou H (2019) Synthesis of DOPO‐based pyrazine derivative and its effect on flame retardancy and thermal stability of epoxy resin. Polym Advan Technol 30: 1-9. doi:10.1002/pat.4674
- Wang QF, Shi WF Qingfeng W, Wenfang S (2006) Synthesis and thermal decomposition of a novel hyperbranched polyphosphate ester used for flame retardant systems. Polym Degrad Stabil 91(6): 1289-1294. doi:10.1016/j.polymdegradstab.2005.09.001
- Wen Y, Cheng Z, Li WX, Li Z, Liao DJ, Hu XP, Pan N, Wang DY, Hull TR (2018) A novel oligomer containing DOPO and ferrocene groups: Synthesis, characterization, and its application in fire retardant epoxy resin. Polym Degrad Stabil 156(10): 111-124. doi:10.1016/j.polymdegradstab.2018.08.010
- Wang X, Hu Y, Song L, Xing WY, Lu HD (2011a) Thermal degradation mechanism of flame retarded epoxy resins with a DOPO-substitued organophosphorus oligomer by TG-FTIR and DP-MS. J Anal Appl Pyrol 92(1): 164-170. doi:10.1016/j.jaap.2011.05.006
- Wang X, Hu Y, Song L, Xing WY, Lu HD, Lv P, Jie GX (2010) Flame retardancy and thermal degradation mechanism of epoxy resin composites based on a DOPO substituted organophosphorus oligomer. Polymer 51(11): 2435-2445. doi:10.1016/j.polymer.2010.03.053
- Wang H, Li Shan, Zhu ZM, Yin XZ, Wang LX, Weng YX, Wang XY (2020) A novel DOPO-based flame retardant containing benzimidazolone structure with high charring ability towards low flammability and smoke epoxy resins. Polym Degrad Stabil 109426. doi:10.1016/j.polymdegradstab.2020.109426
- Wu K, Shen MM, Hu Y, Xing WY (2011) Thermal degradation and intumescent flame retardation of cellulose whisker/epoxy resin composite. J Therm Anal Calorim 104(3): 1083-1090. doi:10.1007/s10973-011-1380-5
- Wang X, Song L, Xing WY, Lu HD, Hu Y (2011b) A effective flame retardant for epoxy resins based on poly(DOPO substituted dihydroxyl phenyl pentaerythritol diphosphonate). Mater Chem Phys 125(3), 536-541. doi:10.1016/j.matchemphys.2010.10.020
- Wang Y, Zhang F, Chen XL, Jin Y, Zhang J (2009) Burning and dripping behaviors of polymers under the ul94 vertical burning test conditions. Fire Mater 34(4): 203-215. doi:10.1002/fam.1021
- Wu W, Zhao WJ, Gong XJ, Sun QJ, Cao XW, Su YJ, Yu B, Li RKY, Vellaisamy RAL (2022) Surface decoration of Halloysite nanotubes with POSS for fire-safe thermoplastic polyurethane nanocomposites. J Mater Sci Technol 101: 107-117. doi.org/10.1016/j.jmst.2021.05.060
- Xu YJ, Chen L, Rao WH, Qi M, Guo DM, Liao W, Wang YZ (2018) Latent Curing Epoxy System with Excellent Thermal Stability, Flame Retardance and Dielectric Property. Chem Eng J 347: 223-232. doi:10.1016/j.cej.2018.04.097
- Xu ZS, Deng N, Yan L, Chu ZY (2018) Functionalized multiwalled carbon nanotubes with monocomponent intumescent flame retardant for reducing the flammability and smoke emission characteristics of epoxy resins. Polym Advan Technol 29: 1-12. doi:10.1002/pat.4420
- Xie WQ, Huang SW, Tang DL, Liu SM, Zhao JQ (2020) Synthesis of a furfural-based DOPO-containing co-curing agent for fire-safe epoxy resins. RSC Adv 10(4): 1956-1965. doi:10.1039/c9ra06425g
- Xu MJ, Xu GR, Leng Y, Li Bin (2016) Synthesis of a novel flame retardant based on cyclotriphosphazene and DOPO groups and its application in epoxy resins. Polym Degrad Stabil 123: 105-114. doi:10.1016/j.polymdegradstab.2015.11.018
- Yuan Y, Ma C, Shi YQ, Song L, Hu Y, Hu WZ (2018) Highly-efficient reinforcement and flame retardancy of rigid polyurethane foam with phosphorus-containing additive and nitrogen-containing compound. Mater Chem Phys 211: 42-53. doi:10.1016/j.matchemphys.2018.02.007
- Yang S, Wang J, Huo SQ, Wang M, Wang JP, Zhang B (2016) Synergistic flame-retardant effect of expandable graphite and phosphorus-containing compounds for epoxy resin: Strong bonding of different carbon residues. Polym Degrad Stabil 128: 89-98. doi:10.1016/j.polymdegradstab.2016.03.017
- Yan W, Zhang MQ, Yu J, Nie SQ, Zhang DQ, Qin SH (2018) Synergistic Flame-retardant Effect of Epoxy Resin Combined with Phenethyl-bridged DOPO Derivative and Graphene Nanosheets. Chinese J Polym Sci 37: 79-88. doi:10.1007/s10118-019-2175-6
- Zou JH, Duan HJ, Chen YS, Ji S, Cao JF, Ma HR (2020) A P/N/S-containing high-efficiency flame retardant endowing epoxy resin with excellent flame retardance, mechanical properties and heat resistance. Compos Part B-Eng 199: 108228. doi:10.1016/j.compositesb.2020.108228
- Zhang X, He QL, Gu HB, Colorado HA, Wei SY, Guo ZH (2013). Flame-Retardant Electrical Conductive Nanopolymers Based on Bisphenol F Epoxy Resin Reinforced with Nano Polyanilines. ACS Appl Mater Inter 5(3): 898-910. doi:10.1021/am302563w
- Zhang WC, Li XM, Fan HB, Yang RJ (2012a) Study of the synergistic effect of silicon and phosphorus on the blowing-out effect of epoxy resin composites. Polym Degrad Stabil 97(6): 1041-1048. doi:10.1016/j.polymdegradstab.2012.03.008
- Zhang WC, Li XM, Li LM, Yang RJ (2012b) Study on mechanism of phosphorus-silicon synergistic flame retardancy on epoxy resins. Polym Degrad Stabil 97(11): 2241-2248. doi:10.1016/j.polymdegradstab.2012.08.002
Scheme 1 is available in the Supplementary Files section.
- Graphicalabstract.docx
- Highlights.docx
- SupplementaryMaterial.docx
- Scheme1.png
Scheme. 1. The possible reactions of CSA, DOPO, DDM and DGEBA in the curing process<br>