Fabrication and characterization of the MACSs
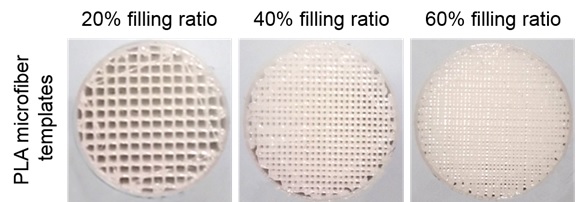
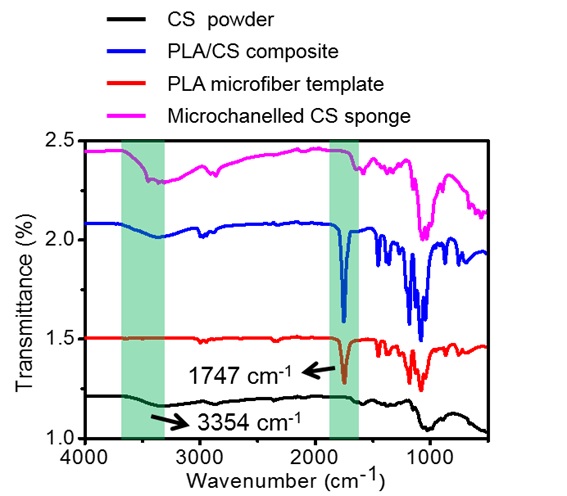
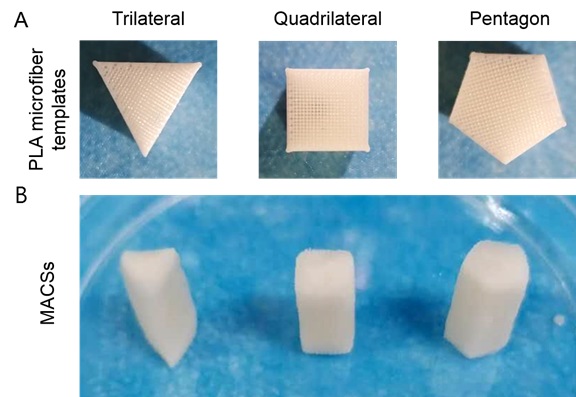
According to our design criteria, the MACSs were fabricated by the procedure illustrated in Fig. 1A. First, the sacrificial PLA microfiber templates were printed by a 3D printer (Fig. 1B and Supplementary Fig. 1). Then, the templates were lyophilized after filling with a 4% (w/v) CS solution. A CS sponge with a uniform microchannel structure was obtained following complete removal of the PLA templates, which was confirmed by FTIR measurement (Supplementary Fig. 2). The resultant CS sponge was further grafted with hydrophobic alkyl chains to improve its pro-coagulant and anti-infective properties. The grafting was carried out via a highly efficient Schiff-base reaction between the amine group of CS and aldehyde group of DA (Fig. 2A). The unstable imine bonds (C=N) were converted into stable alkylamine (C-N) linkages using a reductant (NaCNBH3). Compared to the N1s spectrum of the CS sponge, the appearance of C-N*H-C with a peak area of 39.84% and reduction of the peak area of C-N*H2 in the N1s spectrum of the alkylated CS sponge indicated the successful reaction of the amine and aldehyde groups (Fig. 2B-D). Moreover, the modified CS sponge showed increased Atom Conc % and Mass Conc % of C1s, further demonstrating the successful grafting of hydrophobic alkyl chains (Fig. 2E).
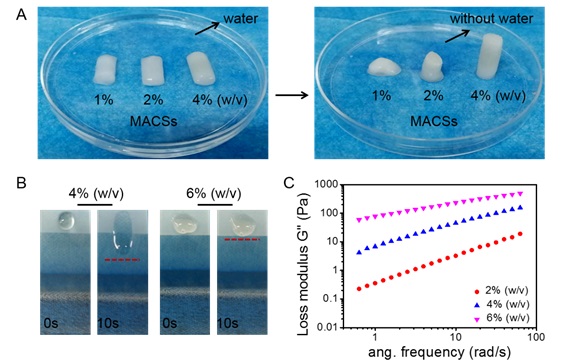
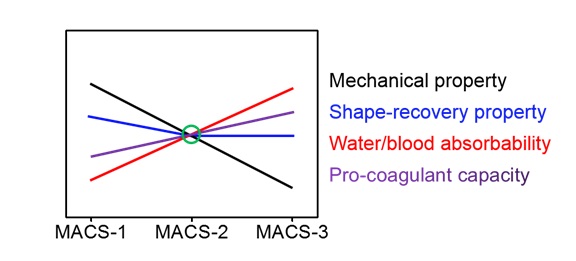
Interconnected pores of the hemostatic sponge could endow itself with the ability to concentrate blood clotting factors and rapidly recover initial shape5, 10, 29. Moreover, they were able to provide a comfortable niche to support host cell infiltration, vascularization, and tissue ingrowth30. Micro-CT images showed that the alkylated CS sponges with different porosity (MACS-1/2/3) fabricated by a combination of the template leaching method and freeze-drying possessed a uniform microchannel structure with an increased microchannel density (Fig. 1C). The alkylated CS sponge (ACS) prepared by direct freeze-drying presented dense structure. Furthermore, SEM images displayed a hierarchical porous structure including microchannel (138 ± 4.3μm) and micropores (8.7 ± 1.5μm) in the MACS-1/2/3 (Fig. 1D-F), while only micropores (8.4 ± 0.9μm) randomly distributed throughout the ACS. The microchannel structure was highly interconnected and tunable, and distributed uniformly across the MACS-1/2/3 (Supplementary Movies 1-3). However, the micropores distributed in the ACS showed a dense structure and low interconnectivity (Supplementary Movie 4). The interconnectivity of the porous structure played a key role in accelerating hemostasis and guiding tissue regeneration, which usually was ignored in most previous studies5, 6, 10, 13. The MACSs were expected to exhibit an obvious advantage in the treatment of noncompressible hemorrhage and in situ tissue regeneration in comparison with reported porous hemostats5, 6, 10, 14. Accordingly, the porosity of the MACSs gradually increased from 70 ± 2.0 to 90 ± 0.6% with an increase in filling ratio of PLA microfiber, which were significantly higher than the 31 ± 0.7% of the ACS (Fig. 1G). Hemostats filled into the wound cavity should possess desirable mechanical strength to prevent their shape deformation caused by external stress from surrounding tissues, thereby providing durable compression on the bleeding site. We first examined the effect of CS concentration on the compressive stress of the MACSs. As the CS concentration increased from 1 to 4% (w/v), the compressive stress was enhanced from 0.6 ± 0.2 to 23 ± 1.5kPa (Fig. 1H, I). When the CS concentration was lower than 4%, the sponges could not maintain their shapes (Supplementary Fig. 3A). The CS solution with concentration higher than 4% possessed higher viscosity (Supplementary Fig. 3B, C), and was difficult to be sucked into the gap of the PLA microfiber template under negative pressure. So, the 4% CS solution was selected to fabricate the MACSs. Next, we investigated the effect of the filling ratio of the PLA microfiber template on the compressive stress. The compressive stress decreased from 46.2 ± 8.0 to 8.1 ± 0.9kPa by increasing the filling ratio of the PLA microfiber template from 20 to 60% (Fig. 1J, K). Indeed, the compressive stress of the MACSs was significantly lower than the 138.0 ± 16.3kPa of the ACS due to the incorporation of the microchannel structure. To better approach practical application, we further detected the compression stress of the sponges after absorbing blood. All the sponges exhibited reinforced mechanical strength (Fig. 1L, M), attributing to the formation of blood clots within the sponges. Both the CS and hydrophobic alkyl chain have been proven to facilitate blood clotting by promoting the adhesion and activation of platelets and the aggregation of RBCs. The MACSs had a higher mechanically reinforced fold than the ACS (Fig. 1N)1, 9. Also, the mechanically reinforced fold of the MACSs gradually enhanced with the increase in porosity (Fig. 1N). The MACSs with high porosity and large surface area could absorb more blood and facilitate the blood to fully contact with the matrix to form more blood clots. Also, the alkylated CS sponge (MACS-2) displayed an improved mechanically reinforced fold compared to the unmodified CS sponge (MCS-2) due to the introduction of hydrophobic alkyl chains (Fig. 1N).
Fig. 1 Fabrication and characterization of the MACSs with different porosity. (A) Schematic illustration of the fabrication process of the MACSs. (B) Stereomicroscopic images of the PLA microfiber template, CS/PLA composite, microchannelled CS sponge, and microchannelled alkylated CS sponge. (C, D) Micro-CT and SEM images showing the macro and microstructure of the ACS and MACS-1/2/3. (E, F) The pore size of the ACS and MACS-1/2/3 in cross-section and longitudinal-section. (G) The porosity of the ACS and MACS-1/2/3. (H, I) Compressive stress-strain curves and compressive stress of the MACSs with different CS concentrations (1, 2, and 4% (w/v)). (J, K, L, M) Compressive stress-strain curves and compressive stress of the ACS, MCS-2, and MACS-1/2/3 before and after absorbing blood. (N) Mechanically reinforced folds of the ACS, MCS-2, and MACS-1/2/3 before and after absorbing blood. n=3, Data are means ± SD. ns indicated no significant difference, *P<0.05, **P<0.01, ***P<0.001.
Fig. 2 Chemical characterization of the MACSs. (A) Modification of the CS sponge with DA in the presence of NaCNBH3 as a reducing agent. (B, C) XPS spectra showing N1s peak of the CS and alkylated CS sponges. (D, E) The area of N1s peak and the calibrate value of C1s in the CS and alkylated CS sponges.
Water/blood absorbability of the MACSs
The main hemostatic mechanism of expandable hemostats was mechanical compression on the bleeding site, which mainly resulted from water/blood-triggered shape recovery and volume expansion1, 5, 14, 27, 29. Thus, strong water/blood absorbability was indispensable for expandable hemostats. After absorbing water and blood, the MACSs rapidly sank to the bottom of the container, while the ACS suspended in water and blood (Fig. 3A, B), revealing that the MACSs could absorb a higher volume of water and blood compared with the ACS. The maximum water and blood absorption capacity of the MACSs was significantly higher than that of the ACS and gradually improved with an increase in the porosity (Fig. 3C-F). Notably, the MACSs took much less time to achieve saturated water/blood absorption than that of the ACS (Fig. 3C, D). The water and blood absorption rate of the MACSs was higher than that of the ACS (Fig. 3G, H), which resulted from the increased number of microchannels. The more microchannels present, the higher the water/blood absorption rate. We further stimulated the fluid absorption behavior of the sponges, whose pore size originated from the statistical analysis of SEM images, as shown in Fig. 3I. We found that the fluid speed in the microchannels of the alkylated sponges (MACS-1/2/3) was higher than that in micropores of the ACS. The higher number of microchannels resulted in a larger area of distribution of the high fluid speed. The total fluid speed of the MACSs was notably higher than that of the ACS and gradually improved as the number of microchannels increased.
Fig. 3 The water/blood absorbability of the ACS and MACSs. (A, B) Photographs of the ACS and MACS-1/2/3 after absorbing water and blood. (C, D) Water and blood absorption capacity-time dynamic curves of the ACS and MACS-1/2/3. (E, F) Maximum water and blood absorption capacity of the ACS and MACS-1/2/3. (G, H) Water and blood absorption rate of the ACS and MACS-1/2/3 within 2s. (I) Fluid simulation images of water absorption behaviors of the ACS and MACS-1/2/3. (J) Total fluid speed of the ACS and MACS-1/2/3. n=3, Data are means ± SD. ns indicated no significant difference, *P<0.05, **P<0.01, ***P<0.001.
Shape-memory property of the MACSs
We further evaluated the water- and blood-triggered shape-memory property of the MACSs and ACS. All sponges could be compressed and shape-fixed after squeezing out the free water (Fig. 4A, B). Upon absorbing the water, they could recover to their original shapes (Fig. 4A, C), giving a 100% recovery ratio. The recovery time (3.3 ± 0.6s, 2.0 ± 0.1s, 1.7 ± 0.6s) of the MACSs was significantly shorter than the 41 ± 3.6s of the ACS (Fig. 4D and Supplementary Movies 5, 6). After absorbing blood, the shape-fixed MACSs could achieve full shape recovery (4.0 ± 1.0s, 2.5 ± 0.5s, 2.0 ± 0.1s) (Supplementary Movie 7); however, the ACS kept a compressed shape and could not recover any further (Fig. 4B, D, F and Supplementary Movie 8).
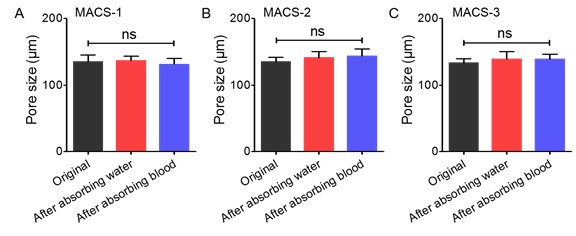
The microstructure of the compressed sponges after absorbing water and blood was further observed by SEM (Fig. 4G). In their original state, homogeneous and circular microchannels with gradient numbers distributed throughout the MACSs. The circle microchannels changed to flat channels under compression stress. After absorbing water/blood, the deformed microchannels recovered to their original shapes, and the size of the microchannels had no obvious change before and after absorbing water and blood (Supplementary Fig. 4A-C). Furthermore, a large number of RBCs aggregated on the surface of the microchannels. The deformed micropores of the ACS recovered to their original state after absorbing water; however, they did not recover to their original shape after absorbing blood, and almost no RBCs were observed within the ACS (Fig. 4G). In addition, the shape-recovery time of the MACSs was significantly shorter (especially absorbing blood) than that of reported shape-memory hemostats (Fig. 4H). Indeed, a large number of studies have demonstrated that, compared to water, blood is more likely to prolong the shape recovery time of hemostats due to its higher viscosity14, 15. In contrast, there was no significant difference in shape recovery time for the MACSs after the absorption of water and blood. This was attributed to the highly interconnected microchannel structure, which allowed the blood to freely penetrate into the sponges. The pore structure inside the ACS and reported shape-memory hemostats generated by the removal of ice crystals and by gas foaming methods exhibited low interconnectivity, which slowed down the flow speed of the blood.6, 9, 10, 11, 15, 16.
Fig. 4 The shape-memory property of the ACS and MACSs after absorbing water and blood. (A, B) Photographs of the water- and blood-triggered shape recovery of the ACS and MACS-1/2/3. (C, D, E, F) The shape-recovery ratio and time of the compressed sponges. (G) SEM images showing the microstructure of the compressed sponges before and after absorbing water and blood. Red arrows represented the flat channels. (H) Comparison of shape-recovery time between the MACS-2/3 and reported shape-memory hemostats. n=3, Data are means ± SD. ns indicated no significant difference, *P<0.05, **P<0.01, ***P<0.001.
In vitro pro-coagulant ability of the MACSs
We also assessed the pro-coagulant ability of the gauze, GS, CELOX, CELOX-G, ACS, MCS-2, and MACSs by the BCI test, in which the lower the BCI value, the stronger the pro-coagulant ability. The BCI values of the MACSs decreased as the porosity increased at 5 and 10min (Fig. 5A), indicating a positive correlation between the promotion coagulation ability and porosity. The BCI values of the MACSs were significantly lower than that of the ACS (Fig. 5A). Also, the alkylated CS sponge (MACS-2) exhibited stronger pro-coagulant ability than the unmodified CS sponge (MCS-2) due to the introduction of alkyl chains24, 25, 26. Notably, the MACSs demonstrated better pro-coagulant performance compared with clinically used gauze, GS, CELOX, and CELOX-G due to the synergistic effects of the microchannel structure, CS itself, and hydrophobic modification.
The active coagulation cascade mainly relied on the aggregation of RBCs and adhesion and activation of platelets5. Thus, we further evaluated the blood coagulation effect of various samples using RBCs and platelets adhesion assays. The number of adhered RBCs and platelets to the MACSs was remarkably higher than that on the gauze, GS, CELOX, CELOX-G, ACS, and MCS-2 (Fig. 5B, C). Additionally, the higher porosity resulted in a higher number of adhered RBCs and platelets. Consistently, as observed in SEM images, more RBCs and platelets adhered to the MACSs than on other samples (Fig. 5D, E). A higher number of aggregated RBCs and activated platelets were detected in the MACSs than that in other samples (Fig. 5D, E), which accelerated blood coagulation31. CS has been proven to accelerate platelet adhesion and activation, and the aggregation of RBCs through electrostatic interactions32, 33. The microchannel structure was able to promote penetration of the blood and aggregation of RBCs and platelets. The hydrophobic alkyl chains could insert into membranes of the RBCs and platelets, further promoting active capture and aggregation24, 25, 34. We concluded that the CS, microchannel structure, and hydrophobic alkyl chains synergistically contributed to the strong pro-coagulant ability of the MACSs (Fig. 5F).
Fig. 5 The pro-coagulant ability of the gauze, GS, CELOX, CELOX-G, ACS, MCS-2, and MACSs. (A) The BCI-time curves of various samples. (B, C) The number of adhered RBCs and platelets on various samples. (D, E) SEM images showing adhesion of RBCs and platelets on various samples. (F) Schematic diagram illustrating the pro-coagulant mechanism of the MACSs. n=3, Data are means ± SD. ns indicated no significant difference, *P<0.01, **P<0.01, ***P<0.001.
In vivo hemostatic effect of the MACSs
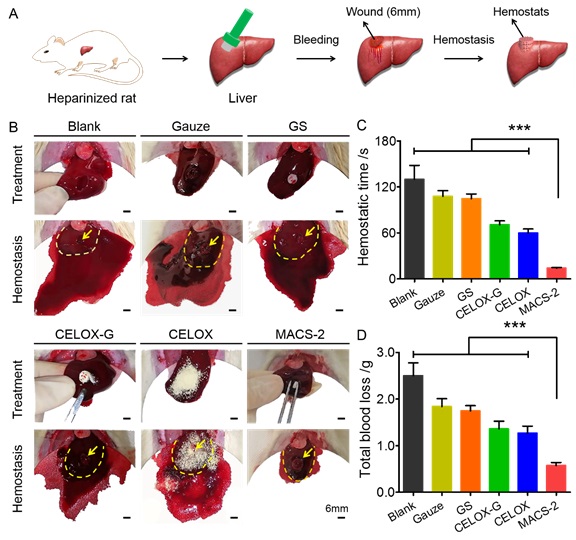
The MACS-2 was selected and used for in vivo hemostasis based on its mechanical strength, water/blood absorbability, blood-triggered shape-memory property, and pro-coagulant capacity (Supplementary Fig. 5). The hemostatic effect was explored in the normal rat liver perforation wound model, as illustrated in Fig. 6A. After treating the wound with the MACS-2, a small area of bloodstain was observed on the surface of the filter paper beneath the liver, while a large area of bloodstain was sighted in the gauze, GS, CELOX-G, CELOX, ACS, and MCS-2 groups (Fig. 6B and Supplementary Movie 9). Quantitatively, the total blood loss of the MACS-2 group was significantly lower than that of other groups (Fig. 6C). Also, the hemostatic time was significantly shorter than that of other groups (Fig. 6D).
Fig. 6 Hemostasis in the normal rat liver perforation wound model. (A) Schematic illustration of the hemostatic process of hemostats in a rat liver perforation wound model. (B) Photographs of the hemostatic effect of the gauze, GS, CELOX-G, CELOX, ACS, MCS-2, and MACS-2. The yellow arrow represents the bleeding site. The yellow dotted line represents the boundary of the liver. (C, D) Total blood loss and hemostatic time in the gauze, GS, CELOX-G, CELOX, ACS, MCS-2, and MACS-2 groups. n=3, Data are means ± SD. ns indicated no significant difference, *P<0.01, **P<0.01, ***P<0.001.
Hemorrhage control of anti-coagulated patients remains a challenge in the clinical setting35. To simulate clinical application, a heparinized-rat liver perforation wound model was used to evaluate the hemostatic capacity of various samples (Supplementary Fig. 6A). After applying the MACS-2, only a small area of bloodstain distributed on the surface of the filter paper under the liver (Supplementary Fig. 6B and Supplementary Movie 10). In contrast, a large area of bloodstain was observed after applying other hemostats. Statistical analysis showed that the hemostatic time of the MACS-2 group was much shorter than that of other groups (Supplementary Fig. 6C). Also, the MACS-2 was superior in reducing the total blood loss when compared with the other hemostats (Supplementary Fig. 6D).
To further explore the clinical translation potential of the MACSs, a lethal pig liver perforation wound model was used to evaluate its hemostatic capacity (Fig. 7A). Commercial CELOX as a control is a commonly used hemostat in prehospital and hospital scenarios in military and civilian settings1, 36. As the shape-fixed MACS-2 was filled into the wound cavity (diameter of 1.5cm), it rapidly recovered its initial cyclical shape by absorbing blood, and then filled the cavity and exerted pressure on the wound wall, achieving hemostasis within 2.0 ± 0.5min (Fig. 7B, C and Supplementary Movie 11). However, the untreated wound continued to bleed at least 10min (Supplementary Movie 12), and the CELOX-treated wound stopped bleeding at 9.0 ± 0.3min (Supplementary Movie 13). The MACS-2 was fixed on the bleeding cavity by its shape recovery. In contrast, the CELOX was prone to being washed away by the blood without external compression. In fact, manual pressing is very inconvenient in emergencies and it is difficult for the wounded to complete self-rescue on the battlefield31. We further quantified the total blood loss by determining the sum of the weight of the blood absorbed by the filter paper and hemostat. The total blood loss (17.6 ± 4.5g) in the MACS-2 group was much lower than that in untreated (153.0 ± 15.5g) and CELOX (143.0 ± 6.6g) groups (Fig. 7D). The MACS-2 demonstrated superior in vivo hemostatic ability for lethal noncompressible hemorrhage compared to clinically used gauze, GS, CELOX, and CELOX-G, which was due to the synergistic effect of CS itself, microchannel structure, and hydrophobic modification (Fig. 7E). The highly interconnected and controllable microchannel structure enhanced the blood adsorption capacity of the sponge, allowed the blood to perfuse into the interior of the sponge quickly, and then facilitated the recovery of its original shape, which pressed the wound and achieved rapid hemostasis. CS and alkyl chains actively captured RBCs and platelets via electrostatic and hydrophobic interactions, and also promoted aggregation of the RBCs and platelet activation. This action triggered the coagulation cascade reaction by fibrinogen-mediated interaction with the activated platelet integrin glycoprotein IIb/IIIa, which further improved hemostasis efficiency1, 9, 23. For clinic application, the MACSs could be customized into different shapes to meet special requirements in practical applications (Supplementary Fig. 7).
Fig. 7 Hemostasis in a lethal pig liver perforation wound model. (A) Schematic illustration of the hemostatic process of hemostats. (B) Photographs of the hemostatic effect of the blank, CELOX, and MACS-2 groups. The yellow dotted line represents the boundary of the liver. (C, D) Hemostatic time and total blood loss in the blank, CELOX, and MACS-2 groups. (E) Schematic diagram of hemostatic procedure and mechanism of the MACS-2. n=3, Data are means ± SD. ns indicated no significant difference, *P<0.01, **P<0.01, ***P<0.001.
Comparison of in vitro anti-infective property of the MACS-2 with other hemostats
Severe bacterial infection, similar to massive blood loss, is also responsible for trauma-associated deaths37. Thus, ideal hemostats should possess robust anti-infection property. The anti-infective capacity of the MACS-2 against S. aureus and E. coli was evaluated by a contact-killing assay and compared with the gauze, GS, CELOX-G, CELOX, ACS, and MCS-2 (Fig. 8). Qualitative and quantitative analysis showed that, after contacting the MACS-2, the CFUs number of S. aureus was significantly lower than that of the gauze, GS, and ACS groups. There was no obvious difference in the CFUs number between the MACS-2 and CELOX-G, CELOX, as well as MCS-2 (Fig. 8A, C), because the hydrophobic alkyl chains could not interact with the membranes of S. aureus38. After contacting the MACS-2, the CFUs number of E. coli was remarkably lower than that of the gauze, GS, CELOX-G, CELOX, ACS, and MCS-2 (Fig. 8B, D). This enhanced anti-infective activity was ascribed to the synergistic effects of the microchannel structure, grafted hydrophobic alkyl chains, and CS itself24, 26.
Fig. 8 In vitro anti-infective property of the MACS-2 and other hemostats. (A, B) Photographs of CFUs of S. aureus and E. coli grown on LB agar plates after contacting with TCP, gauze, GS, CELOX-G, CELOX, ACS, MCS-2, and MACS-2, respectively. (C, D) Corresponding statistical results of the CFUs of S. aureus and E. coli. n=3, Data are means ± SD. ns indicated no significant difference, *P<0.05, **P<0.01, ***P<0.001.
MACS-2 guided in situ liver regeneration
The removal of hemostats may result in secondary bleeding and cause great distress to patients. If hemostats could be left in the injury site and directly guide in situ tissue regeneration, this would be favorable to patients and surgeons9. In situ liver regeneration as a representative model was used to evaluate the pro-regenerative ability of the MACS-2 and ACS. Rapid host cell infiltration was the first and crucial step for endogenous tissue regeneration39, 40. DAPI and H&E staining showed that the host cells migrated into the interior of the MACS-2, but were mainly distributed around the edge of the ACS due to its dense structure (Fig. 9A). Accordingly, the cell number inside the MACS-2 was significantly higher than that of the ACS (Fig. 9B). Infiltrated cells secreted a large amount of extracellular matrix and formed neotissue. The tissue ingrowth area within the MACS-2 was much larger than that of the ACS. However, almost no neotissue grew inside the ACS (Fig. 9A, C). A rich capillary network capable of delivering adequate oxygen and nutrients is indispensable for newly formed tissue survival. Thus, vascularization was assessed by immunostaining for von Willebrand Factor (vWF). A high density of capillaries distributed inside the MACS-2 (Fig. 9D); in contrast, almost no capillary was observed within the ACS. A large number of ALB positive cells were observed in the interior of the MACS-2, indicating ingrowth of liver parenchymal cells and liver tissue regeneration. In comparison, almost no liver parenchymal cells infiltrated into the ACS (Fig. 9A, E)41. The improved ability of cellularization, vascularization, and tissue ingrowth of the MACS-2 attributed to the highly interconnected microchannels, high porosity, and good biocompatibility (Fig. 9F)39. To our knowledge, there has not been any report to date regarding the use of a shape-memory hemostatic sponge for internal penetrating wound repair. Our MACS-2 simultaneously achieved hemostasis and in situ tissue regeneration, which broadens the application of hemostats and opens up an opportunity for the design and construction of clinically beneficial hemostats. Specifically, the application of our hemostatic sponge will reduce patient discomfort, simplify treatment procedures, and potentially decrease healthcare costs.
Fig. 9 Liver regeneration in rat models after implantation of the ACS and MACS-2. (A) DAPI staining showing cell infiltration within the ACS and MACS-2. H&E staining showing tissue ingrowth. Yellow asterisk (*) represents the alkylated CS. Images of immunofluorescent staining for vWF (red) and ALB (red) indicating capillary and liver parenchymal cell (LPC) infiltration within the ACS and MACS-2. Yellow pound key (#) and arrow represent capillary and LPC, respectively. (B, C, D, E) Quantification of cell number, tissue ingrowth area, capillary number, and LPCs per view within the ACS and MACS-2. (F) Schematic illustration of in situ liver regeneration, including the host cell infiltration and vascularization. n=3, Data are means ± SD. ns indicated no significant difference, *P<0.05, **P<0.01, ***P<0.001.