Study population
We recruited participants in grade 4 of 37 primary schools in Dongcheng or Miyun district of Beijing, China, from May to June in 2016. The inclusion criteria for schools were as follows: Firstly, non-boarding, non-specialty and non-minority schools. Secondly, schools with no less than 50 students in grade 4. Thirdly, schools’ leaders agreed to participate in the study. All the eligible primary schools (43 schools) which met the inclusion criteria were invited to complete the school-based obesity prevention survey. Finally, 37 of the 43 schools (86%) provided approval for the study, including 23 schools in Dongcheng district and 14 schools in Miyun district (Figure S1). We used the method of cluster sampling to recruit students in each school. All students in the 2-3 selected classes received the informed consent forms. We included the students whose parents agreed and signed the informed consent forms in the study. Exclusion criteria were as follows: Firstly, children with diseases of important organs, such as heart disease, hypertension, tuberculosis, asthma, hepatitis, and nephritis. Secondly, children with obesity caused by other reasons such as endocrine diseases, side effects of drugs and so on. Thirdly, children with dysplasia such as dwarfism and gigantism. Fourthly, children with body disability and malformation such as severe scoliosis, pigeon breast, lameness, Knock Knees, Bowlegs and so on. Finally, 2201 students of 37 primary schools were included in our study.
Anthropometric measurements and Definition of obesity
Height (cm) and weight (kg) were measured according to the standard procedure. Participants were required to wear light clothes and stand straight, barefoot and at ease when being measured. Weight was measured to the nearest 0.1 kg with a standardized lever scale and height to the nearest 0.1 cm with a portable stadiometer. Both the scales and stadiometers were calibrated before measurements. Body mass index (BMI) was calculated as body weight (kg) divided by height (m) squared (kg/m2). We used the standard of Working Group on Obesity in China (WGOC) to define the nutritional status[36]. Obesity was defined as a BMI at or above the 95th percentile for children of the same age and sex [36].
Questionnaire investigation
We investigated students’ age, gender, physical activities, diet behaviors and other individual and family factors related to obesity with questionnaires for students and their parents. We collected students’ intake of vegetables, fruits, meat, milk, and sugar-sweetened beverages in the past seven days with the students’ questionnaires. We designed the questions of the students’ diet behaviors according to the Block Kids Food Screener (BKFS). The validity study showed that the correlation between BKFS and three 24-h dietary recalls was 0.526, 0.600, 0.681, 0.478, 0.869 in the intake of vegetables, fruits, meat, sugar-sweetened beverages, and milk, respectively[37]. We asked the students about the frequency and amount of the foods and beverages consumed in the past seven days. For example, the following questions “How many days do you eat vegetables in the past seven days” and “How many portions of vegetables do you eat on average per day” were asked. The frequency was from zero to seven days and the amount was half of one portion, one portion, two portions, and more than or equal to three portions. One portion was 150 grams for vegetables and fruits, 80-100 grams for meat, and 250 milliliters for sugar-sweetened beverages and milk. According to the Dietary Approaches to Stop Hypertension (DASH)[38], in the Integrated Guidelines for Cardiovascular Health and Risk Reduction in Children and Adolescents, we adopted the following evaluation criteria. The recommended intakes of vegetables and fruits were more than 3 portions and 2 portions per day, respectively. The recommendation of meat intake was less than 2 portions per day for boys and 1 portion per day for girls. The recommendation of milk was more than 2 portions per day. The recommended intake of sugar-sweetened beverages was less than 3 portions per week. If the intake of vegetables, fruits, and milk reached or exceeded the recommendation, the score was 1, else, the score was the actual intake divided by the recommended amount. If the intakes of meat and sugar-sweetened beverages were within the recommendation, the score was 1, else, the score was 1- (actual intake- recommended amount) / recommended amount, and if the score was negative, we recorded the score as zero. We calculated the score of the dietary pattern as the sum of all the above scores. The summed score ranged from zero to five and the higher score reflected greater adherence to the recommended dietary intakes. We investigated the physical behaviors according to the American Youth Risk Behavior Survey Questionnaire[39], and physical activity recommendation was that children had moderate or vigorous physical activities for more than or equal to one hour every day[40]. According to the guideline of screen time for children and adolescents in the American Academy of Pediatrics, the recommendation of screen time was less than two hours every day[41]. We collected the information about parents’ height, weight, and education, and family type (family with only one child or with more than one child) with the questionnaire for parents.
Density of convenience stores
We used AMAP, the free web-based geospatial service provider, to geocode and locate the schools’ addresses. By using the Application Programming Interface (API) on the AMAP open platform, we accessed to Point of Interest data (POI). Convenience stories were defined as the POI from 060200 to 060202 in AMAP, which included all small convenience stores and grocery stores such as 7-Eleven, Good Neighbor, Lin Jia, and other chain and non-chain convenience stores. We calculated the density of convenience stores located within an 800-meter street network buffer of school centroid. We used the 800-meter buffer for the reason that it approximately corresponded to 10- minute walk, which was commonly used in previous studies[13].
We also undertook an on-foot ground audit in 8 schools. We recorded the actual information of the convenience stores and compared the differences in the information between the AMAP and the ground audit. We also calculated the accuracy of the convenience stores from the map, by the number from both map and ground audit divided by the number from the ground audit. Finally, the accuracy for the convenience stores was 80.9%, which was similar to the previous study[42].
Statistical analyses
Means and standard deviations were calculated for continuous variables with normal distribution, while medians and interquartile ranges for non-normally distributed variables. Frequencies were calculated for categorical variables. We defined more than or equal to the median number of convenience stores as more convenience stores and less than the median number as fewer convenience stores. We tested differences between Dongcheng district and Miyun district in categorical characteristics with the chi-square test, normally distributed continuous characteristics with t test, non-normally distributed continuous characteristics with Wilcoxon signed-rank test.
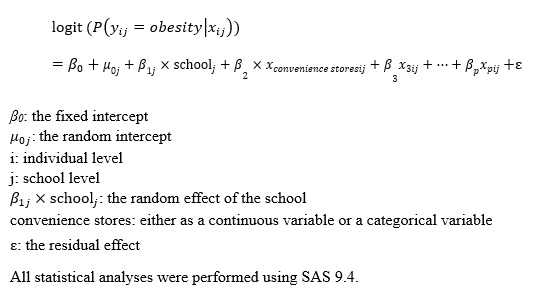
We used Generalized Linear Mixed Model to explore the association of childhood obesity and convenience stores near schools. We used childhood obesity(obesity=1, non-obesity=0) as the outcome variable and the number of convenience stores as the continuous predictor or more convenience stores as the categorical predictor. PROC GLIMMIX procedure was run with schools modeled as a random effect because of the cluster sampling of schools, using logit as the link function. Based on the previous studies on the association between food environment and childhood obesity[13], we chose the district level, family level, and individual level covariates and adjusted the covariates in the order of district, family, and individual level. First, we used the null model (model 1), not controlling for covariates, to examine the association of childhood obesity and convenience stores. Secondly, we used model 2 to adjust for the district. Model 3 further included the family confounding factors, i.e. whether the parents were obese, parents’ education levels, and family type.Then model 4 further adjusted for age and gender of children. Finally, in the full model 5, we further adjusted for dietary and physical behaviors of children that involved the score of dietary pattern, meeting the recommendation of moderate or vigorous physical activities or not, and meeting the recommendation of screen time or not. The model was built as follows: (see Calculations in the Supplementary Files)