General features of O. sakamorii mitochondrial genomes
The mt genome of O. sakamorii (GenBank: MT232643) had an overall size of 14,494 bp. It was circular, with 13 PCGs, two ribosomal RNAs (rRNA) and 22 tRNAs and a large non-coding region (Supplementary Table S1). A software search and visual inspection, for O. sakamorii, found all of the tRNAs. We detected 21 reliable tRNAs based on online tools including tRNAscan-SE[20], ARWEN[23], MITOS[25] and MITOS2 (http://mitos2.bioinf.uni-leipzig.de). The trnV was identified manually by alignment with their homologue species based on their anticodon and secondary structures (Table 1). The trnF, trnW, trnE and trnK showed a typical cloverleaf structure. The other 18 tRNAs had reduced D-, T-arms or both arms.
The percentage nucleotide composition of the mt (+)-strand is A = 41.7, C = 18.2, G = 10.9 and T = 29.1, resulted in a positive AT-skew (0.182) and a negative GC-skew (-0.251). A comparative analysis of A + T% vs AT-skew and G + C% vs GC-skew among all available mt-genomes of oribatid mites showed six oribatid mites that were together and only S. magnus being separated (Fig. 1). This result is consistent with the difference of the supercohort in oribatid mites (Supplementary Table S2).
Re-annotating mitochondrial tRNA genes in oribatid mites
Numerous methods have varying predictive ability for the atypical secondary structure of tRNAs. For example, tRNAs annotation results for a S. magnus mitochondrial sequence differ when using different type and/or numbers of tRNA predictive methods (Fig. 2). In the present study, we applied all available tRNA prediction methods designed to maximize the accuracy of tRNA genes annotation, especially for atypical tRNAs. We confirmed the prediction of the majority of tRNAs with previous described ones. All of the "lost" tRNA genes in oribatid mites were found and some of the incorrectly annotated tRNAs were re-annotated (Fig. 2). The details are as follows:
The re-annotation of the tRNAs of the O. sp. predicted three tRNAs based on its mitogenome(GeneBank: MH921998), including trnY, trnS1 and trnM[24]. ARWEN[23] predicted trnY is situated between trnQ and trnP and previously retrieved trnY is situated between trnC and nad2 (Fig. 2). The trnS1 was found by MITOS2, encoded on the (+)-strand at the 3′end of trnL1. In contrast, previously described trnS1 was identified on the (-)-strand at the 3′end of trnQ (Fig. 2). The trnM could be identified manually by sequence alignment and secondary structure comparison with those identified in other species of oribatid mites (Table 1). To select the most probable tRNAs, the minimum free energy (MFE) was calculated[26]. The MFE for this study described three tRNA structures that are smaller than those seen in previous study (Fig. 3). The secondary structure of our described tRNAs has fewer mismatches in the acceptor or/and anticodon stem (Fig. 3).
By multiple sequence alignment analysis (Table 1), we manually identified two "lost" tRNAs (trnG and trnY) in Pa. leontonychus[17]. The trnG was identified on the (+)-strand at the 3′end of cox3, trnY was identified on the (-)-strand at the 3′end of trnQ (Fig. 2). MFE value and secondary structure of trnG and trnY are shown in Fig. 3. We also re-annotated trnA, trnS1 and trnC for Pl. peltifer, trnS1 and trnY for H. gibba based on manual sequence annotation (Fig. 2). MFE for these tRNA structures are all smaller than described by Xue et al.[24] (Fig. 3). The secondary structure of our described tRNAs also has fewer mismatches in the acceptor and/or anticodon stem (Fig. 3).
Table 1
The alignment of nucleotide sequences of 4 mitochondrial tRNA genes (trnV, trnM, trnG and trnY) of the same superfamily in oribatid mites.
|
trnV
|
O. sakamorii
|
TTAGGGT
|
---TTA----TTTTT
|
CTTTAATTACGGTAAAG
|
A—TG–TTTTT
|
-----AACC–TTAG
|
|
O. sp.
|
T--------GTTGGG
|
GCTTTTCTTTTGAGAT
|
TTTTATTTACGGTAAAA
|
ATTTG–TCTGC
|
CCTAAC----TT
|
|
Pa. leontonychus
|
AGA—GTTT
|
----TGG—TTCC
|
CTTTAATTACGGTAAAG
|
GT–TGGTGT
|
----TAACTCTT
|
|
trnM
|
O. sakamorii
|
-AGCAAGT
|
- AAAGCTTAATT---- AAGCTT
|
AGGTATTCATAATTCCT
|
AGAATTT
|
CATTGCTA
|
|
O. sp.
|
T-AGTAAA
|
C AAAGCTTAACCACAAAGCTT
|
AGGTATTCATAATTCCT
|
AGAAATTGA
|
A-TTACTAG
|
|
Pa. leontonychus
|
- AGCAACT
|
- AAAGCTTAAATA– AAGCTT
|
AGGTATTCATAATTCCT
|
AGAACAAC
|
CGTTGCTC
|
|
trnG
|
O. sakamorii
|
AT- TCTTA
|
TAG— TATATGTC- - - -GT- ACA
|
- TTTAATTTCCAATTAAA
|
AAG—AAA
|
AAAGAAAA
|
|
O. sp.
|
ATTTCA-A
|
CAG— TATACAAA- - - GT- ACG
|
C-TTAATTTCCAATTAAG
|
AAG—AAAA
|
AA- GAAACA
|
|
Pa. leontonychus
|
AA-TCTTA
|
AAAATTAAAAGGTAAAGTTAAAT
|
-- TAAAATTTCCATTCTGT
|
GAGTCACAGC
|
TTT GATAC
|
|
trnY
|
O. sakamorii
|
TTTGA- GG
|
TGATTACGCAT— A
|
AGAAA-TTGTAAA-TTTCT
|
TTTTTT---- T
|
TA- TCAAAT
|
|
O. sp.
|
TTT- ACGG
|
TGA ----- GATTGGA
|
AGAAA-TTGTAAA-TTTCT
|
ATTTTTTTAT
|
CA -TTATAT
|
|
Pa. leontonychus
|
TTT- AGGG
|
TGAAAA-GCAAA- A
|
- CAAAGTTGTAAACTTTG
|
- TTTGCAAAT
|
CGGTGTAA
|
| Note: The anticodons are bold text. The conserved sequences are in underlined letters. |
The S. magnus mitochondrial gene annotation is controversial. In this study, we confirmed the prediction of 18 tRNAs made in previous studies and were-annotated four tRNAs including trnP, trnL1, trnN and trnF (Fig. 2). The position of trnP is still uncertain. Such Klimov and Oconnor and Schäffer et al. didn't re-annotate trnP (Fig. 2). Xue et al. refrained the trnP which were inferred by Edwards et al. in S. magnus and they confirmed the trnP which were inferred by Domes et al.[22]. Based on manual annotation, trnP was found on the sequence of trnQ ~ trnW (on the (-) -strand) (Fig. 2). Compared to previous studies describing trnP, the structure of trnP in this study is more stable thermodynamically (Fig. 3). The secondary structure of trnL1, predicted by Xue et al. has five mismatches in the anticodon stem (Fig. 3)[22]. The trnL1, which was suggested by Schäffer et al. has two mismatches in the anticodon stem[17]. We proposed that trnL1 has 1 mismatch in the anticodon stem, indicating it may be a more stable structure (Fig. 3). Our trnL1 also preserves the Limulus polyphemus gene order trnL2-trnL1 (Fig. 2). The trnN could be inferred manually in this study. MFE values were smaller in our analyses compared to Xue et al.[22]. This indicates that our version of trnN structure may be more stable. Based on anticodon and secondary structures, we manually identified that trnF is located between the trnN and trnY genes (Fig. 2), while Xue et al. described one overlap with the first position of an upstream gene (39 bp)[22] and this may violate the tRNA punctuation model for RNA processing[27].
Codon usage in the mt genomes of oribatid mites
We analyzed the codon usage in the mt PCGs of the seven species of oribatid mites to determine whether the corresponding codons of the "lost" tRNA genes are used. To avoid bias due to unusual putative start codons and incomplete stop codons, all of the first codons as well as stop codons were excluded from the analysis. Codons for all of the 22 amino acids are present in all of the PCGs in all of the oribatid mites, including the two species in which mt tRNA gene "loss" has been reported (Fig. 4). The amino acid frequencies are similar in the seven different oribatid mites. The codon families also exhibited a similar pattern among them.
Common-interval analysis of Sarcoptiformes gene order with CREx
We calculated the common interval with CREx as a measure of the extent of mt genome reorganization (Table 2). According to the number of common intervals, the gene orders of the major genes (PCGs and rRNAs) were used to infer the possible evolutionary relationships within oribatid mites, astigmatid mites and the putative ancestral arthropod (L. polyphemus) (Fig. 5). By comparing the gene order of type I with L. polyphemus, nad2 was found to be a transposition. By comparing the gene order of type II with the type I, nad1 was found to be a transposition. By comparing the gene order of type III with the type II, three rearrangement events were inferred: transposition of one gene block (cob and nad2), reverse transposition of two genes (nad1 and rrnL) and four reversals in a large gene block (Fig. 5).
Table 2
The number of common intervals of L. polyphemus, oribatid mites and astigmatid mites when mitochondrial major gene (PCGs and rRNAs) arrangements are compared.
| |
L. polyphemus
|
Six oribatid mites
|
S. magnus
|
astigmatid mites
|
|
L. polyphemus
|
204
|
154
|
132
|
56
|
|
Six oribatid mites
|
154
|
204
|
154
|
56
|
|
S. magnus
|
132
|
154
|
204
|
60
|
|
astigmatid mites
|
56
|
56
|
60
|
204
|
| Note: Six oribatid mites including H. gibba, N. palustris, O. sp, O. sakamorii, Pl. peltifer and Pa. leontonychus share a same gene (PCGs and rRNAs) order. All available astigmatid mites share a same gene (PCGs and rRNAs) order. |
Mapping shared gene orders in oribatid mites
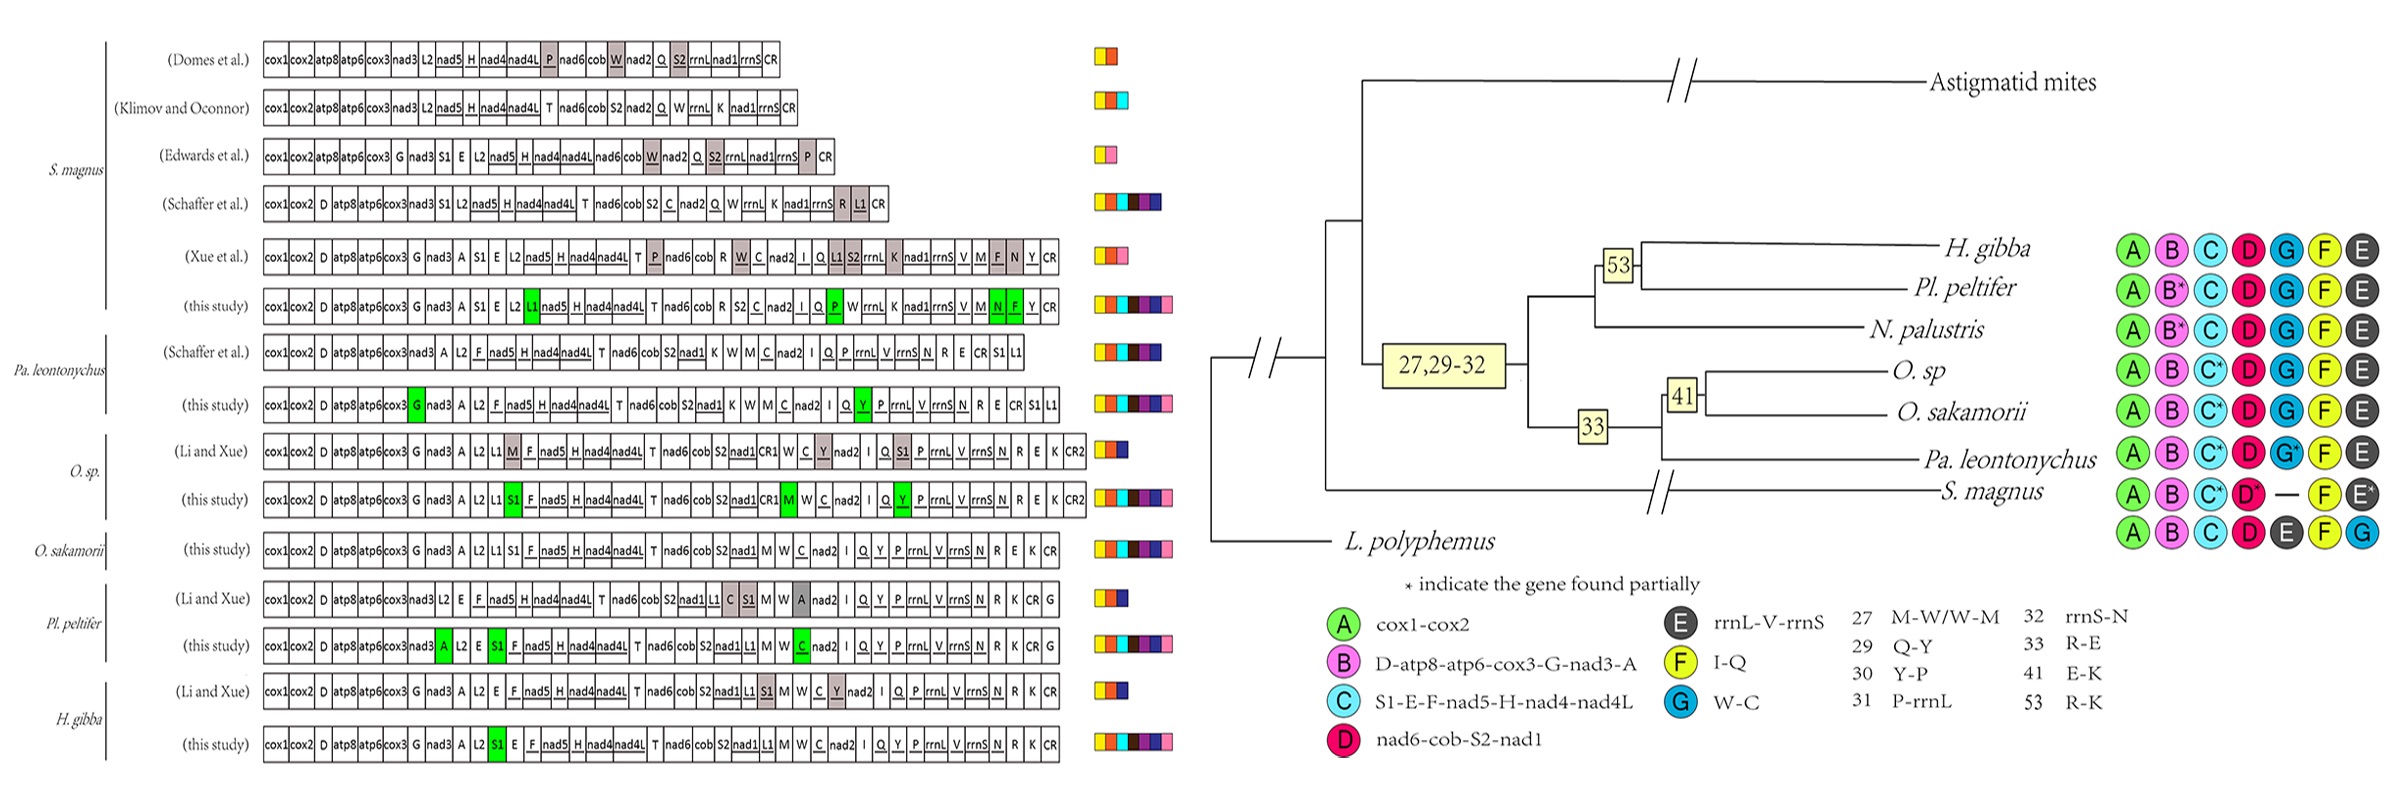
Linearized gene order maps for seven oribatid mite mt genomes plus the ancestral arthropod gene order are given in Fig. 6. The mt genome of oribatid mites are rearranged compared to the hypothetical ancestor of arthropods, represented by L. polyphemus. The seven oribatid mite species from six families have rearranged mt genomes. Each species has a unique mt genome organization (Type I to Type VII, Fig. 6). Seven ancestral gene blocks consist of between two and eight genes (1–7 gene boundaries) (Fig. 6). Gene block A (cox1-cox2) and block F (trnI-trnQ) are conserved in all seven oribatid mites. Gene block B (trnD-atp8-atp6-cox3-G-nad3-trnA) is retained in all of the oribatid mite species except Pl. peltifer and N. palustris. Block C (trnS1-trnE-trnF-nad5-trnH-nad4-nad4l-trnT) is only conserved in H. gibba and Pl. peltifer, and partially present in the other five oribatid mites. Gene block D (nad6-cob-trnS2-nad1) is retained in all of the oribatid mite species except S. magnus where trnR inserted between cob and trnS2, and nad1 is a translocation. Block F (rrnL-trnV-rrnS) and block G (trnW-trnC) are also conserved in all oribatid mite species except S. magnus.
One hundred and twenty-nine derived gene boundaries were found in the seven available mt genomes of oribatid mites (numbered 1 to 56 in Fig. 6). Of these, 19 are shared, derived gene boundaries present in at least two species and an additional 37 unique boundaries found in a single species were identified (Fig. 6). Gene boundaries (2, 4, 6–8 and 11–21) were only found in S. magnus. Gene boundaries (24–26, 28, 34, 35 and 37) were only found in Pa. leontonychus. Gene boundaries (39 and 40) were only found in O. sp. Gene boundary (43) was only found in O. sakamorii. Gene boundaries (43–50) were only found in N. palustris. Gene boundaries (54 and 55) were only found in Pl. peltifer. Gene boundary (56) was only found in H. gibba.
Out of the 19 derived gene boundaries, 11 were either homoplastic or secondarily lost in some of the taxa descended from the node and remaining 8 are unambiguous synapomorphies. Hence, eight shared derived gene boundaries were mapped onto the phylogenetic tree inferred from the ML dataset (Fig. 7). Five derived gene boundaries (27 and 29–32) are synapomorphies supercohort Desmonomatides (Type II to Type VII Fig. 6). Gene boundary 41 (trnE-trnK) is a synapomorphy for the family Oribatulidae (Type III and Type IV Fig. 6). Gene boundary 33 (trnR-trnE) is a synapomorphy for the superfamily Oripodoidea (Type II to Type IV Fig. 6), whereas boundary 53 (trnR-trnK) is a synapomorphy for H. gibba and Pl. peltifer (Type VI to Type XVII Fig. 6).
Phylogenetic relationships
We constructed a phylogenetic tree based on a nucleotide data set from 13 mt PCGs of 59 mites (Fig. 8). The ML and BI analyses showed similar topologies. Monophyly of Oribatida is recovered with strong support (BPP = 1, BSP = 100; Fig. 8), as well as monophyly of Desmonomatides. The monophyly of Astigmata (astigmatid mites) is recovered with support (BPP = 0.99, BSP = 71). Within Desmonomatides, six oribatid mites from two superfamilies (Crotonioidea and Oripodoidea) of two cohorts (Nothrina and Brachypylina) formed a monophyletic clade; each of the superfamilies or cohorts is monophyletic with strong support (BPP = 1, BSP = 100). Here the phylogeny of Desmonomatides at the cohort level is suggested as (Astigmata, (Nothrina, Brachypylina)). The new sequence of O. sakamorii showed a sister-group relationship with the O. sp. (BPP = 0.97, BSP = 49; Fig. 8). The phylogenetic tree shows that H. gibba and Pl. peltifer cluster into one branch with strong support (BPP = 1, BSP = 96; Fig. 8).