Plant materials
410 soybean accessions were obtained from the Chinese National Soybean GeneBank (CNSGB), including 110 Non-Chinese accessions (from 8 countries, including the United States and Russia) and 300 Chinese domestic accessions (from 27 Chinese provinces, with many accessions from the Northeastern provinces of Heilongjiang and Liaoning, in the known center of soybean domestication) (Table S1). Pilot screening identified the set of 6 accessions(Table S2)—each with different levels of drought tolerance—that we used to initially optimize the PEG-6000 concentration we used for the larger-scale screen of the full 410 accession germplasm diversity panel.
Methods
Optimum PEG-6000 concentration screening
We used six soybean accessions with different levels of drought tolerance at the germination stage for this drought treatment optimization process. Seeds of uniform size were selected from each accession; these were sterilized with 0.1% HgCl2 for 30 s, washed with sterile water 2-3 times, and dried with filter paper. Twenty seeds per genotype were used in each of three replications. The seeds were placed on wetted filter paper in 9-cm-diameter Petri dishes to evaluate the growth performance and phenotypic variation in seedlings. We then added 15 ml of PEG-6000 solution to each dish at the following concentrations: 0% (CK), 10%, 15%, 20%, and 25% (W/W). The culture dish was then placed in an artificial climate incubator at constant temperature and humidity (25°C), and the appropriate PEG-6000 concentrations were added to each of the treatments each two days to keep the germinating bed moist. Germination was assessed at 24-hour intervals for 8 consecutive days. The germination rate (GR), germination energy (GE), germination index (GI), and germination drought index (GDI) of different PEG-6000 concentrations for each accession were compared to determine the optimal concentration of PEG-6000, according to the method of Ku et al. [27] and Thabet et al. [28].

In these formulas, “n” is the number of germinated seeds on the eighth day, “m” is the number of seeds germinated on the sixth day, “N” is the total number of seeds, “DG” is the number of seeds germinated every two days, “DT” is the germination days corresponding to DG, “nd2”, “nd4”, “nd6”, and “nd8” are the germination rates of seeds on the second day, the fourth day, the sixth day, and the eighth day, respectively, and “1.00”, “0.75”, “0.50”, and “0.25” are the drought tolerance coefficients assigned by the corresponding germination days, respectively.
Phenotype identification and drought tolerance evaluation in the germination stage
Using the optimum PEG-6000 concentration (20%), 410 germinating plants from each accession of the panel were tested for traits including GR, GE, GI, and GDI. The RGR, RGE, GDTI, GSI [28], and MFV [27, 29] traits were used as evaluation indices to examine the drought tolerance of the materials during the germination stage. The calculation method was as follows.

In these formulas, “T” is the treatment, “C” is the control (water), is the subordinate function of an indicator of the accessions, “X” is the measured value of an indicator of the accessions, “XMin” and “XMaX” are the minimum and maximum values within the measured value of an indicator of all accessions, and “M” is the number of measured indicators.
Phenotypic data analysis
Statistical analysis of all phenotypic data across the four germination-related traits and five drought tolerance indices was conducted using the software SAS PROC GLM. (SAS Institute 1999). The broad-sense heritability (h2) [30] of each trait was estimated using the variance components. All of the above variance values can be calculated using the REML method for the SAS VARCOMP procedure.

Genotype identification and analysis
Genotype identification
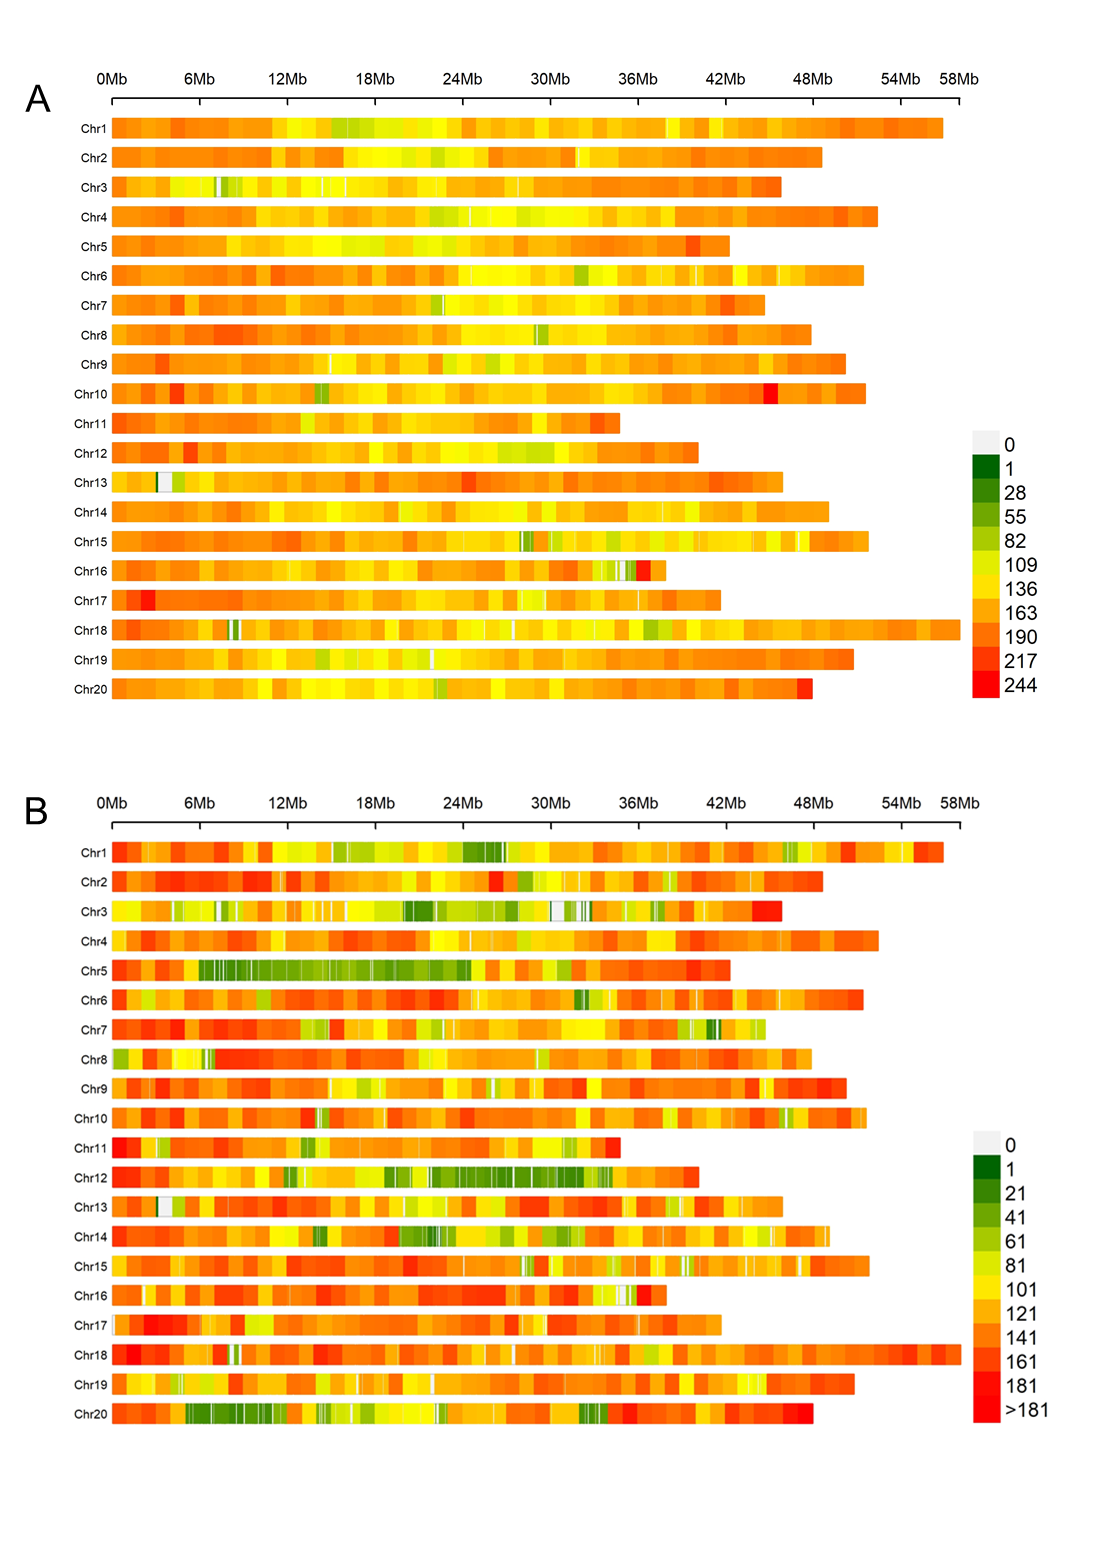
Genomic DNA was extracted from soybean seedling leaves according to the methods used by Kisha et al. [31], and DNA quality was detected by 1% agarose gel electrophoresis and a spectrophotometer. A genome-wide genotyping array containing 158,327 SNPs was applied to genotype the 410 accessions using the Illumina Infinium platform according to the manufacturer’s protocol (Illumina) [32, 33]. All SNP genotype data were treated with raw data normalization, clustering, and genotype calling using Illumina Genome Studio Genotyping Module (Illumina). The SNPs with a minor allele frequency (MAF) <0.05 and missing rates < 0.25 were removed to avoid problems of spurious LD and false positive associations. Finally, 117,811 high-quality SNPs were used for GWAS analysis. The SNPs were distributed relatively evenly across the 20 soybean chromosomes (Fig. S1).
Analysis of gene diversity, linkage disequilibrium, and population structure
We used PowerMarker v3.25 software to analyze MAF, PIC, heterozygosity, and gene diversity [34]; PLINK software to analyze the attenuation distance of linkage disequilibrium (LD) of the related population [35], and the R language for mapping [32]. We used half of the maximum distance for LD attenuation to identify LD blocks; this was the support interval we used for identifying significant SNPs related to a particular trait. We used multivariate analysis to classify the soybean accessions into subgroups, including cluster analysis with a neighbor-joining algorithm, model-based population structure analysis, and principal component analysis (PCA). Cluster analysis and the PCA were performed in TASSEL 5.0. When the eigenvalue is flat the subgroup structure is determined (after PC4 in our model), population structural analysis was performed using the admixture program [36].
Genome-wide association analysis
We performed a genome-wide association analysis using a mixed linear model (MLM) that accounted for kinship (K matrix) and population structure (PAC matrix) in TASSEL 5.0 [37]. The Loiselle algorithm [38, 39] was used to approximate the kinship coefficient between each pair of accessions in TASSEL 5.0. Significant SNPs were those with -log (P)>4.5 in MLM. Any significant markers positioned within a single LD block were viewed as one QTL region.