The results are presented and discussed in two parts: The annual cycle of key land-atmosphere parameters, and regimes of soil moisture, and spatial analysis of the indices of coupling between the land and the atmosphere during MAM.
3.1. Annual Cycles of Various Parameters
The annual cycles of P-E, SM and LAI were analyzed to assess the mean representation of these parameters over the key regions identified. In Central Africa (CA), which has two main rainfall seasons, P-E has the main peak in November and a secondary one in March, which coincides with SM (Figure 3). On the other hand, LAI has the main peak in April. Though CMIP6 models differ substantially in magnitudes during the peak P-E seasons, they do broadly capture the bimodal cycle in ERA5. Models in CMIP5 differ in simulating the seasonality and magnitudes of precipitation over Central Africa, though a general wet bias is maintained (Aloysius et al., 2016). Figure 3 shows that there is a consistent under-estimation of SM throughout the year except in the HadGEM3-GC31-LL model, which has a substantial overestimate. This may be related with LAI under-estimation in the models with the exception of UKESM1-0-LL and CanESM5. In this region, both SM and LAI peak together with rainfall, in both reference datasets and models. This is with the exception of CanESM5, which, despite having exceptionally high rainfall, depicts an unusual decline in the LAI between June and November.
Southern Africa has a unimodal pattern of P-E, peaking in January (Figure 3). With the exception of CanESM5 and MIROC6, most models indicate that the region experiences sustained moisture deficit throughout the year. In part, this is a weakness of the spatial averaging that includes the Namib desert. There are more pronounced magnitudes of divergence between the models during the DJF season as compared to the rest of the year. In this region, most models tend to overestimate SM, with the exception of GISS-E2-1-G and CanESM5, with the latter having a positive P-E. Similar to the CA, GISS-E2-1-G and UKESM1-0-LL stand out as models that, on average, have the least and highest LAI, respectively. Based on P-E, we note that models tend to show similarity during the dry seasons, and divergence during the peak rainfall season for both SM and LAI. This may hint that the representation of SM and LAI in the models is sensitive to rainfall biases.
Over East Africa, P-E is largely bimodal over both KE and SO (Figure 4), with the net moisture deficit dominating the Horn of Africa, while the rainfall seasons of OND and MAM, have excess rainfall in KE. Despite differences in the minor peak of P-E in November, the models have agreement that the peak of SM coincides with that of rainfall during the short rains season. CNRM-CM6-1, GISS-E2-1-G and HadGEM3-GC31-LL simulate the first peak of rainfall a month earlier, in October, while all models, though with a negative bias, consistently capture the time of the peak in April. MIROC6 is exceptionally wet with a late OND onset in November and an early onset in MAM and does not show a dry season between December and March. Consequently, soil moisture remains at peak levels from December to April. P-E peaks in October for CNRM-CM6-1, GISS-E2-1-G, HadGEM3-GC31-LL, and in December for MIROC6, while UKESM1-0-LL, with minimum bias, together with MRI-ESM2-0 and GFDL-CM4 place the peak rightly in November. Unlike observations, models have more rainfall during the short rains over the long rains season, with remarkable wet and dry biases respectively. Despite the differences in P-E, SM peaks in October-November and April for all models, except for HadGEM3-GC31-LL; peaks of LAI lag by a month.
In SO, P-E peaks in October, but it is largely overestimated by the models. P-E also peaks in April, but the corresponding seasonality of soil moisture is largely variable across the models. CanESM5 and GISS-E2-1-G have nearly invariant LAI at minimum, while at maximum, UKESM1-0-LL shows invariant seasonality. The rest of the models tend to oscillate in magnitude within the GIMMS annual range. SM peaks coincidentally with P-E while LAI lags behind by one month.
Results for West Africa and the Sahel in Figure 5 indicate that the seasonality is unimodal, with fair model agreement during the dry seasons and a large spread during the P-E peak during the West African monsoon season. In most models, vegetation peaks a month after the P-E and SM maxima. Models such as GISS-E2-1-G and UKESM-1-0-LL that underestimate P-E during the peak season, also underestimate SM throughout the year. HadGEM3-GC31-LL overestimates the soil moisture during the rainfall season in WA and underestimates it in the SH. On the other hand, vegetation peaks in October, with variable patterns of the seasonality across models. GISS-E2-1-G has the least vegetation while CanESM5 has the highest amount.
Utilizing CMIP5-ESMs, Mahowald et al., (2016) reported that some models do not clearly show the precipitation-vegetation response. This is despite the expectation that the LAI in the tropics is controlled by availability of moisture, unlike in the higher latitudes where the control of moisture by temperature is dominant (Zeng et al., 2013). Lack of such a relationship may point to a weakness in the model configurations, which may cause inaccurate representation of the boundary layer processes as well as the cycles of surface water, energy and carbon (Park and Jeong, 2021). This is likely to be true for GISS-E2-1-G and CanESM5 that show nearly invariant and low LAI in all regions over Africa, while UKESM1-0-LL overestimates this parameter. CanESM5 has erroneously decreasing LAI over Central Africa in June to October, with minimum and nearly invariant values over East Africa and the Sahel. Considering that the response of vegetation to climatic forcing is region-specific, it is important to be cautious in generalizing these results over Africa where we have a variety of vegetation cover (Wu et al., 2015). Given that vegetation plays a critical control in the process of evapotranspiration, inaccurate representation of LAI could introduce uncertainties in the cycles of both energy and water and potentially affect the characteristics of coupling between the land and the atmosphere (Williams and Torn, 2015).
3.2. Soil Moisture Regimes
In order to characterize the soil moisture regimes in regions highlighted in, soil moisture-latent heat scatter plots with Locally Weighted Scatterplot Smoothing (LOWESS) curves based on ERA5 are presented in Figure 6 for the months of March to May over the 1979-2014 period. In regions where SM can reach high levels, such as CA (>0.37 m3/m3) the response of HFLS to SM levels out, indicating transition into a wet regime. In the Sahel, given that March-May is a dry season, most soil moisture records fall below 0.06 m3/m3 and with minimal indication of latent heat response, which is indicative of a dry regime. Direct linear relationships between soil moisture and latent heat flux exist over East Africa (KE & SO), West Africa (WA) and to some degree, over SA (at lower SM levels). This indicates that during the March-May season, soil moisture is an important forcing to the fluxes at the lower boundary over the regions in the eastern, southern and western parts of Africa. The SH is too dry while the relationship only holds for lower SM levels in the CA.
SM forcing to the boundary layer fluxes exists in transition zones that fall in between dry and wet regimes (Figure 2). This is true for KE, SO, WA and partly SA (Figure 6). This analysis shows the potential for L-A coupling at different regions in Africa, depending on the seasonality of soil moisture. In dry soils, there is negligible SM forcing to HFLS while in saturated soils, HFLS is controlled by net radiation, which in turn depletes SM.
We investigate how models represent the regimes of soil moisture and latent heat flux for two case areas; a wet regime over Central Africa (CA) and a transitional zone over East Africa (KE). The results are presented in Figures 7 and 8 respectively. Over CA, MRI-ESM2-0 closely simulates the ERA5 patterns of soil moisture and latent heat flux. CNRM-CM6-1, GISS-E2-1G, HadGEM3-GC31-LL and UKESM1-0-LL though able to simulate the pattern of SM at low levels, do not correctly capture the pattern of HLFS at peak SM as in ERA5. In MIROC6 and CanESM5, the relationship is at minimum, with correlation scores of 0.17 and 0.29. On the other hand, GFDL-CM4 simulates an inverse relationship with a correlation score of -0.54, implying that HFLS depletes SM. The annual cycle results in Figure 3 indicated that MIROC6, CanESM5 and GFLD-CM4 similarly portrayed the highest positive P-E bias for most parts of the year.
Over KE, the models are able to simulate the soil moisture-latent heat relationship with correlations above 0.9 despite the biases in the magnitudes of the parameters under consideration, which is an indication that the patterns of land-atmosphere feedbacks over East Africa are well simulated in the models.
3.2. Land-Atmosphere Coupling Indices
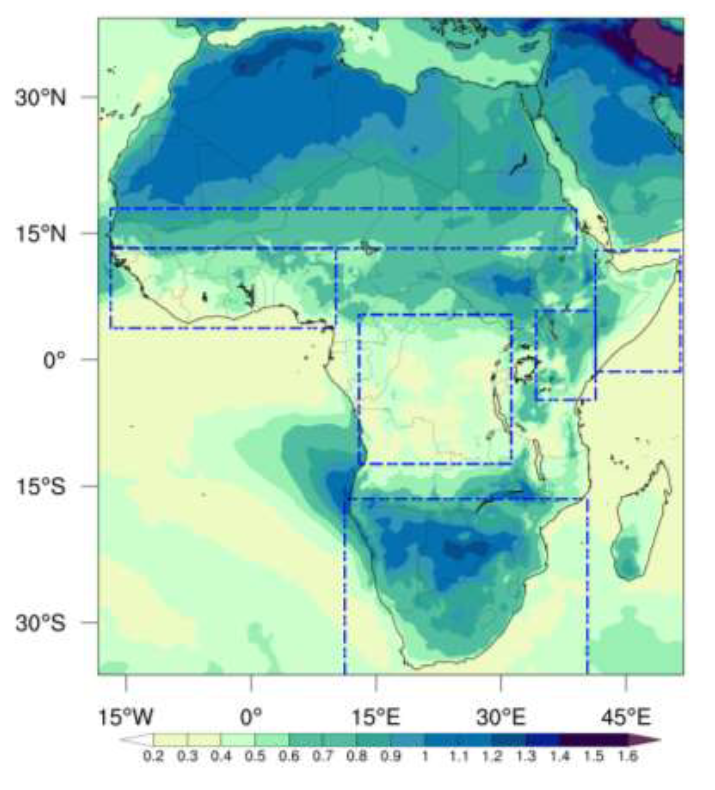
Terrestrial and atmospheric coupling indices based on ERA5 are presented in Figure 9. Regions of strong positive TCI (shown in brown) indicate robust coupling between SM and HFLS, while negative values (in green) indicate that surface fluxes increase at the expense of soil moisture, hence no coupling exists in these regions. The hatching indicates significant correlations at 95% confidence interval. Regions south of the Sahel, in East Africa and Southern Africa have strong soil moisture-latent heat coupling. In these regions, soil moisture forcing is a key driver for latent heat variability during the MAM season. The Sahara, though with significant correlations, does not have significant coupling as the variability of soil moisture is minimal being in a dry regime (Figure 6 and Supplementary plots, Figure S2). Central Africa, despite having the highest amounts of soil moisture, does not show a significant forcing of soil moisture on latent heat flux. It is only in this region where the correlations are not significant or are significant with negative sign. Given the seasonal and vegetation characteristics, evapotranspiration, driven by net radiation, is the major driver of surface fluxes over Central Africa. Given that MAM is an active rainfall season in equatorial Africa, the influence of soil moisture on lower boundary fluxes, especially over the eastern side, may contribute to the overall seasonal characteristics.
The ACI indicates that latent heat control of 2metre temperature exists over parts of East Africa, Southern Africa and south of the Sahel. The Sahara and Central Africa are regions where lower boundary temperature is not controlled by latent heat variability. These we also previously identified as dry and wet regimes respectively, Figure 6.
In general, L-A coupling exists where both the terrestrial and atmospheric pathways co-exist. This is true for East Africa and the regions south of the Sahel. In southern Africa, the region of strong ACI is shifted northward compared to TCI, indicating that the local coupling is sensitive to the northward shift of the rainfall which is a key forcing generating soil moisture anomalies. Interestingly, negative TCI and a positive ACI over Central Africa indicates that latent heat fluxes are associated with depleted soil moisture, and hence no coupling for both terrestrial and atmospheric pathways. Where coupling exists, positive anomalies of soil moisture would trigger anomalous increases in latent heat, which in turn raise the evaporative fraction, resulting in a negative anomaly of near surface temperature. The coupling patterns are sensitive to the prevailing climate conditions; in off-season regions in the Sahel, the soils are dry during this season, while in the southern Africa, presence of land-atmosphere coupling signal is indicative of soil moisture memory from the preceding months (Dirmeyer at al., 2009). Over East Africa, the existence of land-atmosphere coupling has been linked with the increase in surface temperatures during extended drought seasons when anomalously low soil moisture levels are recorded (Abera et al., 2018).
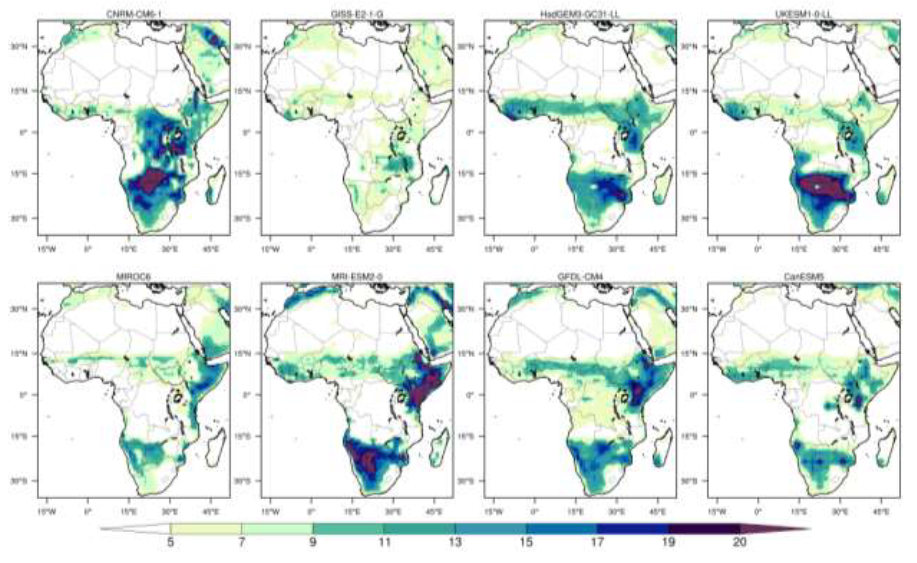
The coupling characteristics in ERA5 can be explained by the interannual the forcing variables; soil moisture and latent heat, shown in Figure 10. Indeed, significant forcing can only be exerted if the forcing variable is not constant and a degree of variability is triggered in the response variable. Given that correlations are significant in most regions over Africa, the inclusion of a measure of variability is therefore useful to overcome the weakness of simple linear relationships. The high variability of soil moisture and latent heat over East Africa, stretching to West Africa and parts of Southern Africa coincides with strong TCI and ACI, Figure 9. Isolated regions of peak variability accordingly correspond also to peaks in TCI or ACI. Less variability in the Sahara and in Central Africa is an indication of dry and wet regimes, respectively.
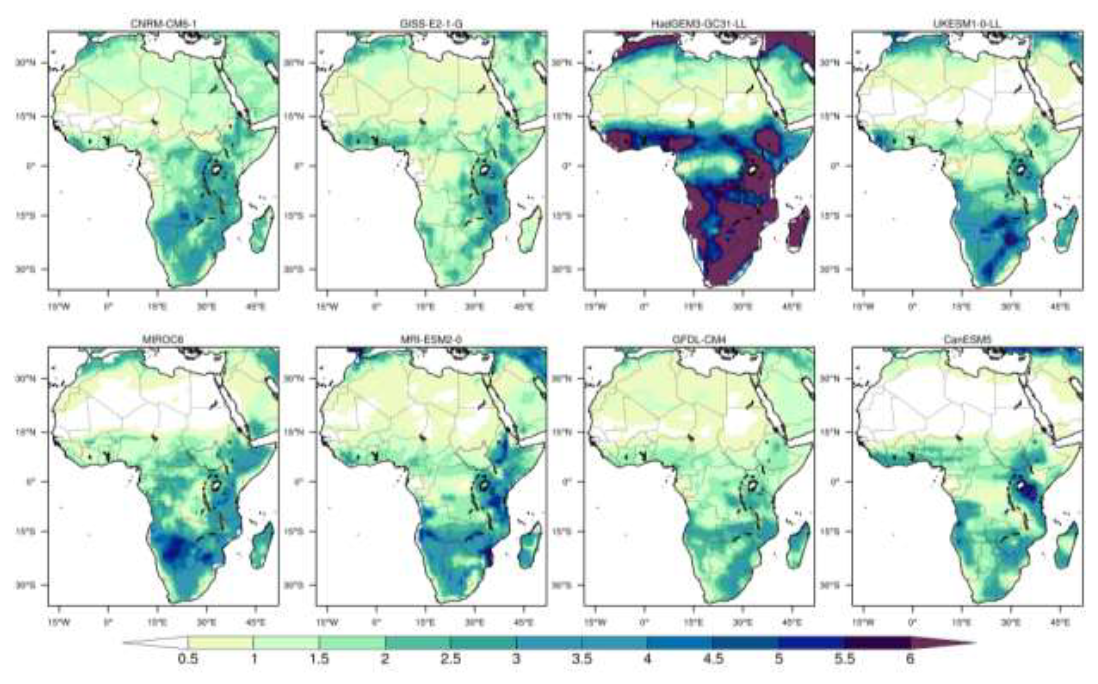
The results of TCI based on models are presented in Figure 11. GISS-E2-1-G and CNRM-CM6-1 have overall weakest TCI over Africa. The HadGEM3-G31-LL and UKESM1-0-LL MOHC models tend to overestimate the strength of TCI over most regions of Africa, including parts of Central Africa. The rest of the models, especially MIROC6, GFDL-CM4 and CanESM5, which could not properly simulate the soil moisture regimes over Central Africa (Figure 7), indicate an eastward and southern expansion to the region of lack of soil moisture-latent heat coupling (shown in green). Notably, MIROC6 indicates no coupling over the Ethiopian highlands. The south of the Sahel region, spreading from Ethiopia to West Africa, has much stronger TCI in HadGEM3-GC31-LL, UKESM1-0-LL and CanESM5. The coupling zone stands out in MIROC6 but is shifted northwards to about 15o latitude compared to the ERA5 pattern, which does not go beyond 13o latitude. Over Madagascar, there is no consensus between the models, although CNRM-CM6-1, MRI-ESM2-0 and GFDL-CM4 closely resemble the ERA5 data. In the East Africa region, models show good correspondence with ERA5, despite the tendency to overestimate the intensity with the exception of GFDL-CM4, CNRM-CM6-1 and GISS-E2-1-G.
Models with low and weak seasonality in LAI (Figures 3-5), such as CNRM-CM6-1 and GISS-E2-1-G, tend to have overall weaker TCI, without highlighting regions of strong coupling. This may be related to weakness in capturing evapotranspiration that has control on latent heat flux (Williams and Torn, 2015).
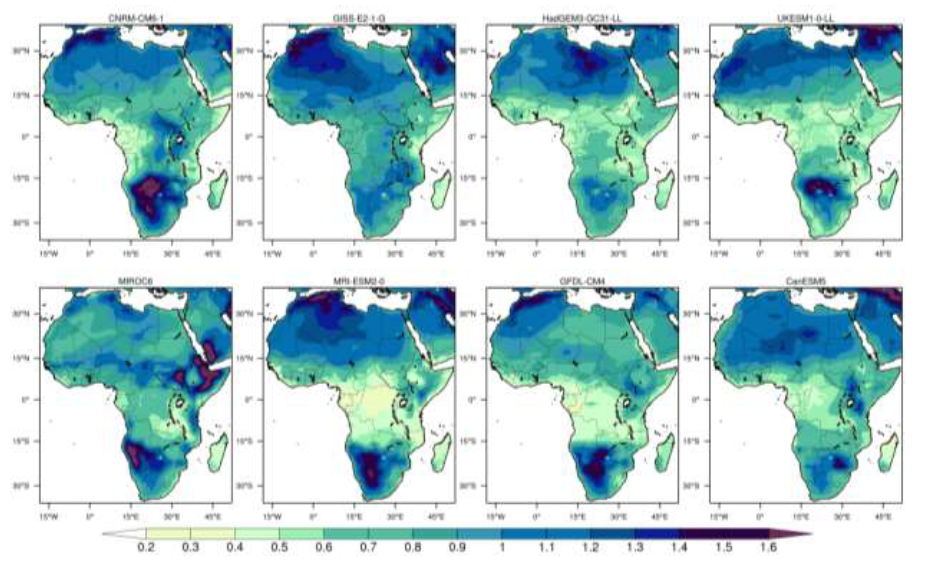
In Figure 12, ACI in models is presented. CNRM-CM6-1 stands out with strongest ACI over Southern, East and erroneously over eastern Central Africa, despite the model showing weak TCI all over Africa. This may be attributed to the high interannual variability in these regions (Supplementary plots, Figure S3) and a more pronounced negative bias in HFLS (Supplementary plots, Figure S5). The nature of the bias and variability may result in a weak response of the latent heat to the soil moisture, but an amplified signal in forcing to temperature. However, this pattern is not consistent through the models. This is an indication that the relationships are model specific, and the variability or biases of similar magnitudes do not generate comparable responses between models (Koster et al., 2009, Berg et al., 2009). Similar to the TCI, GISS-E2-1-G portrayed the overall weakest ACI with the exception of limited regions bordering Tanzania, Mozambique, Malawi and Zambia. However, these are not regions of coupling between latent heat and temperature based on ERA5. Although the mean biases of latent heat are not high, it shows that the variability of the variables are not strongly linked as both terrestrial and atmospheric pathways are weaker than in ERA5. The models presented generally show consensus on strong coupling over southern Africa, with exception of the eastern regions bordering Lesotho. Though with a tendency to extend the coupling southwards, models generally represent the coupling between latent heat and temperature in Southern Africa.
Over East Africa, MOHC models and GISS-E2-1G have the weakest ACI, with the rest of the models indicating signals of coupling between latent heat and temperature over southern Africa in agreement with ERA5. This coupling spans from the east of Lake Victoria towards the Horn of Africa extending northward while excluding the Ethiopian highlands. Similar to ERA5, a weaker coupling zone exists in the South Sudan-Chad-Central Africa Republic region extending westwards for CNRM-CM6-1 and GFDL-CM4.
Therefore, there is model agreement on the atmospheric pathway over Southern Africa, but differences exist over East Africa. Despite these differences, most models agree on the lack of coupling in the Sahara and Central Africa. This points to a realistic behavior of the models at the extremes of the SM spectrum. Largely, most models overestimate the terrestrial coupling leg over southern and eastern Africa. Previous results by Lei et al., (2018) and Dirmeyer et al., (2018) show consensus that most global models are biased to overestimate the strength of the coupling. Although both TCI and ACI are co-located in ERA5, this is not true over East Africa for GISS-E2-1-G, HadGEM3-GC31-LL and UKESM1-0-LL. This indicates that latent heat is not an important control of temperature in these models over East Africa. Given that MAM is the main rainfall season for East Africa, it may be hypothesized that the control of temperature is related to net radiation (cloud cover), rather than surface fluxes in these models.
GISS-E2-1-G has minimum variability of both the soil moisture and latent heat, and consequently, the strength of the coupling indices is damped. The strong variability in HadGEM3-GC31-LL soil moisture may be attributed to the consideration of a much shallower depth of 5cm. This results in a strong TCI. Despite strong variability of latent heat, temperature coupling is only strong over Southern Africa, where both variables tend to have significant variability. It is only in these areas, and some parts of East and West Africa, where the correlations are significant. Models tend to agree on high variability of temperature, soil moisture and latent heat flux over Southern Africa, (Supplementary plots, Figure S3 & S4), hence consensus on the coupling indices over this region. These results indicate that the mean biases are not necessarily determinants of the coupling patterns. Rather, the internal variability of the models determines the nature of the coupling. This makes the results specific to the models based on their varied parameterizations (Lei et al., 2018). Models that over-estimate the land-atmosphere coupling tend also to erroneously amplify temperature extremes, (Ukkola et al., 2018). GLACE-CMIP5 results by Zhou et al (2019) indicates that soil moisture coupling amplifies drought events in historical and future timescales. Historical observations have also confirmed that prolonged droughts are usually located in regions of strong LA coupling (Cook et al., 2010 and Miralles et al., 2014). Miralles et al., (2014) noted that even with pre-existing synoptic conditions, negative anomalies of soil moisture played a role in the intensification of the major heatwave events of 2003 and 2010 in Europe. It is therefore paramount that models accurately represent the land-atmosphere interactions in order to provide reliable information on the current and future climate hazards.