The study presents the concept of physical modelling together with the characterization of the modelling materials as well as the possibilities of applying this type of physical simulation methods for the analysis, design and optimization of industrial metal forming processes. The paper discusses the crucial similarity conditions between the physical model and the real process necessary to transform the results into industrial processes. Physical modelling is one of the most popular as well as cheapest methods of analyzing metal plastic forming processes and it can constitute an easy independent verifying tool. It can also be a competitive alternative or supplementation, or a quick verification, of the popular yet relatively expensive methods based on a broadly understood mathematical apparatus, e.g. the finite element method or various types of computer science techniques. The method provides the possibility to define the stress and deformation distribution, estimate the force parameters of the given process as well as localize the dead zones and material flow errors. On the example of a forward extrusion process, the study demonstrates the effect of matching the model material to two metallic materials: annealed aluminum and reinforced aluminum. Additionally, for reinforced aluminum, numerical modelling was performed, which made it possible to determine e.g.: the force parameters and the material flow manner. Next, based on physical modelling, verification through numerical modelling was made of the boundary and tribological conditions, as physical modelling revealed a so-called dead zone in the corner of the die, which had not been recorded in numerical modelling.
Research Article
Possibilities of Using Physical Modeling With Soft Materials to Analyze and Optimize Metal Forming Processes
https://doi.org/10.21203/rs.3.rs-115074/v1
This work is licensed under a CC BY 4.0 License
Version 1
posted
You are reading this latest preprint version
physical modelling
soft model material
forward extrusion
dead zone
validation of numerical modelling
During the designing of an industrial plastic forming process, it is often necessary to perform many tests and trials, which is connected with a large amount of time and costs, while the most important stage of design is the final verification of the developed process performed on a real material and under industrial conditions. There is still a search of methods and techniques serving as verifying tools which would facilitate the designing and optimization of plastic forming processes as well as make it possible to partially or completely eliminate the experiment stage, at least on the real material [1,2]. We can point to two main lines of such explorations, of which one is presently based on mathematical methods, i.e. continuously developed numerical computational techniques [3,4,5], and the other uses modelling and physical simulation methods [6,7]. The line of broadly understood numerical methods includes e.g.: the finite element method (FEM) and the finite volume method (FVM), as well as a whole spectrum of computer science tools (IT), which make it possible to develop mathematical models of various plastic forming processes as well as phenomena occurring in the deformed material [8,9,10]. Despite the undoubted usefulness of mathematical methods for process analysis, optimization and design, we should also mind their restrictions. The main curtailment in the application of methods based on mathematical techniques (FEM, FVM, IT) in a designing process is the lack of certainty of the correctness of the results due to certain assumed modelling simplifications, calculation errors, insufficient application experience and others. This causes the obtained results to be more or less in agreement with the reality, and it is assumed that the maximal error equals approximately 10%. Despite the fact that mathematical methods firmly change the meaning and range of the experiment on the real material, they remain the most expensive and time-consuming stage of the design and optimization process [11]. That is why an alternative as well as a certain kind of verification of such methods can be provided by physical modelling methods, e.g. with the use of another material or by way of performing an experiment in a scale [12]. Among them, a quite popular one is physical modelling with the use of soft modelling materials (based on synthetic or natural waxes and plasticines with the so-called modifiers, owing to which it is possible to obtain similarity of the modelling materials to the real metallic ones) [6,13]. This method is much cheaper and faster, and it constitutes, next to physical simulations, another main line in the development of methods supporting the analysis, design and optimization of plastic forming processes. Physical modelling with the use of soft modelling materials can be a separate tool in the design and analysis of the processes, with the consideration of the shape as well as the force, quality and quantity parameters, or it can cooperate with numerical modelling, thus providing the computer simulation with the necessary information on the behaviour of the deformed material as well as the boundary conditions, and it can also serve as a verifying tool [3, 9]. Physical modelling methods shorten the designing time as well as reduce the costs of the real experiment by using non-metallic soft modelling materials, which, through the application of various modifiers (chalk, kaolin, petrolatum, lanolin, etc.), make it possible to obtain the characteristics for almost all metallic materials. In the literature, we can find a vast amount of physical modelling applications for the analysis of industrial, mainly bulk metal, processes, in which compressive stresses dominate. Soft modelling materials, because of their unique construction, have found their application in the simulation of forging, extrusion, pressing and upsetting processes [3,9,14,15,16]. For example, to analyze extrusion processes, the authors have used physical modelling [17,18]. We can also find studies which apply a soft metallic material (usually Pb at ambient temperature for the simulation of another material), which very well simulates e.g. hot deformation of steels [7,19]. The choosing of a suitable material is closely dependent on the simulated case and, to a lesser degree, on the measurement method. For example, in turn, when the experiment needs large plastic deformations, a more ductile soft material should be used [20], e.g.: plasticine with petrolatum and lanolin additions [13]. In order to simulate cracking, hard paraffin wax is used, which highlights the micro surface cracks as well as macrocracks [14,21,22]. In turn, in paper [23] the authors analyzed the behavior of soft materials in the aspect of Fracture and adhesion phenomena. The biggest changes in the properties and application of modelling materials can be obtained through modification of their composition by way of introducing modifying additions in various amounts, in a loose, solid or semi-solid form, such as: kaolin, lanolin, paraffin, chalk, petrolatum, sugar, salt, etc. Other changes in the properties of modelling materials can be obtained by way of changing the strain rate and temperature of the process, which makes it possible to obtain any model of yield stress-deformation curves for different real metallic materials [24]. The possibility to transform the physical modelling results into industrial processes relies on maintaining the material's similarity conditions mainly in the plastic and elastic scope as well as the conditions of geometrical similarity, and thermal and dynamic friction [6,20,25]. Usually, the selection of the modelling material is determined depending on the modelled process – through the selection of similarity conditions, which are the most important for the process, as ideal preservation of all the conditions is impossible. In plastic processing, such a condition is the material's similarity in the plastic scope. The condition is fulfilled when the modelling material during deformation behaves similarly to the real material. This means that the work hardening curve characteristics for the modelling material determined in any plastometric test is close to the shape of the curve for the given metallic material. The paper [26] describes and reviews different constitutive models for soft materials. In most of the articles on the application of physical modelling with the use of soft model materials based on the filia wax and plasticine, the authors, in the case of the similarity condition, apply the Alder and Philips model, where the hardening "n" and strain rate "m" exponents for the model and real material must be equal [6,9,12,21,22].Another mathematical description of this condition can be found in [9,27], where, after the characteristics for the real and modelling material have been determined, in the first place, the so-called scale factor is established, which combines both characteristics, and next, the mean-square error is calculated, the value of which, when it's closest to zero, points to very good matching of the curve of the modelling material to the curve of the real metallic material. Owing to this, it becomes much easier to select the optimal modelling material which guarantees the best simulation of an industrial process or a physical phenomenon.
The aim of the study is to analyze the effect of the matching of the modelling material to the actual metallic material in a forward extrusion process and use the physical modelling results for a verification of the numerical modelling of the process.
Both processes (real and physical modelling) were performed in the flat deformation state in ambient temperature (22 °C). Fig. 1a shows a diagram of a forward extrusion. The industrial process was conducted in tools made of metal and mounted on a hydraulic press with the load of 1 MN (due to higher forming forces) shown in Fig. 1b. The tools used for physical modelling (steel dies and a wooden punch – due to lower forming forces) were mounted on a special horizontal press for physical modelling. Fig. 1c presents a photograph of a stand used for physical modelling, which is constructed from: the main table top (1), with a die (2) and a movable punch (3) with slideways (5), to which a force sensor is connected (4). The process of sample extrusion from the modelling materials (6) realized on this device was recorded through a glass pane (7) by means of a digital camera. The physical modelling and real process was performed at the linear velocity of the punch 0.12 mm/s, which corresponded to the mean deformation rate 0.01 s-1. The physical model was made in the scale 1:1 in respect of the actual process. A square coordinate grid, side 2.5 mm, has been plotted onto the surface of the sample, which was used to determine the deformation distribution. During the extrusion process, through the glass pane, the deformation of that grid was recorded by means of a digital camera.
The real process was conducted for two types of aluminum: annealed and reinforced. As model materials, synthetic filia wax and plasticine were used, to which various modifiers (including kaolin, lanolin) were added, causing changes in the nature of the flow curves, mainly causing an increase in the level of flow stress, so that they could simulate materials with strain hardening.In order to maintain the tribological similarity conditions, detailed examinations were performed aiming at selecting such lubricants which would make it possible to obtain a similar friction coefficient in both the physical model and the real process in a ring test. For both types of aluminum, magnesium stearate was used, and for soft model materials, technical Vaseline was applied.
In the first place, the characteristics of the flow curves for the selected metallic materials were determined in a compression test (Fig. 2), which represented the cold metal forming processes (annealed Al) and warm metal forming processes (reinforced Al).
Such materials were selected so that it would be possible to demonstrate, based on the proposed plastic similarity condition, how the value of matching of the modelling material to the metallic one affects the accuracy of the obtained results. The forward extrusion process was purposefully performed for two types of aluminum, whose flow curves are different in character. The determined coefficients of sensitivity to the deformation speed m (in the range of 0.001 to 0.1 s-1) were respectively: 0.03 for reinforced aluminum and 0.04 for annealed aluminum.
Next, for both of these metallic materials characterizing cold and warm bulk metal forming, appropriate mixtures of model materials were then selected to best simulate the behavior of metallic materials.
Based on the macroscopic analysis, large differences in the flow pattern of individual materials were observed. For annealed aluminum, characterized by strong deformation hardening, the material deformation distribution is very uniform in the cross-section of the sample.
This is evidenced by the constant bending of the coordination grid lines perpendicular to the extrusion direction. In the case of hardened aluminum showing a slightly less hardening, the deformation is mainly located in the areas close to the die. The radius of curvature (Rin) of the coordination grid lines perpendicular to the extrusion direction in the central part of the sample for reinforced aluminum (Fig. 3a) is smaller than that for annealed aluminum (Fig. 3b). However, in the case of the radii of curvature of the line at the outer walls (Ro) of the sample, the situation is the opposite for both type of aluminum. For all the materials, in the first phase of the extrusion process, there is a rapid increase in force (Fig. 3c) caused by the upsetting of the material placed in the container. The upsetting is due to the slight difference in dimensions between the container and the material to be squeezed out, necessary for the material to be freely inserted into the container. The main extrusion process then begins with the material filling the die and then flowing out of it; at this stage of the process, the extrusion force increases further. Only at the end of the extrusion process does the extrusion force decrease due to the reduction of the friction surface. The courses obtained for both types of aluminum are very similar, only the extrusion force of the reinforced aluminum is about 7% lower than that for the annealed aluminum. This may be due to the slightly greater sensitivity of the material to the strain rate in the case of annealed aluminum (m=0.04).
The selection of the modelling material for both types of aluminum was made based on the similarity condition of the material in the plastic scope developed by the authors [9]. It assumed a quantitative assessment of the matching degree of the shape of the yield stress-deformation curves for the modelling material and the actual material; two parameters are determined: the scale factor:

and the similarity coefficient:

where:

yield stresses of the real material in point i,

yield stresses of the modelling material in point i,
k – number of points on the reinforcement curves of the modelling material and the real material, for which the similarity coefficient t was determined.
The coefficient t is a non-dimensional quantity, which makes it possible to determine simply and quickly the degree of matching of the reinforcement curve of the model material to the real material.
In the case of a theoretically ideal matching of both curves, this coefficient should equal zero. Fig. 4 shows a graphic interpretation of the quantities present in equations (1) and (2). Of course, both the scale factor and the similarity coefficient t, in the analyzed case, were determined as average values for the three strain rates (0.001 to 0.1 s-1).
On this basis, many mixtures of model materials have been tested and their characteristics were determined in upsetting tests (Fig. 5).
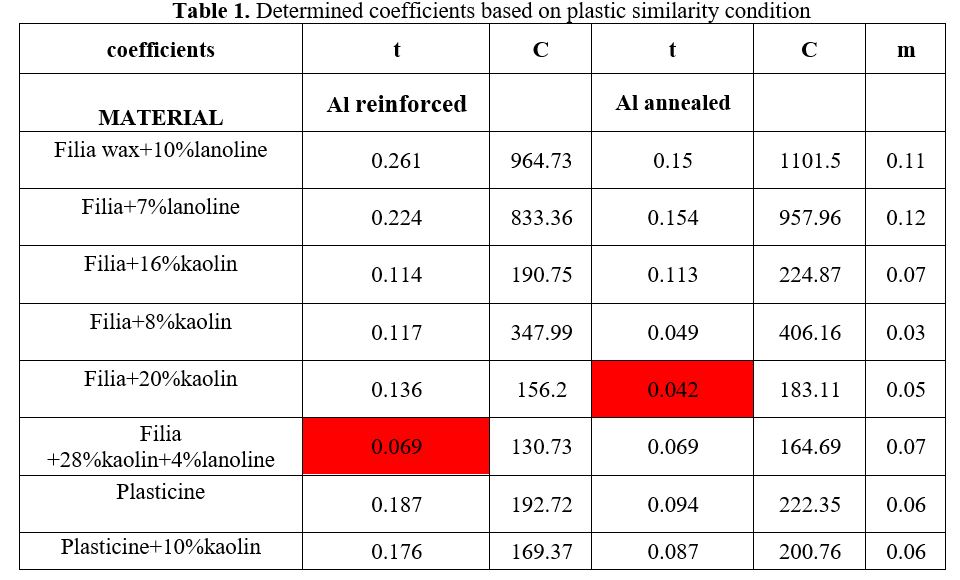
Finally, for reinforced aluminum characterizing in low work hardening, a mixture of filia with 20 % kaolin was ultimately chosen, for which the respective coefficients were t = 0.042 and C = 183.11. For reinforced aluminum, the best match was obtained for filia with 28 % kaolin and 8 % lanolin, where the scale factor C= 130.73 and the similarity coefficient t = 0.069 were determined (Table 1). Fig. 6a shows an examples the courses of the yield stress for the applied mixture as well as reinforced aluminum with the strain rate 0.01 s-1 and Fig. 6b for the second pair of materials.
In the case of annealed aluminum, which has very strong reinforcement a problem with the selection of the modelling material was encountered. Studies of modelling materials have shown that through an increase of the kaolin content, it is possible to obtain mixtures of increasingly high work hardening; however, a kaolin addition in the amount of over 20 % lowers the limit deformations and such a material tends to crack faster than the real material. The strongest work hardening as well as highest limit deformations corresponding to the real materials were obtained for a mixture of 68 % filia 28 % kaolin and 4 % lanolin. The relatively high value of the similarity coefficient proves poor matching of the modelling curve to the real material.
Based on the analysis of the above data, we can notice significant differences in the character of the course of both curves, especially for big deformations, which is also confirmed by a relatively high value of the similarity coefficient t.
Physical modelling of forward extrusion in flat deformation state
Based on the presented results for both modelling materials best matched to both types of aluminum, extrusion processes were performed, which were then compared for both compiled pairs of materials. As the lubricant, magnesium stearate was used for both aluminum types, for which µ equaled 0.05. In turn, in the physical model, petrolatum was applied, which was placed in specially made grooves on the surface of the samples. For such conditions, and for different modelling material compositions, the obtained friction coefficient µ equaled 0.055. In the modelling processes, similarly to the actual ones, the extrusion force in the function of the punch path was recorded. In order to compare both courses, the results obtained from the physical modelling were recalculated into the actual process through their multiplication by the scale factor C. Fig. 7 shows the courses of the extrusion forces as well as comparative macro-analyses of the deformed samples with coordinate grids, and also the distributions of the equivalent deformation on the surface for this pair of materials obtained with the use of a digital image analysis program, ASAME. The character of the force course obtained from the physical model after a proper transformation is similar to the course obtained in the real process (similarity coefficient t=0.042).
In turn, the level of the force in the modelling process is about 10 % lower than that in the actual process. This can result from the slight differences in the shape of the work hardening curves between the modelling material and the real material, as well as the slightly different friction conditions present in both processes resulting from a few times lower pressures, and also a bit smaller dead zone in the die area for the modelling materials in respect of aluminum. Based on the presented results, it can be stated that, in the physical model, the manner of material deformation was very close to the flow manner of the actual material, which is also confirmed by the distribution of the equivalent deformation for this pair of materials obtained by means of the ASAME program.
A similar comparative analysis was performed for the other pair of materials. i.e. annealed aluminum and the mixture of filia with 28 % of kaolin and 4 % of lanolin. In this case, both the force courses and the deformation of the coordinate grid for the physical process significantly deviate from the actual process (Fig. 8). Such results could be expected, as the similarity coefficient had the highest value of all the examined material pairs and it equaled t = 0.069.
Additionally, the modelling material demonstrated cracks in the areas of biggest deformations. Despite intense attempts to select a modelling material for annealed aluminum, it was impossible to find an appropriate wax mixture which would properly reflect the behaviour of the actual material during plastic deformation. Also the distribution of equivalent deformation obtained from the ASAME program for the material pair of annealed aluminum and for the mixture of filia with 28 % kaolin and 4 % lanolin (Fig. 8c) shows the biggest differences in reference to the previous pairs of materials.
Moreover, it should be noted that the biggest discrepancies in the deformation distributions for the particular pairs of materials are located in strongly deformed areas, where very high deformation of the coordinate grid is observed. These differences can result from damages of the grids in these areas, which, in turn, made it difficult to interpret the grids by means of the image analysis system ASAME.
Numerical modelling of forward extrusion in flat deformation state
Numerical modelling of the forward extrusion process was performed for all the real materials. This study only presents the test results referring to reinforced aluminum extrusion in the flat deformation state. This material was selected because, in physical modelling according to the new plastic similarity condition, for this material, the similarity coefficient t = 0.042 had an intermediate value among all the other pairs of materials. The numerical thermo-mechanical model of the actual process was constructed by means of the Marc Mentat program. The yield stress-deformation curves for annealed aluminum were run in a numerical form for different values of deformation, deformation rate and temperature. For the discretization of the deformed material, 1280 quadrangular elements type Solid 11 were used (Quad 4). An automatic reconstruction of the deformed grid was applied, with a change of the number and density distribution of the elements, due to the deformation and penetration of the element into the tools. In the numerical model of the reinforced aluminum extrusion process, all the tools. i.e. the die, the punch and the container, were assumed as rigid. The assumed boundary conditions were close to those present in the actual process. The Coulomb friction model was applied as well as the following heat transfer coefficients: for aluminum– specific heat 0.92 kJ/(kgK) and thermal conductivity 203 W/(mK) and for the steel tools – specific heat 0.46 kJ/(kgK) and thermal conductivity 15 W/(mK). Initially, in numerical modelling, a constant value of the coefficient of friction was introduced for the particular tools, equaling 0.05, determined in a ring test. For such deformation conditions, the manner of material flow obtained from FEM (Fig. 9a) only slightly deviated from the actual process. In turn, the level of extrusion force in the function of the punch path (the maximal extrusion force equaled 62 kN) was over 15 % lower than that in the actual process (Fig. 9b). Also, we should note that, in numerical modelling, it was not possible to obtain the formation of a dead zone for the same deformation conditions, which had been observed both in the actual process and, to an even higher degree, in the physical modelling. Probably, the cause of those differences was the assumption of a constant value of the coefficient of friction for the entire tool (punch, recipient and die) in the numerical model. In the actual process, as well as the physical one, probably as a result of poor lubrication in the area of the die impression, a discontinuity of the lubricant layer was observed, and the coefficient of friction reached values over 0.05, as it was assumed in the numerical model.
Next, numerical simulations were performed for higher values of the coefficient of friction. Ultimately, similar manners of material flow as well as course of the extrusion force were obtained in the numerical model and the real process when different coefficients of friction were assumed for the particular tools.
For the punch, the coefficient equaled 0.05, for the container, it was 0.1 and for the die, 0.25. Fig. 10a shows the obtained courses of the force in the function of the punch path for numerical modelling, for new friction conditions, as well as for the actual process. In turn. Fig. 10b demonstrates the analyses of both the similarity of the material flow manner and the deformation distributions by means of the image analysis program ASAME, as well as the results obtained from FEM.
After the introduction of new boundary conditions into the numerical model, the obtained results were very close to those in the actual process. Only the extrusion force in the numerical model was about 5 % lower than that in the real process. This difference can result from the fact that the numerical model referred to the flat deformation state and differed from the actual process in that it did not consider the friction forces between the side wall of the sample and the container.
As it has been demonstrated by the presented investigation results, during the designing of plastic forming processes by means of FEM, it is difficult to perform a correction of the boundary conditions as, for that, the information obtained in the actual process is needed. And so, for the verification of the model, we can use the physical model. However, in such a case, we should consider the fact that this model can be burdened with errors resulting from insufficient matching of the modelling material to the actual one, as well as slightly different other properties of the modelling materials. Nevertheless, the presented results demonstrate good agreement and confirm the possibility of applying physical modelling for the analysis and verification of both numerical modelling and the actual process of forward extrusion.
The study discusses physical modelling, its concept and the conditions necessary to transform the results into the actual process, as well as the use of a physical model for the analysis, verification and optimization of plastic forming processes. Physical modelling, which uses soft modelling materials, makes it possible, at low costs, to examine the operation of many factors which are difficult or impossible (for various reasons) to examine in real processes. Even with a low experience of the scientist, it makes it possible to pinpoint much easier the errors made during the experiment in respect of the numerical modelling, for which precisely physical modelling can constitute a way of verification. The basic limitations of physical modelling are the problems connected with transforming the modelling results into the actual processes, resulting from difficulties in maintaining all the similarity conditions. The performed tests showed that the selection of the modelling material is the key factor in the construction of a proper physical model, which is strictly connected with the plastic similarity condition. In the case of the selection of a modelling material for reinforced aluminum, the best matched mixture was filia with 20% kaolin and for this pair, the similarity coefficient equalled 0.042. Such a value of matching guarantees the proper material flow, yet a slightly lower accuracy of the extrusion force representation. In turn, in the case of the second pair of materials: annealed aluminium with the optimal mixture filia+28%kaolin+4%lanolin, where the similarity coefficient equalled 0.062, the flow manner of the modelling material was not that close to that of the metal; even bigger differences were exhibited by the courses of extrusion forces. On this basis, we can state that, in the case when the matching of the modelling material to the real material is at a level above 0.07-0.08, the results from the physical modelling are burdened with a great error (especially the force parameters) and should not be used. Also, in the case of the applied modelling materials based on filia wax with inoculants, their selection for the real materials characterizing in a cold plastic treatment still constitutes a big challenge. Additionally, the conducted numerical computer simulation of the actual processes of forward extrusion of reinforced aluminum confirmed the correctness of the performed experiments by means of physical modelling of those processes. The physical modelling enabled a verification of the friction conditions assumed in the numerical modelling as well as identification of a dead zone in the corner of the die, which was not formed in the numerical modelling of this process.
Author Contributions: Conceptualization: M.H.; methodology: M.H.; validation. M.H.. M.S.; formal analysis. M.S.. M.W.; investigation: M.H.; M.S.; M.W.; resources. M.H.; data curation. M.H.; writing—original draft preparation: M.H.; writing—review and editing: M.H.. M.S.; visualization: M.S.; M.W; supervision: M.H.; project administration. M.S.; M.W.; M.H.
All authors have read and agreed to the published version of the manuscript.
Funding: This research received no external funding.
Conflicts of Interest: The authors declare no conflict of interest. The funders had no role in the design of the study; in the collection, Analyses, or interpretation of data; in the writing of the manuscript, or in the decision to publish the results.
- B-A.; Doegea. E.; et al. Precision forging processes for high-duty automotive components. J Mater Process Technol.. 2007. 185(1–3). 139–146.
- Milutinović. M.; Vilotić. D.; Movrin. D. Precision forging – tool concepts and process design. J TechnolPlast.. 2008. 33(1–2). 73–89.
- B.P.P.A.; Rodrigues. J.M.C.; Martins. P.A.F.; Bay T. Physical and numerical simulation of the round-to-square forward extrusion.Journal of Mechanical Working Technology. 2001. 112. 244-251.
- M.; Jakubik. J. Analysis of forging defects for selected industrial die forging processes. Engineering Failure Analysis. 2016. 59 396–409.
- Hawryluk, M.; Mrzyglod, B.; Gronostajski, Z.; et al., Application of artificial neural networks in the analysis of mechanisms destroying forging tools, Archives of Metallurgy and Materials. 2020. 65(1). 193-200.
- T. Physical modelling of metalprocessing. Procestechnics Institut. Laboratoriet for MekaniskeMaterialeprocesser; DanmarksTekniskHojkole. 1988.Danmark.
- M.; Polak. S.; Gronostajski. Z. Jaśkiewicz. K. Application of physical similarity utilizing soft modeling materials and numerical simulations to analyse the plastic flow of UC1 steel and the evolution of forces in a specific multi-operational industrial precision forging process with a constant-velocity joint housing. Experimental Techniques. 2019. 43(2). 225-235.
- M.; Mrzygłód B..A durability analysis of forging tools for different operating conditions with application of a decision support system based on artificial neural networks (ANN). Eksploatacja i Niezawodność - Maintenance and Reliability 2017. 19(3). 338-348 (2017).http://www.ein.org.pl/sites/default/files/2017-03-04p.pdf.
- M. The influence of the condition of plastic similarity on the accuracy of physical modeling of extrusion processes.PhD thesis. Wroclaw University of Science and Technology. Wroclaw 2006.
- T.;. Kumar D.; Pratihar. D.I. Expert system to predict forging load and axial stress. Applied Soft Computing 11(1): 744–753 (2014).
- Mrzyglod, Barbara; Hawryluk, Marek; Janik, Marta; et al., Sensitivity analysis of the artificial neural networks in a system for durability prediction of forging tools to forgings made of C45 steel, International Journal of Advanced Manufacturing Technology. 2020. 109(5-6). 1385-1395.
- V.; Altan. T. New concepts in die design — physical and computer modelling application. Journal of Material Processing Technology.2000. 98: 212-223.
- Ł.; Lis. K. ; Pater Z. Plastometric tests for plasticine as physical modelling material.Open Engineering. 2016. 6(1): 653-659.
- G.C.; Padjen. G. Hot strip mill edging practices and plasticine modelling.34th MWSP Conf. Proc.. ISS-AIME. 1993. 30. 3-12.
- H.W. et. al. A Study on the rolling of I-section Beams.International Journal of Machine Tools and Manufacture.1994. 34(2): 147-160.
- M.M.; Sadeghi. M.H. Simulation and physical modeling of forging sequence of Bj type outer race international. Adv Mater Res.. 2010. 83–86. 150–156. https://doi.org/10.4028/www.scientific.net/AMR.83-86.150.
- M.; Singh A.K.; Singh. P.; et al. Experimental investigation of the effect of die angle on extrusion process using plasticine. Exp Tech.. 2010. 35. 38–44.
- H.; Gedikli. H. Physical and numerical analysis of three dimensional extrusion process. Comput. Mater Sci.. 2004. 31(1–2), 113–124.
- Z. et. al. Analysis of forging process of constant velocity joint body. Steel Research International. 2008. 1. 547-554.
- A.E.M.; Cetlin. P. Similarity of ductility between model and real materials.Journal of Material Processing Technology. 2000. 103. 434-438.
- M. Prevention of defects in forging by numerical and physical simulation.Technical University of Denmark Institute of Manufacturing Engineering. 1996.
- M.; Henningsen. P.; Bay. N.; Wanheim. T. Simulations of defects in metal forming.Journal of Mechanical Working Technology. 1994. 45. 527-532.
- Creton, Costantino; Ciccotti, Matteo, Fracture and adhesion of soft materials: a review, Reports on Progress in Physics , 2016. 79(4).Article No: 046601.
- M.F.; Maranon. A.; Silberschmidt. V.V. Material model for modeling clay at high strain rates. Int. J. Impact Eng.. 2016. 90. 1–11.
- K.; Liechty. B.; Sorensen. C. Thermomechanical similarity between Van Akenplasticine and metals in hot-forming processes. J Strain Anal Eng Des.. 2008. 43(5):383–394.
- Xiang, Yuhai; Zhong, Danming; Rudykh, Stephan; et al., A Review of Physically Based and Thermodynamically Based Constitutive Models for Soft Materials, Journal of Applied Mechanics-Transactions of the Asme., 2020, 87 :11, Article Number: 110801.
- Z. Hawryluk. M. Analysis of metal forming processes by using physical modelling and new plastic similarity condition. 10th ESAFORM Conference on Material Forming AIP Conference Proceedings. ISSN 0094-243X. 2007. 907. 608-613 Zaragoza.
Due to technical limitations, table 1 is only available as a download in the Supplemental Files section.