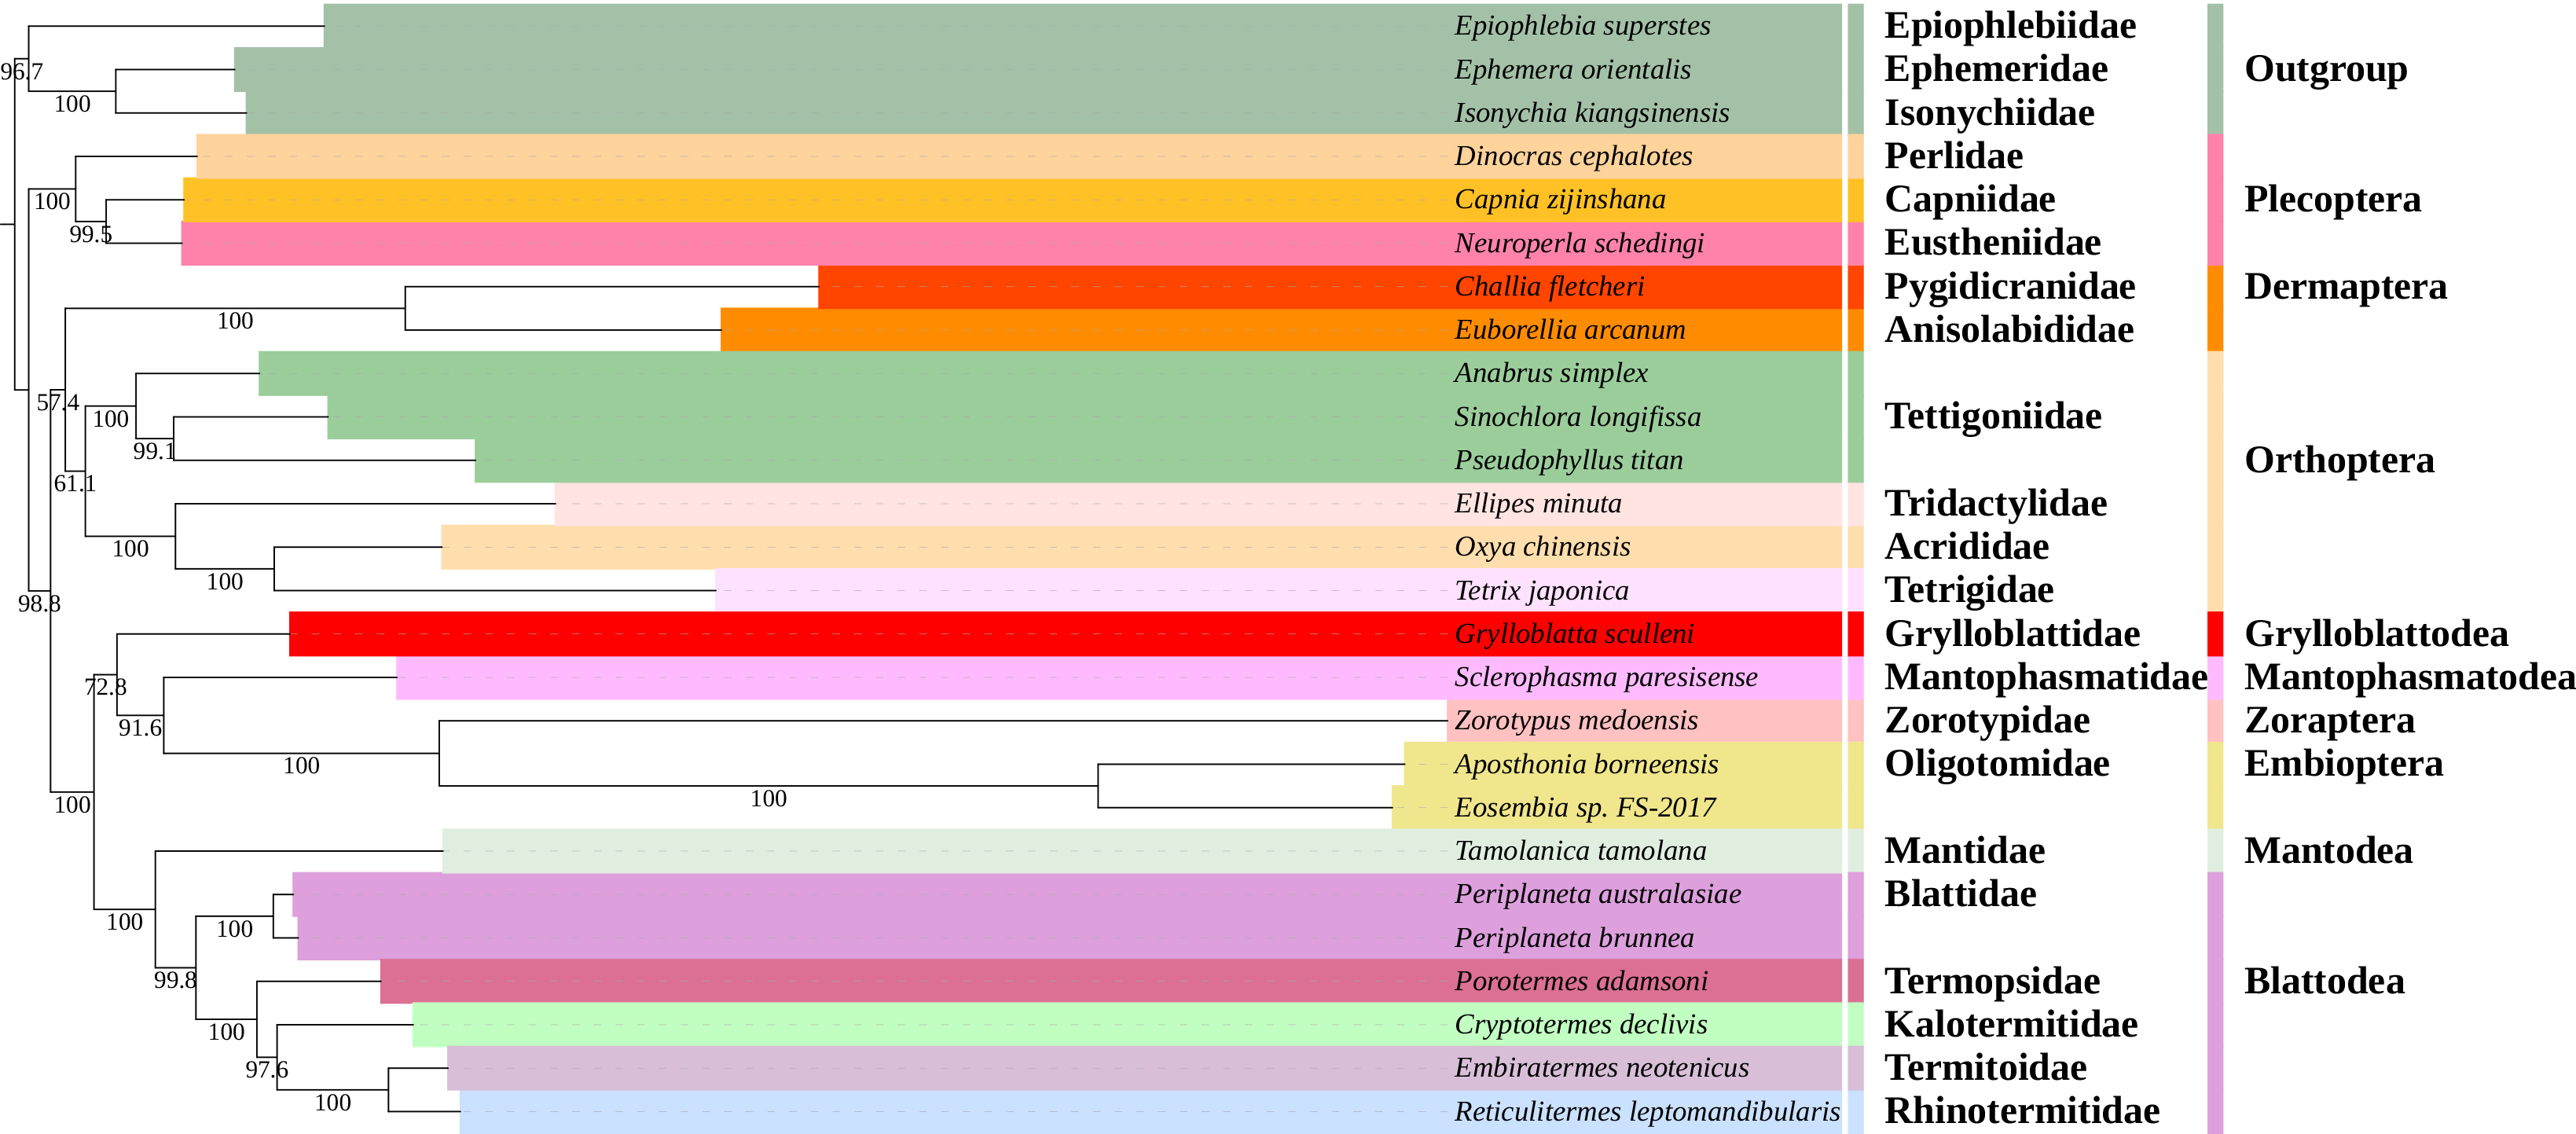
Fifty-four new mitogenomes
The 54 newly determined mitogenome sequences are available from GenBank (Additional file 1: Table S1), including 53 Caelifera species and 1 Ensifera species. The size of the complete mitogenome sequences of 54 species ranges from 14,957 bp to 16,437 bp. The mitogenomes of all species contain a conserved set of 37 genes, including 13 PCGs, large and small rRNAs (rrnL and rrnS), 22 transfer RNAs (tRNAs) and a large non-coding region called the A+T-rich region or control region. Among all the Caelifera mitogenomes sequenced in this study, there is an arrangement order translocation of trnK and trnD (KD rearrangement) was found in 52 species except Yunnantettix bannaensis (Caelifera: Tetrigidae). The KD rearrangement was also not found in Ruidocollaris convexipennis (Ensifera: Tettigoniidae), but trnY-CR-cox1 rearrangement occurred.
The new model and its fit to training dataset
The amino acid exchangeability rates and amino acid frequencies of the new model are shown in Table 1. The exchangeability rates between different amino acids varies widely. The highest exchangeability rates (between Asp (aspartic acid) and Glu (glutamic acid), 10.55) is 196,311 times higher than the lowest (between Arg (arginine) and Phe (phenylalanine), 0.00005). The amino acid frequencies of different amino acids are also different, from 0.01 (Arg) to 0.16 (leucine, Leu).
We evaluated the fit of the new model on the training dataset. Table 2 shows significant likelihood improvements of the new models (Q’) over the initial model during the model training process. The first iteration contributed about 98% of the total likelihood improvement. The optimization process of the new model was terminated after the third iteration, as the gain from the third iteration was insignificant. It is obvious that likelihood and AIC improvements of the final model (Q’ = mtOrt) over the initial model (mtInv) are significant (i.e., 1943.112 and 3470.224, respectively). Compared with the initial model (Q), the new model (mtOrt) fit the training dataset better, which is confirmed by the likelihood improvement and better AIC score of the new model [29]. The score guarantee that the likelihood gain of the new model comes from their genuine fit and overwhelm the penalty of free parameters [9, 28].
Model evaluation
The robustness of new model
The mtOrt model was estimated from the training dataset containing 89.4% of the Orthoptera mt protein sequences. To examine the robustness of the mtOrt model, we estimated additional models from three other datasets, namely mtOrt_O, mtOrt_C and mtOrt_E (Additional file 2: MtOrt_4.nexus.txt). MtOrt_O estimated from the dataset consisting of all Orthoptera mt protein sequences (283 species). MtOrt_E estimated from the dataset containing all Ensifera mt protein sequences (91 species). MtOrt_C estimated from the dataset containing all Caelifera mt protein sequences (192 species). The correlation of frequency vectors between mtOrt and mtOrt_O is equal to 1 and the other are close to 1. The correlations of exchangeability matrices between these four models (Table 3) are significantly higher than that between mtOrt and existing models (Table 4), especially the correlation between mtOrt and mtOrt_O is almost 1. The comparison of frequency vectors of the four models estimated by different datasets revealed that there was no significant difference in the amino acid frequencies between all models, and the p-value range is from 0.437 (MtOrt_E - MtOrt_C) to 0.973 (MtOrt - MtOrt_O) (p > 0.05). The comparison of exchangeability matrices of the four models also showed that there was no significant difference in the amino acid exchangeability rates between all models, and the p-value range is from 0.999998 (MtOrt - MtOrt_E and MtOrt_E - MtOrt_C) to 1 (MtOrt - MtOrt_C) (p > 0.05). These results further indicate that mtOrt model fits the orthopteran mt protein dataset better than the existing models and is a robust model with parameters stability.
Model comparisons
We measured the correlations between mtOrt and other 11 widely used existing models (Table 4). For the exchangeability rate matrices, the lowest correlation among the 12 models is between mtPan2013 and LG models, and the highest is among JTT, mtDeu and mtPro models. Compared with the new model, mtInv is the closest model to mtOrt in terms of exchangeability rates and LG has the lowest correlation. For the frequency vectors, the lowest correlation among the 12 models is between Dayhoff and mtInv models, and the highest is among JTT, mtDeu and mtPro models. MtPan2013 model is the closest to the amino acid frequency of mtOrt model and Dayhoff has the lowest correlation. MtInv, mtMet and mtPan2013 are most highly correlated with mtOrt and have significant correlations, both in exchangeability matrix and frequency vector (p<0.01).
Based on the results of correlation analysis, we compare the differences between the new model and the existing models. The amino acid exchangeability rates of mtOrt, mtInv, mtPan2013 and mtMet models were plotted in Figure 1. In mtInv and mtMet models, the exchangeability rates between Val (valine) and His (histidine) are the lowest (0.008 and 0.004), and that between Val and Ile (isoleucine) are the highest (8.543 amd 10.953). The rates between Glu and Asp (asparagine) are the highest in Pan2013 (10.819) and mtOrt (10.552), but the lowest rate in Pan2013 is between Arg and Asp (0.00000001), while the lowest rate in mtOrt is between Arg and Phe (0.00005). The change of amino acid exchangeability rates between different models is basically the same. However, they differ considerably when we look in their relative differences (Figure 2). For example, the coefficients on Ala (alanine) row are notably different among models, most of them are mtOrt < mtPan2013/mtInv. The 15 out of 190 coefficients in mtOrt are at least 10 times as large as corresponding ones in the mtPan2013 model. MtInv and mtMet models have 4 and 3 coefficients that are at least 10 times larger than mtOrt, respectively.
Amino acid frequencies of the four models, mtOrt, mtInv, mtMet and mtPan2013, are nearly identical (Figure 3, correlation > 0.98), their correlation being much higher than other models (Table 4). We observed some notable differences between frequencies of these models. For instance, the frequency of Met in mtOrt (0.09) is higher than other three models and is 1.3 times than that in mtMet (~0.07), while Gly (glycine) frequency is only 0.04 in mtOrt, which is the lowest in all models.
Phylogenetic performance
We assessed the performance of the new model and the existing models on building maximum likelihood phylogenies. For each dataset, we optimized parameters of the rate heterogeneity model, including proportion of invariable sites and shape of Gamma distribution with 4 categories, but fixed the exchangeability rates and base frequencies of the models.
We calculated the mean differences of the log-likelihood and the AIC score of per site (AIC/site) for testing datasets between mtOrt and other 11 models. It is clear that the mean differences of AIC/site between mtOrt and other models are negative, and the differences of log-likelihood are positive, which indicate that mtOrt outperform the existing models for testing datasets, followed by mtInv, mtMet, mtPan2013, mtArt, mtZoa (Figure 4). Furthermore, we compared the performance of new model to LG4X and C60 (site-heterogeneous models) [29]. The results illustrate that the new model outperformed LG4X and C60 models.
The whole dataset, which include 283 Orthoptera mt protein sequences, was divided into sub-datasets with two algorithm, and different k values targeting sub-dataset sizes of 16, 24, 32, 64 and 120 sequences [9]. Using the random splitting algorithm, 43 sub-datasets (RSDs) were obtained and the tree-based splitting algorithm obtaind 42 sub-datasets (TSDs). First, we evaluated the best-fit model for 85 sub-datasets by ModelFinder [30]. The results show that the best-fit models for all RSDs are mtOrt. Most of the best-fit models of TSDs are mtOrt, but there are six TSDs where the best-fit models are mtMet, and two of them are obtained by k=32, four are obtained by k=16.
Next, we evaluated the performance of mtOrt and other five models (mtInv, mtPan2013, mtMet, mtArt and mtZoa) by comparing the log-likelihood of trees (each sub-dataset has six trees, involving a total of 510 trees), which were inferred from each sub-dataset by IQ-TREE 1.7 with different models. The performance of the mt models at the individual dataset were estimated by approximately unbiased test (AU test) for phylogenies [29, 31, 32]. The CONSEL program was used to assess the confidence levels of the site log-likelihoods for phylogenies with the different models of each sub-dataset. The results of AU test show that among the 85 sub-datasets, the best log-likelihood of trees of 77 datasets are constructed by mtOrt model, and these 77 sub-datasets (90.6%) only accept the topologies constructed by mtOrt, while significantly rejecting the topologies built by five existing mt models, and 68.8% of them have a confidence level of 0.9 (Figure 5). The mtMet are the best-fit models for 7 out of 85 sub-datasets, but only significantly better for three datasets at the 0.9 confidence level, while the mtInv only significantly better for one sub-dataset at the 0.9 confidence level, and they are all smaller data sets. The other five existing models were not the best-fit model for any datasets.
We investigated the topological quality of phylogenies for each testing datasets and sub-datasets with six mt models (mtOrt, mtInv, mtPan2013, mtMet, mtArt and mtZoa) by measuring their topological distances from the best phylogenies. Specifically, we used the Matching Split distance (MS) metric to measure the distance between two phylogenies by TreeCmp 2.0 [33]. Although no difference was detected in the topologies of the testing datasets built by different models, Figure 6 discloses remarkable topological distances from the phylogenies of sub-datasets with existing models to the new model. For 85 sub-datasets, the phylogenies built by mtInv and mtOrt have the same topologies for 67 sub-datasets, and the phylogenies of 64, 54, 51 and 43 sub-datasets inferred by mtMet, mtPan2013, mtZoa and mtArt have the same topologies as that constructed by mtOrt, respectively. The topologies inferred by mtArt are different from that constructed by mtOrt in 49.4% of sub-datasets, and the phylogenies of 40.0% , 36.5%, 24.7% and 21.2% sub-datasets inferred by mtZoa, mtPan2013, mtMet, and mtInv are different from that constructed by mtOrt, respectively. We also compared the node support values of the trees constructed by different models for testing datasets and sub-datasets. The results showed that the new model did not improve the node support values, and the node support values of mtOrt_trees are not significantly different from those of the existing models (p > 0.05).
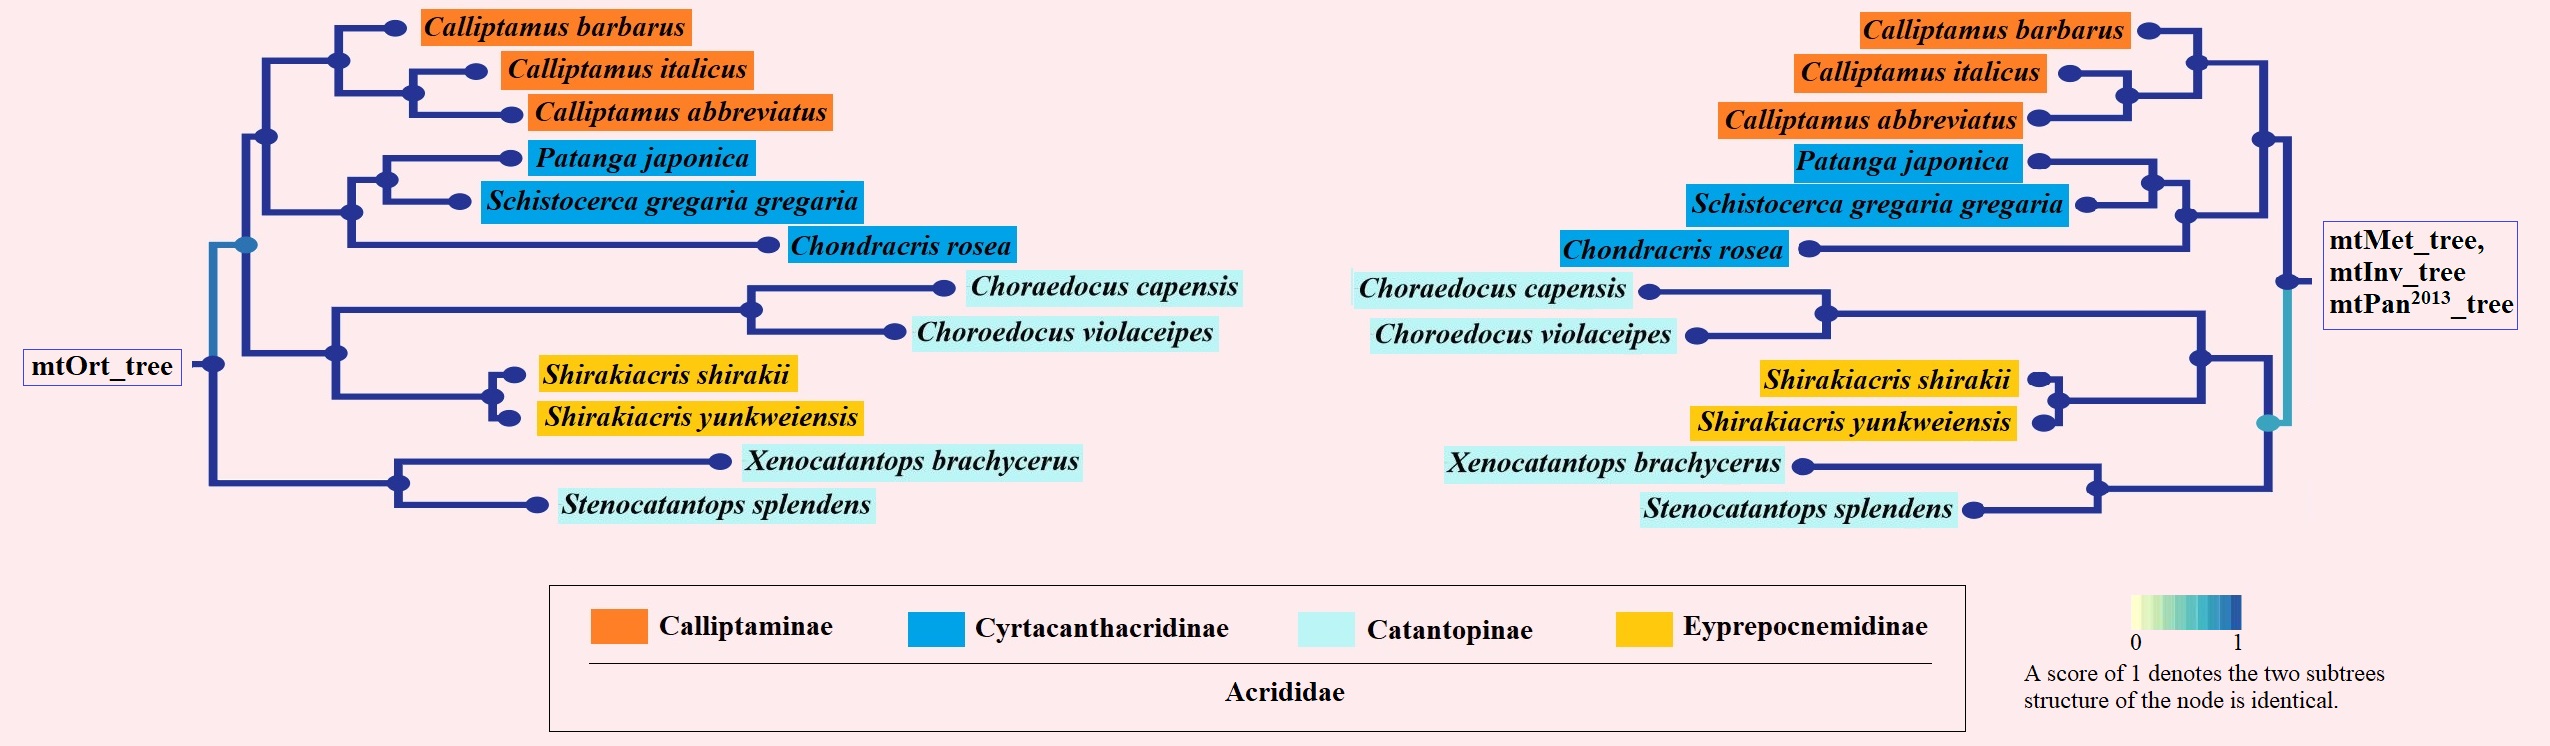
We used Polyneoptera mitogenomes dataset to test whether the new model would be used in phylogenetic estimation of other closely related taxa. For the trees of Polyneoptera constructed by different models, mtOrt_tree, mtInv_tree, mtMet_tree and mtPan2013_tree have the same topology (Additional file 3: Figure S1). Although mtOrt_tree does not have the optimal likelihood and AIC, it has the optimal node support value, and there is no significant difference between different models (p > 0.05). The results indicated that the new model is also applicable in the study of phylogenetic relationship of Polyneoptera.
Phylogenetic analysis of Orthoptera
The 14 Orthoptera phylogenetic trees (inferred by the new model, 11 exiting models and two site-heterogeneous models (LG4X and C10)) show that mtOrt (+R10) resulted in a likelihood advantage over other models (1,812.897 log-likelihood advantage over the second-best model, mtInv (+R10)). The AU test supports that mtOrt_tree is optimal (au = 1.000 and p < 0.01), and significantly rejects the topologies of other trees (the au values of the other 13 trees are less than 0.01, and the p values are less than 0.01). By comparing the topologies, the abnormal result of the clustering of grylloid (include Grylloidea and Gryllotalpoidea of Ensifera) and Caelifera is found in all the nine trees (mtArt_tree, mtZoa_tree, LG_tree, mtPro_tree, JTT_tree, mtDeu_tree, WAG_tree and Dayhoff_tree). The topology constructed by site-heterogeneous models (LG4X and C10) also performs poorly.
The comparisons between mtOrt_tree and mtMet_tree, mtInv_tree and mtPan2013_tree shows that the relationships between higher-level taxa are identical and very stable (Figure 7). The MS metric was used to measure the distance between four phylogenies. The result shows that the four topologies are very similar to each other, The MS distances ranges from 0.0025 (Pan2013_tree vs mtMet_tree) to 0.0201 (mtMet_tree vs mtInv_tree). The most similar to mtOrt_tree is mtInv_tree (0.0062), followed by mtMet_tree (0.0161) and mtPan2013_tree (0.0175).
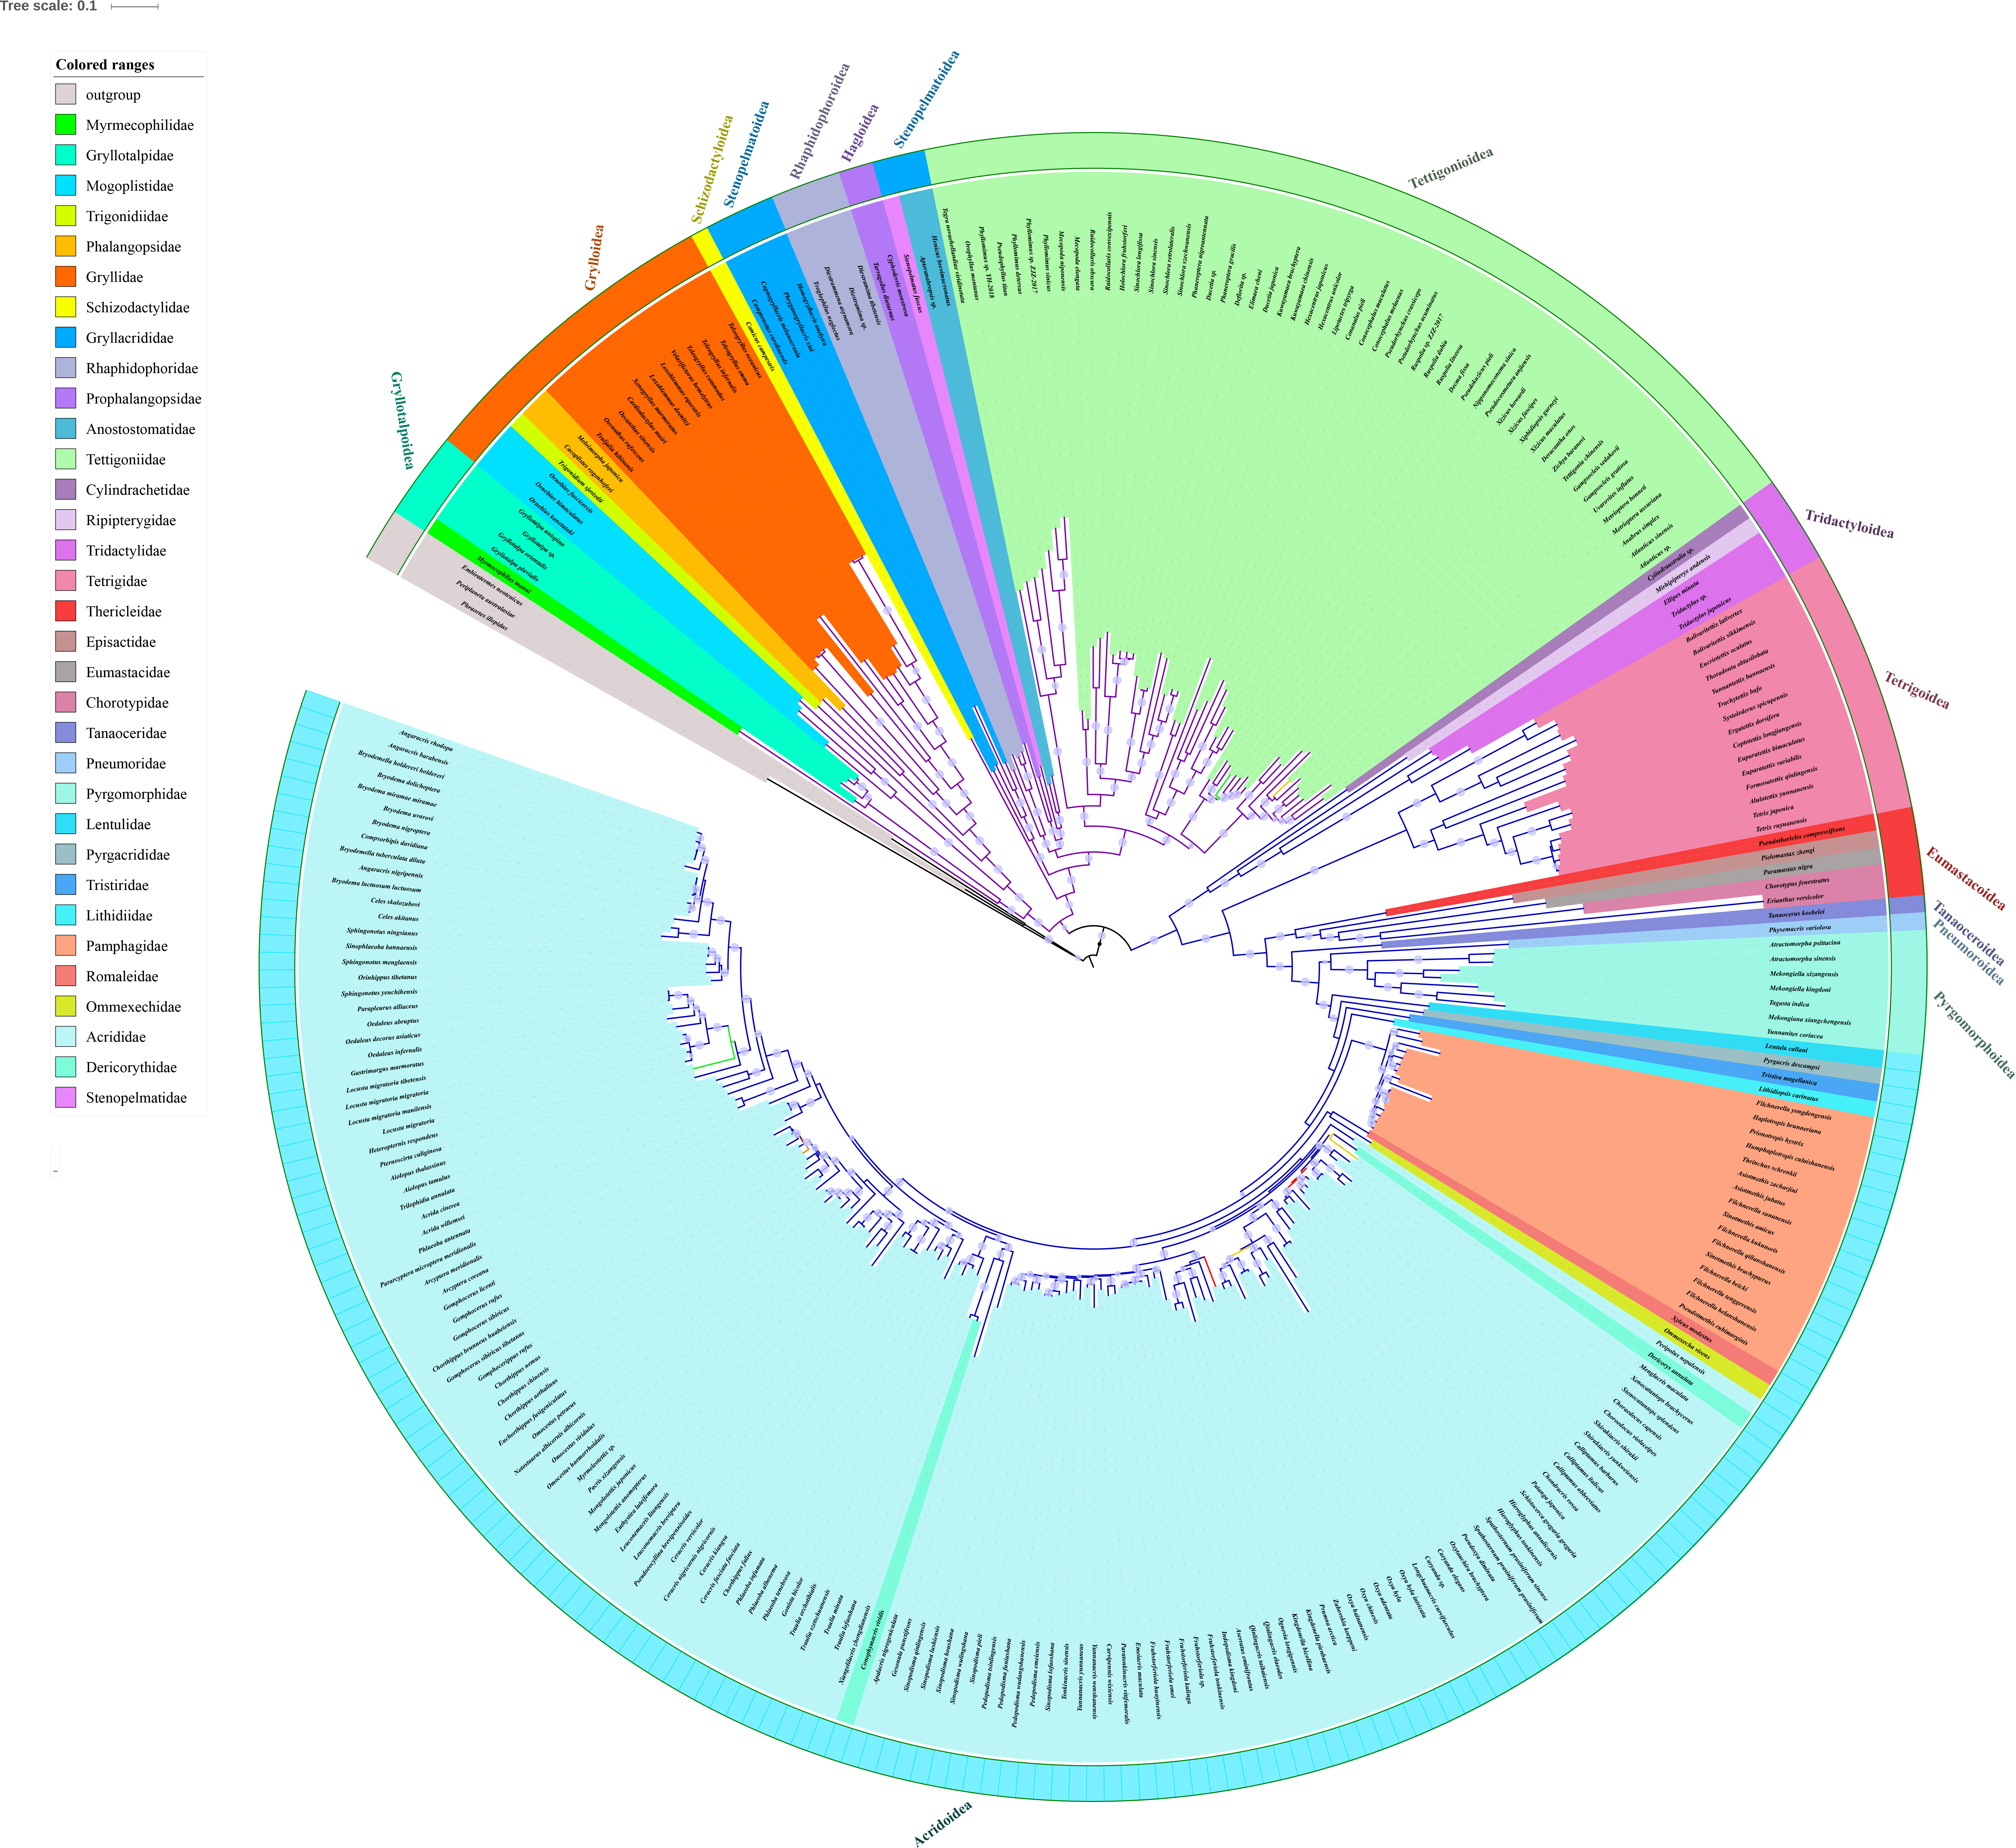
Overall, Orthoptera is divided into two large branches: Ensifera and Caelifera (Figure 7). Within the Ensifera, the relationships among the seven superfamilies were ((((Tettigonioidea + ((Stenopelmatoidea + Hagloidea) + Rhaphidophoroidea)) + Stenopelmatoidea) + Schizodactyloidea) + (Grylloidea + Gryllotalpoidea)). Within the Caelifera, the relationships among the seven superfamilies were ((((((Pyrgomorphoidea + Pneumoroidea)+ Acridoidea) + Tanaoceroidea) + Eumastacoidea) + Tetrigoidea) + Tridactyloidea). By comparing the topological structure of four trees (mtOrt_tree, mtMet_tree, mtInv_tree and mtPan2013_tree), we found eight differences (two in the branch of Ensifera and six in the branch of Caelifera), and all of them appeared in the lower classification level (Additional file 4: Figure S2).