3.1 Characterization of B-AgNPs
In this study, stable, spherical, small size, and well disperse AgNPs were obtained by using animal blood. The synthesis of B-AgNPs was initially confirmed from the color change of the solution, however, the maximum absorption of UV-Vis spectrometry at 422 nm (Figure 1a) further confirmed the B-AgNPs synthesis. The X-ray diffraction analysis showed peaks 111, 200, 220, and 311 that indicate crystalline structure if the obtained B-AgNPs (Figure 1b). The other peaks lower than 30, is due to residue of organic components present in the blood serum. The size of the obtained B-AgNPs was a small-sized range from 20 – 50 nm (Figure 2a). Moreover, the SEM analysis showed spherical and well-dispersed AgNPs at 2.0 μm (Figure 2b).
Figure 1. The confirmation of B-AgNPs by UV-Vis spectrometry at 422 nm (a); The X-ray diffraction pattern of blood induced silver nanoparticles (b).
Figure 2. The Transmission Electron Microscope result of blood induced nanoparticles (a); The Scanning Electron Microscopy result of blood induced silver nanoparticles (b).
3.2 Toxicity of B-AgNPs against fish
The obtained B-AgNPs were applied in vitro for its mortality and toxicity in fish fauna. C. carpio was very prone to B-AgNPs absorption and caused damage at the tissue level, but with very little mortality. In the present study, the behavior of fish was studied and the fish group (0.09 mg/L) have shown very less abnormal behavior while exposed to B-AgNPs given in Table 1. Therefore, B-AgNPs could be an appropriate indicator for further use in any fisheries department. Mortality potential or lethal effect of any applicable materials is the first parameter of any application study. The fish mortality in the lethal concentration of B-AgNPs was dose-dependent. e.g. the highest mortality was found at the highest dose (0.09 mg/L) given in (Table 2, Fig 3). There was no mortality found in the other three groups (control, 0.03 mg/L, 0.06 mg/L) of the study. In the overall experiment, the mortality was observed on days 2, 6, 16, and 20 and no mortality has occurred in other days of the experiment. Median lethal concentration (LC50) values for 2, 6, 16, and 20 days are given in Table 2.
Table 1 The behavior study of fish during the exposure period to different concentrations of B-AgNPs
|
Behavior Categories
|
Food Rejection
|
Reduced Feces Excretion
|
Lack of Swimming
|
Fin Movement
|
Motionless and Presence on side
|
Movement Toward the Surface
|
|
Control
|
Normal
|
Normal
|
Normal
|
Normal
|
Normal
|
Normal
|
|
|
|
|
B-AgNPs
|
|
|
|
|
0.03 mg/L
|
Normal
|
Normal
|
Normal
|
Normal
|
Normal
|
Normal
|
|
0.06 mg/L
|
Normal
|
Normal
|
Normal
|
Normal
|
Normal
|
Less
|
|
0.09 mg/L
|
Less food intake comparatively other groups
|
Normal
|
Less
|
Normal
|
Less motionless
|
Less
|
Table 2 Median lethal concentration LC50 of B-AgNPs to Common carp fish in 2, 6, 13, and 19 days. (Note: There was no mortality on all other days and concentrations)
|
Concentration of B-AgNPs
|
Lethal Concentration (mg/L)
|
Fish Exposure time (Days)
|
|
0.09 mg/L
|
0.61 ± 0.09
|
2
|
|
0.09 mg/L
|
0.49 ± 0.04
|
6
|
|
0.09 mg/L
|
0.46 ± 0.08
|
13
|
|
0.09 mg/L
|
0.39 ± 0.04
|
19
|
Figure 3. The mortality of C. carpio during chronic exposure to B-AgNPs (0.09 mg/L). The fish were exposed to different concentrations of B-AgNPs for 20 days. Note: No mortality has been seen at 0.03 mg/L and 0.06 mg/L.
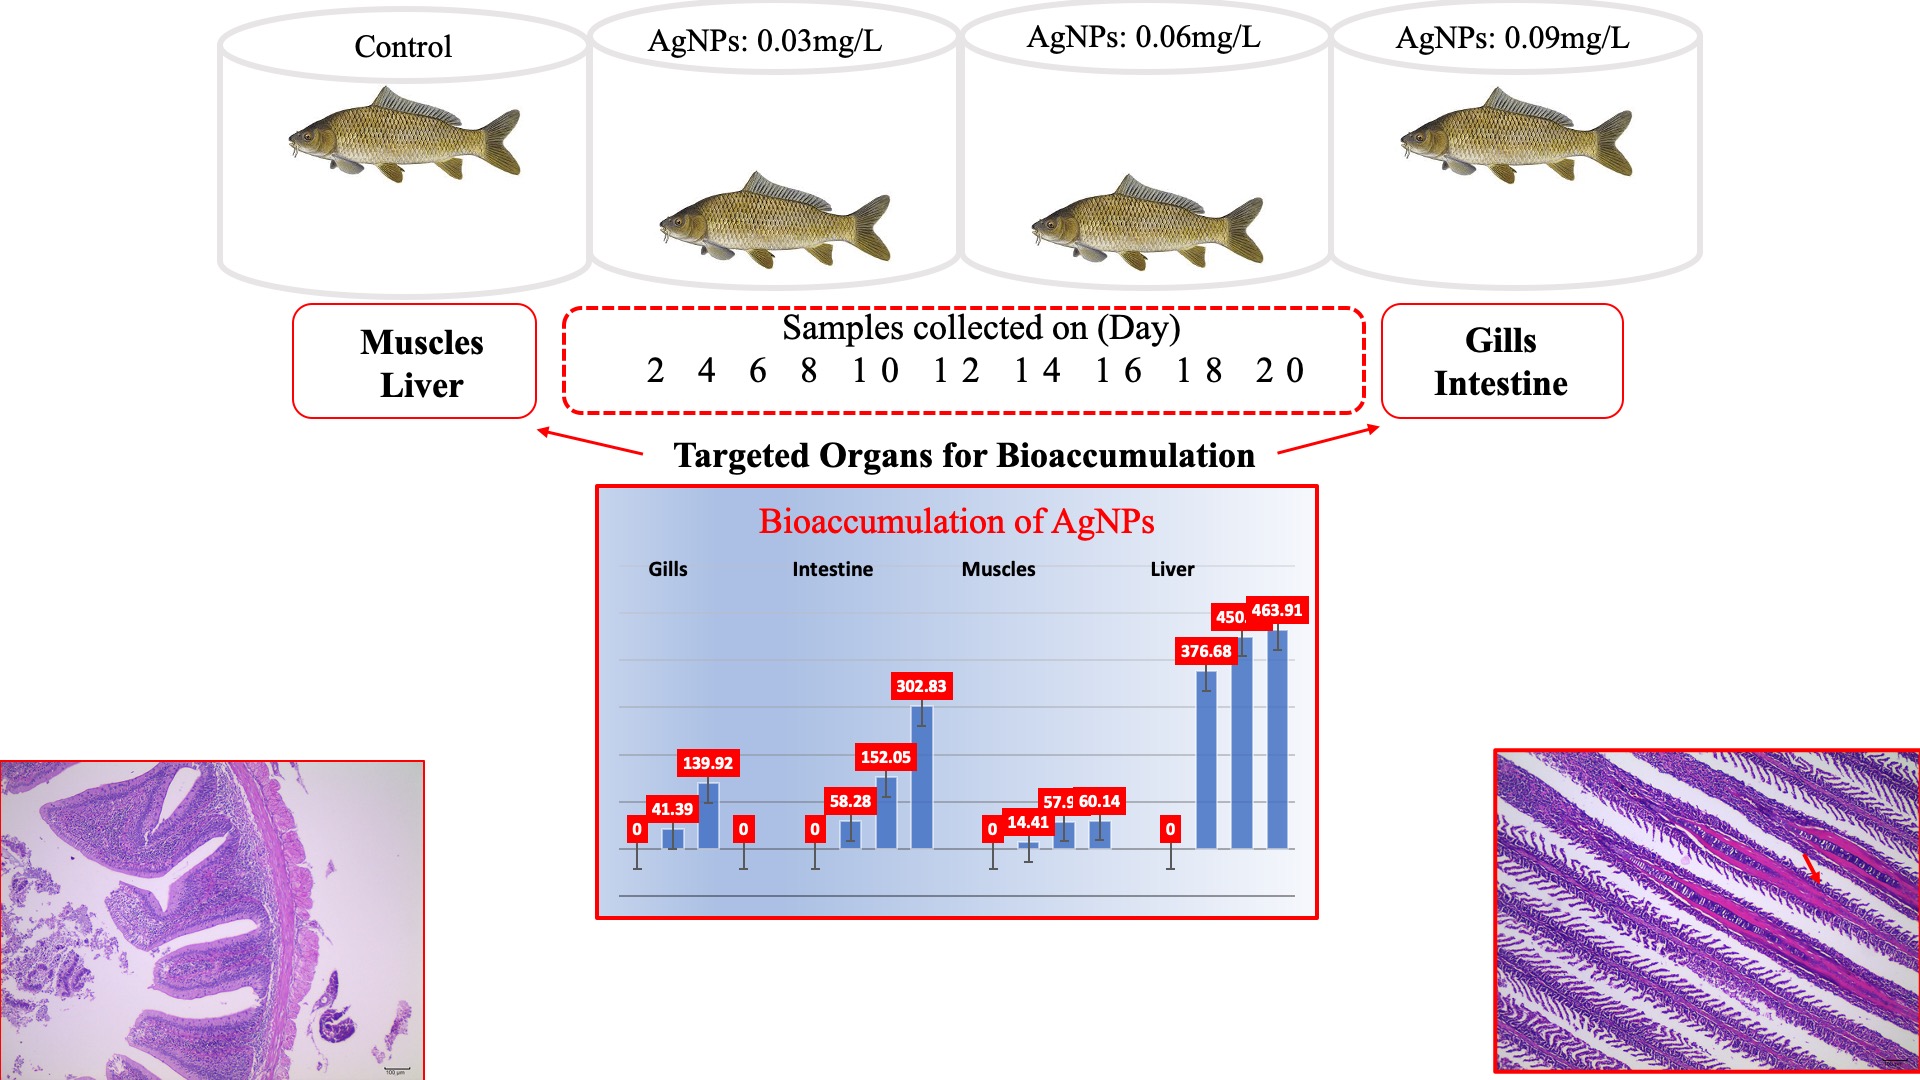
3.3. Bioaccumulation of B-AgNPs in tissue
The result of bioaccumulation of B-AgNPs in different organs has been given in (Fig 4). Overall the B-AgNPs were mostly bioaccumulated in the liver, followed by intestine, gills, and muscles (p < 0.05). In all organs, the bioaccumulation of B-AgNPs was dose-dependent e.g. the bioaccumulation of B-AgNPs was increased while the dose was increased. Comparatively the treatment groups consisted of different concentrations of B-AgNPs. The results revealed that the highest bioaccumulation of B-AgNPs was seen at the highest concentration of B-AgNPs (0.09 mg/L) while the lowest bioaccumulation was seen at the lowest concentration B-AgNPs (0.03 mg/L). The overall absorption of B-AgNPs in different organs is given in (Fig S2) while the daily basis bioaccumulation of B-AgNPs in different organs of (Cyprinus carpio) is given in (S3 = Gills, S4 = Intestine, S5 = Muscle, and S6 = Liver). The liver was the most bioaccumulated organ (Fig 4a). The highest absorption of B-AgNPs was observed in a group (0.09 mg/L) i.e. 272.09 mg in the twenty days exposure. 299.15 mg B-AgNPs were absorbed in the intestine for twenty days exposure as shown in (Figure 4b). Gills have absorbed 225.99 mg of B-AgNPs for twenty days (Figure 4c) while the lowest absorption of B-AgNPs was observed in the muscles of fish i.e. 76.64 mg (p < 0.05) shown in (Figure 4d). However, the highest level of absorption of B-AgNPs was seen in the liver and intestine (p <0.05). The bioaccumulation of B-AgNPs reported in this study was compared with previous studies (Table 3)
Table 3 Comparison of the present study with previous studies, showing the results at the end of the experiment.
|
Fish
|
NPs type
|
Concentration selection method
|
Duration
|
Organs analyzed
|
Histological study
|
Bioaccumulation
|
Reference
|
|
Common carp fish
|
AgNPs
|
0.04, 0.08 mg/L
|
96 hours
|
Gills, liver, and intestine
|
Epithelial lifting, telangiectasia in secondary lamellae, and epithelial necrosis
|
Mostly in the liver and intestine
|
[27]
|
|
Zebrafish, Rainbow trout fish
|
CuNPs
|
1mg/L
|
96 hours
|
Gills
|
Damage of gill filaments
|
N/A
|
[28]
|
|
Epinephelus coioides
|
CuNPs
|
100μg/L
|
25 days
|
Gill, intestine, liver, and muscles
|
Cell apoptosis in gill, liver
|
Liver, gill, intestine, and muscles
|
[29]
|
|
Common carp fish
|
AgNPs
|
0.75 mg/L
|
14 days
|
Gill
|
Telangiectasia and epithelial cell hyperplasia in fish gills
|
N/A
|
[5]
|
|
Common carp fish
|
ZnONPs
|
50mg/L
|
30 days
|
Gill, liver intestine, and brain
|
Irregular cell outline, abnormal pyknotic nuclei, shrinkage of cell
|
Mostly accumulated in the Liver and gills
|
[30]
|
|
Common carp fish
|
CuNPs
|
N/A
|
21 days
|
Gill, intestine, and liver
|
N/A
|
Mostly accumulated in the liver and intestine
|
[31]
|
|
Common carp fish
|
B-AgNPs
|
0.03, 0.06, 0.09 mg/L
|
20 days
|
Gill, intestine, muscles, liver
|
Histological alteration mostly occurred at the highest concentration of B-AgNPs in gills and intestine
|
Widely accumulated in the liver, followed by the intestine, gill, and muscle
|
Our study
|
Figure 4. The absorption and bioaccumulation of B-AgNPs in the liver (a) in the gill (b) in the intestine (c) and in the muscles (d) of Common carp fish (C. caprio) after exposure to 0.03, 0.06, and 0.09 mg/L for 20 days (p < 0.05).
3.4. Histological investigation
The histological investigation showed that exposure of fish fauna to B-AgNPs led to an alteration in tissue level in targeted organs (gills, intestine). Tissue alteration in the sense of damage, atrophy, shortening of secondary lamella, degeneration, and necrosis at different concentrations of B-AgNPs have been observed. The gill tissue structure was damaged and led to atrophy and necrosis while exposed to 0.03 mg/L of AgNPs shown in (Figure 5). (Figure 6) shows that necrosis has occurred, which led to vacuolation and the tissues are arranged disorderly. The shedding and degeneration have started in the tissues of gills at 0.06 mg/L concentration of B-AgNPs. At the highest concentration of B-AgNPs (0.09 mg/L), the reduction or shortening of lamella was observed as shown in (Figure 7). Not only the gills but the AgNPs also caused histological alterations in intestinal tissues. In the current study, some intestinal villi mucosal epithelial cells are shaded and a small number of epithelial cells on the top are missing. (Figure 8) shows that there is degeneration, shedding, and necrosis have been observed. The fish exposed to 0.03 mg/L B-AgNPs concentration shows that there is shedding and small number of epithelial cells on the top of intestinal villi are missing. The fish exposed to 0.06 mg/L concentration led to necrosis and degeneration in mucosal cell. The exposure of fish to 0.09 mg/L led to necrosis and cell lysis in the villi mucosal epithelial cells as shown in (Figure 8c). So, it was summarized that lesions, degeneration, necrosis, and shedding even cell lysis were formed mostly at the highest concentration of B-AgNPs exposure given in Table S1 and S2.
Figure 5. Histopathological alteration of the gill of Common carp fish after the exposure to 0.03 mg/L concentrations of B-AgNPs.(↑)The atrophy of gill lamella, necrosis, and cloudy of the lamella.
Figure 6. Histopathological alteration of the gill of Common carp fish after the exposure to 0.06 mg/L concentrations of B-AgNPs. (↑) Vacuolation of gill lamella, (↑) epithelial cell of gill shedding, and (↑) necrosis.
Figure 7. Histopathological alteration of the gill of Common carp fish after the exposure to 0.09 mg/L concentrations of B-AgNPs. (↑) Atrophy and shortening of the lamella. (↑) The interlayer of lamellae fused.
Figure 8. (a) The histopathological alterations of common carp fish intestine after the exposure to B-AgNPs at 0.03 mg/L concentrations. (↑) Degeneration, necrosis, and loss of epithelium cells on the top of villi in small intestine, (↑) the increased number of lymphocytes. (b) The histopathological alterations of common carp fish intestine after the exposure to B-AgNPs at 0.06 mg/L. (↑) necrosis, and shedding, lamina propria disintegrate in mucosal cells (↑) lymphocytes infiltration. (c) The histopathological alterations of common carp fish intestine after the exposure to B-AgNPs at 0.09 mg/L. (↑) degeneration, necrosis, and cell lysis in villi of the intestine, (↑) increased lymphocytes.
3.5. Biomarker assay for enzymes
Antioxidant enzyme activity are summarized in Table 4. The different concentrations of B-AgNPs led to significant changes in the hepatic and gill enzymes activities. With a reduction in the fish group exposed to (0.03 mg/L and 0.06 mg/L) and an increase in the highest concentration of B-AgNPs (p < 0.05). At the highest concentration (0.09 mg/L) of B-AgNPs a rise in GST and decreased were noticed in GR in case of liver. But in the gills, GST and GR both have been decreased as comparing to control. The CAT increased at 0.03 mg/L while decreased in both 0.06 mg/L and 0.09 mg/L in case of gill and liver. The GR decreased at all the concentrations of B-AgNPs comparing to control group gill while in the liver the GR have increased at 0.03 mg/L and 0.06 mg/L but have decreased at 0.09 mg/L.
Table 4: Enzymatic assay of glutathione S-transferase (GST), glutathione reductase (GR), and catalase (CAT) in the tissues of liver and gills of C. carpio after exposure to 0.03 mg/L, 0.06 mg/L, and 0.09 mg/L for long time exposure of B-AgNPs. The values in this table are expressed as mean ± SE.
|
Enzyme
|
Control
|
0.03 mg/L
|
0.06 mg/L
|
0.09 mg/L
|
|
Liver
|
|
|
|
|
|
GST
|
753.17 ± 19.24
|
672.69 ± 91.83
|
679.22 ± 104.75
|
1021.32 ± 32.29
|
|
GR
|
56.39 ± 4.89
|
61.09 ± 10.42
|
59.91 ± 1.56
|
36.69 ± 2.74
|
|
CAT
|
109.38 ± 11.23
|
83.26 ± 12.28
|
112.32 ± 19.81
|
103.38 ± 6.26
|
|
Gills
|
|
|
|
|
|
GST
|
212.27 ± 19.59
|
192.03 ± 3.11
|
215.47 ± 35.33
|
132.40 ± 16.60
|
|
GR
|
77.07 ± 3.86
|
61.79 ± 8.21
|
68.81 ± 20.44
|
53.12 ± 10.43
|
|
CAT
|
11.64 ± 0.83
|
8.35 ± 0.23
|
16.32 ± 3.34
|
7.67 ± 0.58
|