In situ tree stem methane flux rates and bark preparation
Melaleuca quinquenervia stem fluxes were determined using a small chamber directly attached to the tree with a portable cavity ring-down spectrometer (G4302-GasScouter, Picarro)33 from forests in subtropical, north-eastern NSW, Australia. During the first stable isotope MOB experiment, paired tree stem bark samples were collected from opposite sides of four M. quinquenervia trees with high methane fluxes, spanning two sites with differing hydrological characteristics. One site featured moist sediments (MF1) around the tree base (n = 4) whereas the other was completely inundated with freshwater ~50 cm up the tree stem (n = 5) (FF1). Within one hour of bark sample collection, each sample was weighed (with samples ranging from 81 to 147 g; Table S1) and then volumetrically measured with a ruler (cm3). The bark samples were then cut into sufficiently narrow strips (~1 cm) to fit through the bottle-neck of sterile (autoclaved) 550 mL crimp top glass bottles. Care was taken to ensure minimal disturbance to the planar bark layers to preserve as much of the natural bark microstructure as possible. Each bottle was then capped, wrapped in aluminium foil and inoculated with 101 ppm CH4 in air gas standard (CoreGas). This was achieved by flushing each bottle for six minutes using a two-syringe system, featuring a long inlet syringe reaching near the bottom of the bottle and a short venting syringe evacuating the headspace closer to the top of each bottle. Four bark-free empty bottles (blanks) were used as controls, and were also wrapped, crimped and flushed using the same 101 ppm CH4 standard and methods.
A repeat experiment (FF2), focused solely on an inundated forest site, utilised seven trees spanning a range in CH4 flux rates (1.1 to 393 mmol m-2 d-1) (Table S1). Larger bark samples (approximately 13 x 25 cm) from the lower stem of trees in standing water that was on average 54.0 ± 12.9 cm deep, were extracted using sterile methods and then cut into thirds. For the microbial analysis, one third of each bark sample was field-wrapped in sterile foil pockets (pre-baked at 180°C for 6 hours) immediately after extraction, and then placed on ice (n = 7). Ancillary composite sediment and surface water samples were also collected using sterile methods. All samples were refrigerated within two hours of collection at 4 °C. They were later transported with dry ice to Monash University (Greening Lab) for the microbial analysis. One third of each bark sample was prepared as per first experiment methods (n = 7) and were placed into sealed crimp top sterile bottles. The final third of bark sample from each tree were placed in sterile crimp top bottles, but microbial communities were neutralised by microwaving (1600W – LG model MS3882XRSK) for 2 minutes, four times over, before sealing (n = 7). All paired samples (i.e. raw bark and microwaved control) were then inoculated with 101 ppm methane as per the syringe method above.
Isotope time series inoculation experiment
The headspace concentration of CH4 and δ13C-CH4 of the inoculated bark bottles, the neutralised bark bottles and blanks were sampled using a cavity ring-down spectrometer (CRDS) with a sensitivity of 5 ppb + 0.05 % of reading (12C), 1 ppb + 0.05 % of reading (13C) (Picarro, G2201-i). At 3 to 24 hourly intervals (increasing with experiment duration), a 60 mL gas sample of 101 ppm CH4 was injected into the bottle septum using a long syringe needle, whilst simultaneously mixing and removing 60 mL of gas sample via a second and short syringe needle. To ensure adequate headspace mixing occurred, headspace mixing was repeated at least eight times before extracting each sample (i.e. the volume of gas mixed was greater than the headspace volume within each bottle). The extracted gas sample was then analysed directly from the syringe into the CRDS. The sample concentration of CH4 (ppm), δ13C-CH4 (‰) and the associated ±SD were recorded for each bottle treatment at each time interval. The 60 mL mixing additions of CH4 and δ13C-CH4 (‰) to each bottle headspace were later accounted for via mass balance, to calculate the shift in CH4 and δ13C-CH4 (‰) over time. The decrease in CH4 over the first 24 hours was converted to uptake, as a proportion of the original surface area of each bark treatment within each bottle. The fractionation factor (α) was defined as the ratio of the oxidation rate coefficients of 12CH4 over 13CH4, and calculated using established methods53.
Genomic DNA extraction
High-quality and amplifiable genomic DNA were extracted from all bark (n = 14), sediment (n = 3) and water (n = 6) samples. For each individual bark sample, 0.13 to 0.18 g (wet weight) of material was frozen in liquid nitrogen and immediately homogenised using a sterile pestle and mortar until a fine powder was obtained. Genomic DNA was extracted from the homogenised samples using the Synergy 2.0 Plant DNA Extraction Kit (OPS Diagnostics LLC, US), according to the manufacturer’s instructions. Genomic DNA from the sediment samples (0.25 g wet weight sample) and water samples (50 mL sample filtered on to sterile filter papers) were extracted using the DNeasy PowerSoil Kit (Qiagen, US), according to the manufacturer’s instructions. The purity and yield of the DNA extracts were verified by spectrophotometry (NanoDrop ND-1000 spectrophotometer, Nanodrop Technologies Inc., US) and quantified by fluorometry (Qubit Fluorometer, Thermo Fisher Scientific). For the DNA extraction from each type of sample, PCR-grade water was extracted as a negative control.
Quantitative PCR
Quantitative PCR assays were performed on a QuantStudio 7 Flex Real-Time PCR instrument (Thermo Fisher Scientific), to quantify gene copy numbers and estimate the abundance of the total microbial (16 rRNA gene copies) and MOB community (pmoA gene copies). Briefly, the pmoA gene was amplified using the previously described degenerate primers A189f 5′-GGNGACTGGGACTTCTGG-3′ and mb661 5′-CCGGMGCAACGTCYTTACC-3′54, 55 and cycling conditions56. The primers pair was chosen for its coverage of the MOB community from environments with elevated CH4 concentrations. The V4 hypervariable region of the 16S rRNA gene was amplified using the universal Earth Microbiome Project primer pairs 515FB 5′-GTGYCAGCMGCCGCGGTAA-3′ and 806RB 5′-GGACTACNVGGGTWTCTAAT-3′ 57, as per previously described cycling conditions58. The employed reaction conditions and thermal profiles of the qPCR assays have been previously described36. Amplification from different dilutions (from undiluted to 1:100 dilution in PCR-grade water) of DNA extracts was tested, and the dilution resulting in the highest yield and quality of PCR product was used for the qPCR assays. For each assay (96-well plate), duplicate serial dilutions of quantified 16S rRNA gene (from Escherichia coli) or pmoA gene amplicons, (from Methylosinus trichosporium strain OB3b) were used to generate standard calibration curves. Each sample was analysed in triplicate; amplification efficiencies (>70 %) were calculated from the slopes of the calibration curves (R2 values > 0.97). No significant amplification of the blank extractions was observed in any qPCR assays.
Amplicon sequencing
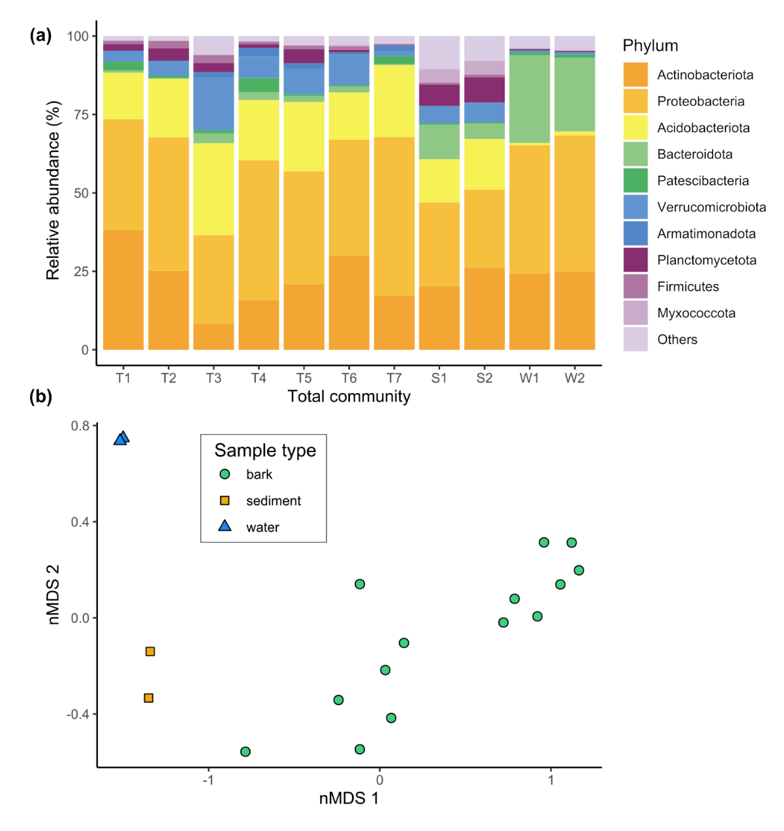
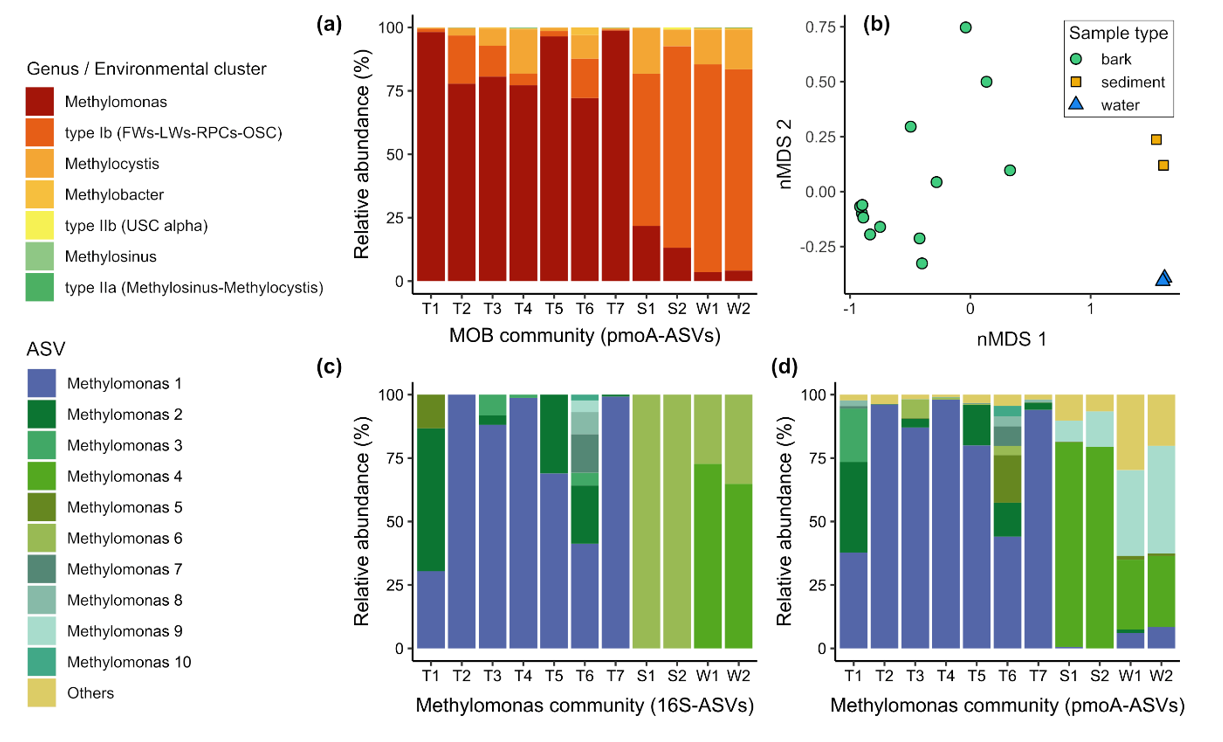
Amplicon sequencing of the universal 16S rRNA gene was used to infer the community composition of the total bacterial and archaeal community within each sample. Amplicon sequencing of the pmoA gene, encoding the particulate methane monooxygenase A subunit, was also performed to gain a higher-resolution insight into the composition of the MOB community. Genomic DNA extracts of 14 bark, two composite sediment and two composite water samples (pooled samples), as well as the blank extraction, were subject to Illumina MiSeq paired-end sequencing at the Australian Centre for Ecogenomics, University of Queensland. The resultant raw sequences from the 16S rRNA gene amplicon sequencing were subject to quality filtering, merging, primer trimming, denoising and singleton removal using the QIIME 2 platform59. Taxonomic affiliation of the identified amplicon sequence variants (16S-ASVs) was assigned according to the GTDB taxonomy60. For each sample, 16S-ASVs classified as “unassigned” (av. 5.2 %), “Eukaryota” (av. 0.04 %), “Chloroplast” (av. 1.7 %), and “Mitochondria” (av. 0.3 %) were excluded as potentially derived from plant material. The final dataset accounted for 2727 16S-ASVs, with an average sequence count number per sample of 9184 (range 3657 in sample T6.2 to 14524 in sample S2). The 16S-ASVs assigned to known methanotrophic families and genera were subset to infer MOB community structure and to estimate the proportion of the MOB community within the total microbial community via the 16S-ASV dataset. Note that this analysis cannot detect uncultured MOB with unknown 16S rRNA gene sequences. Data processing of the pmoA gene amplicon sequences followed our previously published pipeline36, 61, with minor modifications. All processing steps were performed in the QIIME 2 platform and, instead of assigning the raw sequences to operational taxonomic units, raw sequences were denoised using the DADA2 pipeline62, yielding 280 high-quality pmoA amplicon sequence variants (pmoA-ASVs). Taxonomic affiliation of the pmoA-ASVs was assigned by similarity with pmoA sequences of a curated database63. The average sequence count number per sample was 8556; range 5026 in sample T7.1 to 14729 in sample T5.1. Sample T6.2, with a sequence count number of 1503, was excluded from further analyses. Note that this analysis cannot detect highly divergent MOB pmoA sequences, such as those from Verrucomicrobiota and Candidatus Methylomirabilota.
Microbial diversity analyses
To assess total and MOB community structure based on both 16S-ASV and pmoA-ASV dataset, read count normalisation and alpha and beta diversity calculations were performed with the package phyloseq v1.3064 from the open source software Bioconductor. Chao1, Shannon and Inverse Simpson indices were computed to assess the alpha diversity of total and MOB communities, whereas beta diversity was measured using the Bray–Curtis distance matrix65 and visualised using non-parametric multidimensional scaling ordinations (nMDS). To determine whether the observed between-group distances were statistically significant, we performed permutational multivariate analysis of variance (PERMANOVA) with the software PRIMER-E v7 (PRIMER-E Ltd., Plymouth, United Kingdom). For bark samples, correlations between pmoA and 16S rRNA gene abundance, qPCR- and 16S-ASV-based MOB community proportion, and CH4 uptake and in situ tree stem CH4 fluxes were tested for significance using linear regression, after appropriate variable transformations (log10 for gene abundances, logit for MOB community proportion) and removal of outliers as indicated by diagnostic plots (qq- and Cook’s distance). Correlations between qPCR- and 16S-ASV-based MOB community proportion and CH4 uptake were highly significant (p < 0.008).
In situ methanotroph inhibitor experiments with difluoromethane (DFM)
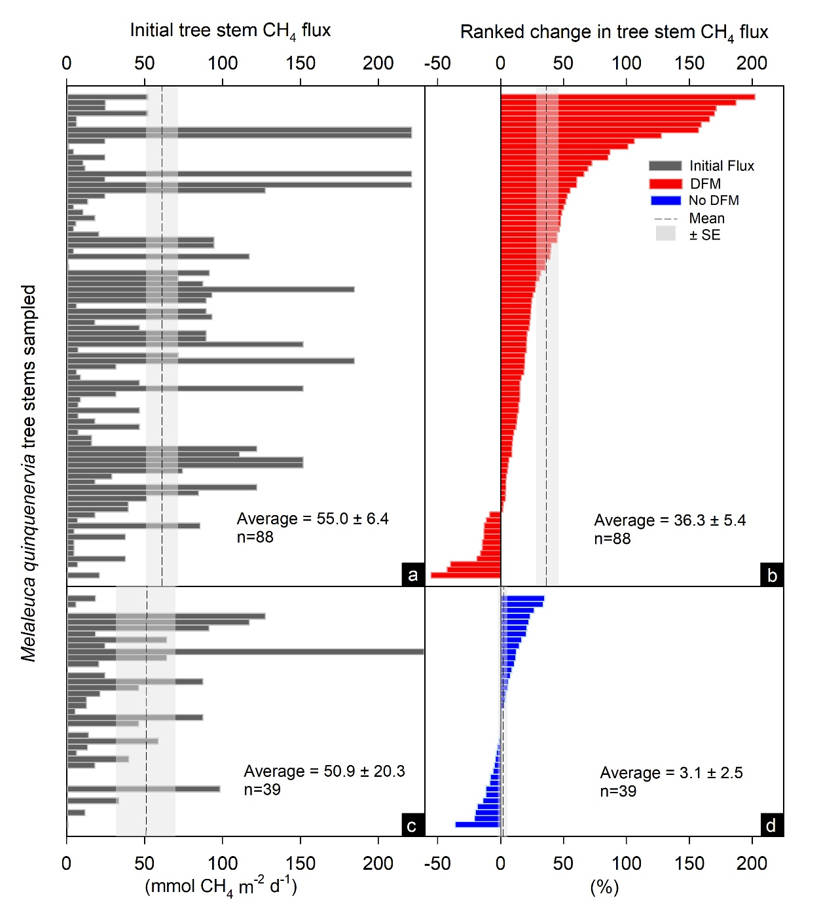
The in situ MOB oxidation rates were estimated by first measuring duplicate un-inoculated tree stem fluxes using the ‘Small Nimble In situ Fine-scale Flux’ (S.N.I.F.F.) method33 (n = 88 trees). Then the tree stem chamber was flushed with atmospheric air for 30 seconds or until atmospheric concentration in the chamber was attained, and 120 mL addition of 2 % difluoromethane (DFM) was slowly injected, then sealed within each chamber and left to incubate and infiltrate the bark for ~45 – 90 minutes, similar to a sufficient time previously shown to inhibit MOB34. The chamber was then again flushed again with atmospheric air and then duplicate methane flux rates were measured. As DFM has been shown to be an effective inhibitor of aerobic methanotrophy35, the difference between initial methane fluxes and the subsequent DFM inoculated fluxes were deemed to be the effect of inhibition of MOB52. Blank repeated chamber flux measurements with no DFM injections were also performed in situ to ensure no enhancement of methane fluxes occurred, as a result of repeated chamber measurement at the same location (n = 39). Closed loop experiments conducted in the laboratory spanning a spectrum of methane concentrations (1.8 – 400 ppm) revealed no increase in methane concentrations occurred when adding 2 % DFM when using a CRDS (Picarro, GasScouter G4301). Occasionally, interference with the H2O sensor was observed, but never under field conditions when DFM was left to incubate and diffuse. Shapiro-Wilk normality tests were used to determine whether the % change in DFM and blank repeat CH4 flux treatments were non-parametric (p < 0.05) and had equal variance (p < 0.05), using Sigmaplot 13.0. A Kruskal-Wallis One Way Analysis of Variance on Ranks was then used to determine whether there was a significant difference between the treatments and Dunn's Method was then used isolate the group/s that differed from the others, using pairwise multiple comparison procedures, where statistically significant differences were p < 0.001.
Methods References
- Coleman DD, Risatti JB, Schoell M. Fractionation of carbon and hydrogen isotopes by methane-oxidizing bacteria. Geochimica et Cosmochimica Acta. 1981;45(7):1033-7.
- Holmes AJ, Costello A, Lidstrom ME, Murrell JC. Evidence that participate methane monooxygenase and ammonia monooxygenase may be evolutionarily related. FEMS microbiology letters. 1995;132(3):203-8.
- Costello AM, Lidstrom ME. Molecular characterization of functional and phylogenetic genes from natural populations of methanotrophs in lake sediments. Applied and environmental microbiology. 1999;65(11):5066-74.
- Henneberger R, Chiri E, Bodelier PE, Frenzel P, Lüke C, Schroth MH. Field‐scale tracking of active methane‐oxidizing communities in a landfill cover soil reveals spatial and seasonal variability. Environmental Microbiology. 2015;17(5):1721-37.
- Caporaso JG, Lauber CL, Walters WA, Berg-Lyons D, Lozupone CA, Turnbaugh PJ, et al. Global patterns of 16S rRNA diversity at a depth of millions of sequences per sample. Proceedings of the national academy of sciences. 2011;108(Supplement 1):4516-22.
- Apprill A, McNally S, Parsons R, Weber L. Minor revision to V4 region SSU rRNA 806R gene primer greatly increases detection of SAR11 bacterioplankton. Aquatic Microbial Ecology. 2015;75(2):129-37.
- Bolyen E, Rideout JR, Dillon MR, Bokulich NA, Abnet CC, Al-Ghalith GA, et al. Reproducible, interactive, scalable and extensible microbiome data science using QIIME 2. Nature biotechnology. 2019;37(8):852-7.
- Parks DH, Chuvochina M, Waite DW, Rinke C, Skarshewski A, Chaumeil P-A, et al. A standardized bacterial taxonomy based on genome phylogeny substantially revises the tree of life. Nature biotechnology. 2018;36(10):996-1004.
- Chiri E, Nauer PA, Rainer E-M, Zeyer J, Schroth MH. High temporal and spatial variability of atmospheric-methane oxidation in Alpine glacier forefield soils. Applied and environmental microbiology. 2017;83(18).
- Callahan BJ, McMurdie PJ, Rosen MJ, Han AW, Johnson AJA, Holmes SP. DADA2: high-resolution sample inference from Illumina amplicon data. Nature methods. 2016;13(7):581-3.
- Wen X, Yang S, Liebner S. Evaluation and update of cutoff values for methanotrophic pmoA gene sequences. Archives of microbiology. 2016;198(7):629-36.
- McMurdie PJ, Holmes S. phyloseq: an R package for reproducible interactive analysis and graphics of microbiome census data. PloS one. 2013;8(4):e61217.
- Anderson MJ, Ellingsen KE, McArdle BH. Multivariate dispersion as a measure of beta diversity. Ecology letters. 2006;9(6):683-93.