3.1. Nanoparticles
The FTIR spectrum of graphite and GO is depicted in Figure 1a, and the broadening of the peak for GO in a range of 3000-3500 cm−1 is attributed to the stretching vibration of the hydroxy group (O-H). Further, the new peaks observed for GO at 1726, 1626, and 1040 cm−1 correspond to C-O and C=O bonds of the carboxyl group (Mural et al. 2015). Thus confirm the formation of hydrophilic GO formation. Figure 1b shows the WAXD of prepared GO and CuO. The CuO NPs has shown the characteristic peak at 35.62° and 38.62°, which corresponds to the (002) and (111) plane of CuO NPs. Similarly, graphite has shown the characteristic peak at 26.53°, which corresponds to the (002) plane. Further, the GO NPs have shown a characteristic peak at 10.45°, which attribute to the (001) plane of GO. This shift in WAXD indicates the formation of GO NPs. Further, Figure 1c corresponds to the Raman spectroscopy of Graphite and GO NPs. The peak observed at ~1580, and 1348 cm−1 for graphite corresponds to the G and D bands. The G band is attributed to the sp2 domain of graphite, and the D band corresponds to defects present. It is observed from Figure 1c that the intensity of the D band has increased for GO compared to graphite. This indicates intense oxidation of graphite to GO (Chandran et al. 2021). The surface morphology of GO NPs showed a sheet-like structure with curved edges, as depicted in Figure 1d.
3.2. Membrane characterization
FTIR spectrum as depicted in Figure 2a of pristine CA showed a typical adsorption band at 1732 cm-1, 1368 cm-1, 1229, and 1034 cm-1 which attributed to the C=O, -CH2, and C-O-C vibration from the acetyl group, respectively (Joshi et al. 2015). Similarly, the FTIR spectrum for pristine PCL shows the characteristic peaks at 2943 and 2864 cm-1 attributing the stretching band of the CH2 group in the polymer chain. Further, for PCL, the asymmetric deformation and symmetric wagging of CH3 are observed at 1472 and 1366 cm-1 bands. The asymmetric and symmetric stretching of C-O-C and C-O is also observed in 1294, 1163, and 1108 cm1 bands. The CA-PCL blends showed steady alteration in FT-IR peaks. It is observed from the FTIR spectrum of the CA-PCL blend that the characteristic peak intensity of CA observed at 1229 and 1034 cm-1 has gradually increased with the addition of PCL polymer; also, a measured shift in the peaks was observed. Similarly, the characteristic peak observed at 1732 cm-1 which corresponds to C=O, has shifted to a lower value. These results indicated that the PCL has effectively interacted with CA to form a blend (He et al. 2021). Similarly, Figure 2c corresponds to the WAXD of CA, PCL, and CA-PCL. It is observed that CA has shown only a prominent peak at 22.5° which attribute to the (200) plane of cellulose II structure (Rouhani and Fashandi 2018). Also, the WAXD of CA indicates lower crystallinity. Similarly, neat PCL has shown the characteristic peak at 21.45°, 22°, and 23.8°, which corresponds to the (110), (111), and (200) plane of orthorhombic crystalline PCL (Sun et al. 2018). Further, the WAXD peak of CA-PCL has shown both peaks at 21.45°, and 22.19° indicate the CA-PCL blend formation (Palacios Hinestroza et al. 2020). Figure 2c corresponds to the measured water contact angle, it can be seen that the contact angle of pristine CA is ~59o, which characterizes the hydrophilic nature of the polymer. Blending the hydrophobic PCL polymer (contact angle ~83.69o) into CA, increases its contact angle to 69.7o, thereby decreasing its hydrophilicity by 16.67%. This CA-PCL blended membrane can be used in the forward osmosis process to address the issue caused by the pristine CA membrane. The tensile strength and percentage elongation of the prepared neat and blend membrane are depicted in Figure 2d. Three samples were tested for each individual CA, PCL, and CA-PCL membrane, and an average value was estimated and compared. From Figure 2d, it is observed that the tensile strength of neat CA is very less as compared to the PCL, demonstrating its lower resistance to deformation. The subsequent blending of PCL in the neat CA to obtain the CA-PCL membrane exhibits a drastic improvement in its tensile strength. Also, the results display that blending has increased the elastic behavior of pristine CA by 395%.
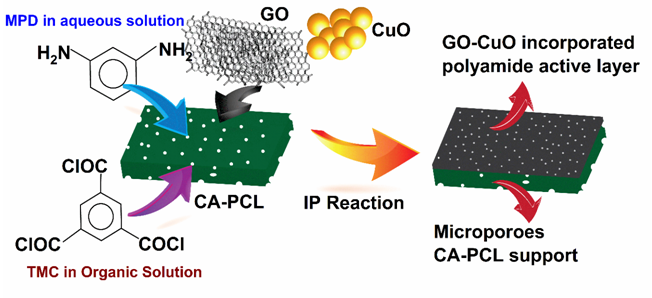
As discussed early, the blending of PCL polymer will enhance the mechanical properties of CA polymer. However, the hydrophilicity of the membrane decreases due to the hydrophobic nature of PCL. To overcome this, a thin film layer of polyamide is coated over the CA-PCL blend. Also, GO and CuO NPs were incorporated inside the thin film to form a thin film nanocomposite. The FTIR spectrum was employed to investigate molecular-level interaction. The FTIR spectrum, as depicted in Figure 3a, corresponds to Phase-Inversion CP, CPT, CPTG, and CPTGC membrane. It is observed from Figure 3a that the Phase-Inversion CP and CPT membrane has comparable peaks. The TFC coated CPT membrane has shown new peaks at 1649, 1611, and 1541 cm−1 attributed to the N-H bending aromatic amide ring and C=O stretching in -CO-NH- group, correspondingly.(Park et al. 2017)
Further, the peak located at 1661 cm−1 in the CPTG membrane is associated with the C=O stretching of the carbonyl group. This spectrum confirms the formation of new amide bonds between the NH2 group of MPD and OH groups of the GO. Further, there can be observed the presence of a new peak at 700 cm−1 and a subsequent shift in the range of 1200 cm−1 which can be attributed to the presence of copper oxide. The relative hydrophilicity of both the polyamide coated and nanoparticles incorporated membrane was measured by the Contact angle shown in Figure 3b. Time-dependent measurement of water contact angle demonstrates that the nanoparticles doped membranes, CPTGC have a better wettability than the CP membrane. The amalgamation of nanoparticles has reduced the contact angle of the CPT membrane from ~67o to ~32o, thus increasing its hydrophilicity by 52%. This increase in the hydrophilic property of the membrane was desired to reduce the antifouling behavior and increase the water flux performance.
3.3. Membrane performance
The prepared CPT membrane was tested for different concentrations of draw solute (0.1, 0.5, and 1 M of NaCl), as shown in Figure 4a. It was observed that as the concentration of draw solute increased, the water flux through the membrane increased, indicating an increase in the driving force for the process. Similarly, an increasing trend was observed for the reverse solute flux. However, 0.5 M NaCl was selected as a draw solution due to high water flux and low reverse solute flux. Further, it was observed that when GO (0.005 wt. %) is incorporated into the thin film matrix, the water flux changed from 4.75 LMH to 21.48 LMH at 0.5 M NaCl as the draw solution. Further, increase in the concentration of GO to 0.01wt.% lead to an average water flux of 26.635 LMH. This increase in water flux for the membrane could be attributed to an increase in the hydrophilicity of the membrane due to the presence of more hydroxyl groups in graphene oxide. After increasing the graphene oxide concentration beyond 0.01 wt.%, a reduction in water flux was observed, which might be because of the fact that a higher concentration of GO could have led to its aggregation in the polyamide layers of the membrane.
The optimized GO (0.01wt.%) doped membrane was later assimilated with copper oxide (CuO) on the membrane's same active layers to further increase the hydrophilicity, antifouling, and water flux properties the membrane. The water flux and reverse solute flux performance comparison of the CP-TFC (CPT), CP-TFC-GO (CPTG), and CP-TFC-GO-CuO (CPTGC) membrane against 0.5 M NaCl as draw solute is shown in Figure 5a and b. From the figure displayed it can be concluded that after incorporating both the nanoparticles, the water flux of the membranes increased by the factor of 42. Two batches of fresh laboratory-made dairy wastewater samples were processed by the forward osmosis using a draw solute concentration of 0.5 M NaCl in the AL-FS mode. Firstly, before treating the wastewater, an antifouling study was conducted between the only GO doped and GO-CuO membranes. The better performance membrane could be used for further concentration study. As can be seen from Figure 5c, the water flux declines rapidly with time for both the membranes, but when the membrane was used again after its washing (conducted inline), it was seen that the GO-CuO doped membrane was able to recover its flux, then GO doped membrane. Also, through the literature study, it is found that as the hydrophilicity of the membrane is increased, its capacity to repel the hydrophobic protein increases, thereby increasing the fouling resistance. Therefore, this copper oxide doped membrane was used for concentrating dairy wastewater. The concentration of organic matter in both feed and draw sides were effectively characterized using the TOC (Total Organic Carbon) analyzer. During the FO process conducted for nearly 80 minutes, the feed concentration increased from ~30ppm to ~37ppm, thus, concentrating the solution up to 23% and a concentration factor of 0.903.