Differences in lncRNA expression between colon adenocarcinoma tumors with low or high TMB
Clinicopathological characteristics of patients and their colon adenocarcinoma samples did not differ significantly between the training and test cohorts (Table 1). A total of 326 DE lncRNAs were identified, including 100 that were up-regulated and 226 that were down-regulated in tumors with high TMB relative to tumors with low TMB in the training set (Figure 1A). Hierarchical clustering showed that DE lncRNAs that were differentially expressed to the greatest extent could distinguish low and high TMB (Figure 1B), and this was supported by principal component analysis (Figure 1C).
Using the LASSO method and 10-fold cross validation, 20 lncRNAs were identified with non-zero regression coefficients (Figure 1D). These were incorporated into the following scoring formula: Score = (0.08653188 * AL117382.2) + (-0.1327067 * LINC02446) + (0.23340405 * LINC00525) + (-0.1271361 * LINC02195) + (0.03709934 * AC239584.1) + (0.04032968 * C027348.1) + (-0.0608802 * TFAP2A-AS1) + (-0.0580953 * AC008443.4) + (0.05483857 * LINC02441) + (0.03563485 * AC114296.1)+ (0.03438226 * AC123023.1) + (0.08208376 * AL354861.3) + (-0.0191279 * AL022316.1)+ (-0.1453998 * AP001099.1) + (-0.0273567 * LINC01630) + (0.07992558 * AC073349.1) + (-0.002779 * HOXC-AS2) + (-0.0058216 * AC129492.2) + (-0.0793168 * LINC02620) + (-0.1369001 * AC092813.1).. When classifying TMB as low or high, this scoring formula showed accuracies of 0.92 in the training cohort, 0.93 in the test cohort, and 0.93 in the two cohorts combined. The formula also showed good accuracy based on Se, Sp, PPV, and NPV (Table 2). The area under ROC curves was 0.997 in the training cohort, 0.967 in the test cohort, and 0.989 in both cohorts combined (Figure 1E-F).
Nomogram development
To predict the recurrence probability of patients with COAD using a quantitative method, we constructed a nomogram that integrated both the 10-lncRNA-based signature, TMB and the conventional clinicopathological factors (Figure 2A) to predict 3- and 5-year OS probabilities. Calibration plots indicated that the nomogram had good accuracy as an ideal model both (Figure 2B-C). In addition, we found that patients with high-expression AC027348.1 (P=0.0499), AC123023.1 (P=0.022) and AC073349.1(P=0.021) were more likely to have death due to COAD. However, the patients with low-expression LINC02195 (P=0.031), TFAP2A-AS1 (P=0.011), AL354861.3 (P=0.019) and LINC01630 (P=0.018) had higher survival rates. (Figure 2D-J).
The 20-lncRNA score correlated positively with abundance of resting natural killer (NK) cells and negatively with abundance of activated dendritic cells, M1 macrophages, activated NK cells, CD8+ T cell and T regulatory cells (Tregs) (Figure 2K). It did not correlate with abundance of plasma cells, endothelial cells, fibroblasts or CD4+ T cells. The various lncRNAs in the signature correlated with TIL abundances to quite different extents. For example, levels of AL117382.2 showed a strong negative correlation with abundances of resting mast cells, regulatory T cells (Tregs), activated NK cells and activated dendritic cells. Conversely, levels of LINC02446 showed a strong positive correlation with activated NK cells, M1 macrophages and CD8+ T cells (Figure 2L). These results suggest that the lncRNA signature score can reflect patterns of immune invasion of colon adenocarcinoma tumors.
Correlation between 20-lncRNA signature score and indicators of ICI efficacy
The score correlated negatively with the following indicators: TMB (r = -058), T-effector and interferon-γ gene signature (r = -0.54), as well as expression of PDCD1 (r = -0.49), CD274 (r = -0.61) and CTLA4 (R = -0.48) (all P < 0.001, Figure 3A-E). Samples with low scores on the 20-lncRNA signature showed high GSVA scores on several immune-related pathways, including “natural killer cell mediated cytotoxicity”, “intestinal immune network for IgA production”, “primary immunodeficiency”, and “Toll-like receptor signaling”. In contrast, samples with high scores on the 20-lncRNA signature showed high GSVA scores on several metabolic pathways, including “steroid biosynthesis”, “selenoamino acid metabolism”, “nicotinate and nicotinamide metabolism”, and “glycosylphosphatidylinositol anchor biosynthesis”. These results suggested that patients with tumors scoring low on the 20-lncRNA signature mount a substantial immune response to cancer (Figure 3F).
The signature lncRNA interacts with proteins encoded by genes in the VEGF/MAPK signaling pathway to improve ICI therapy
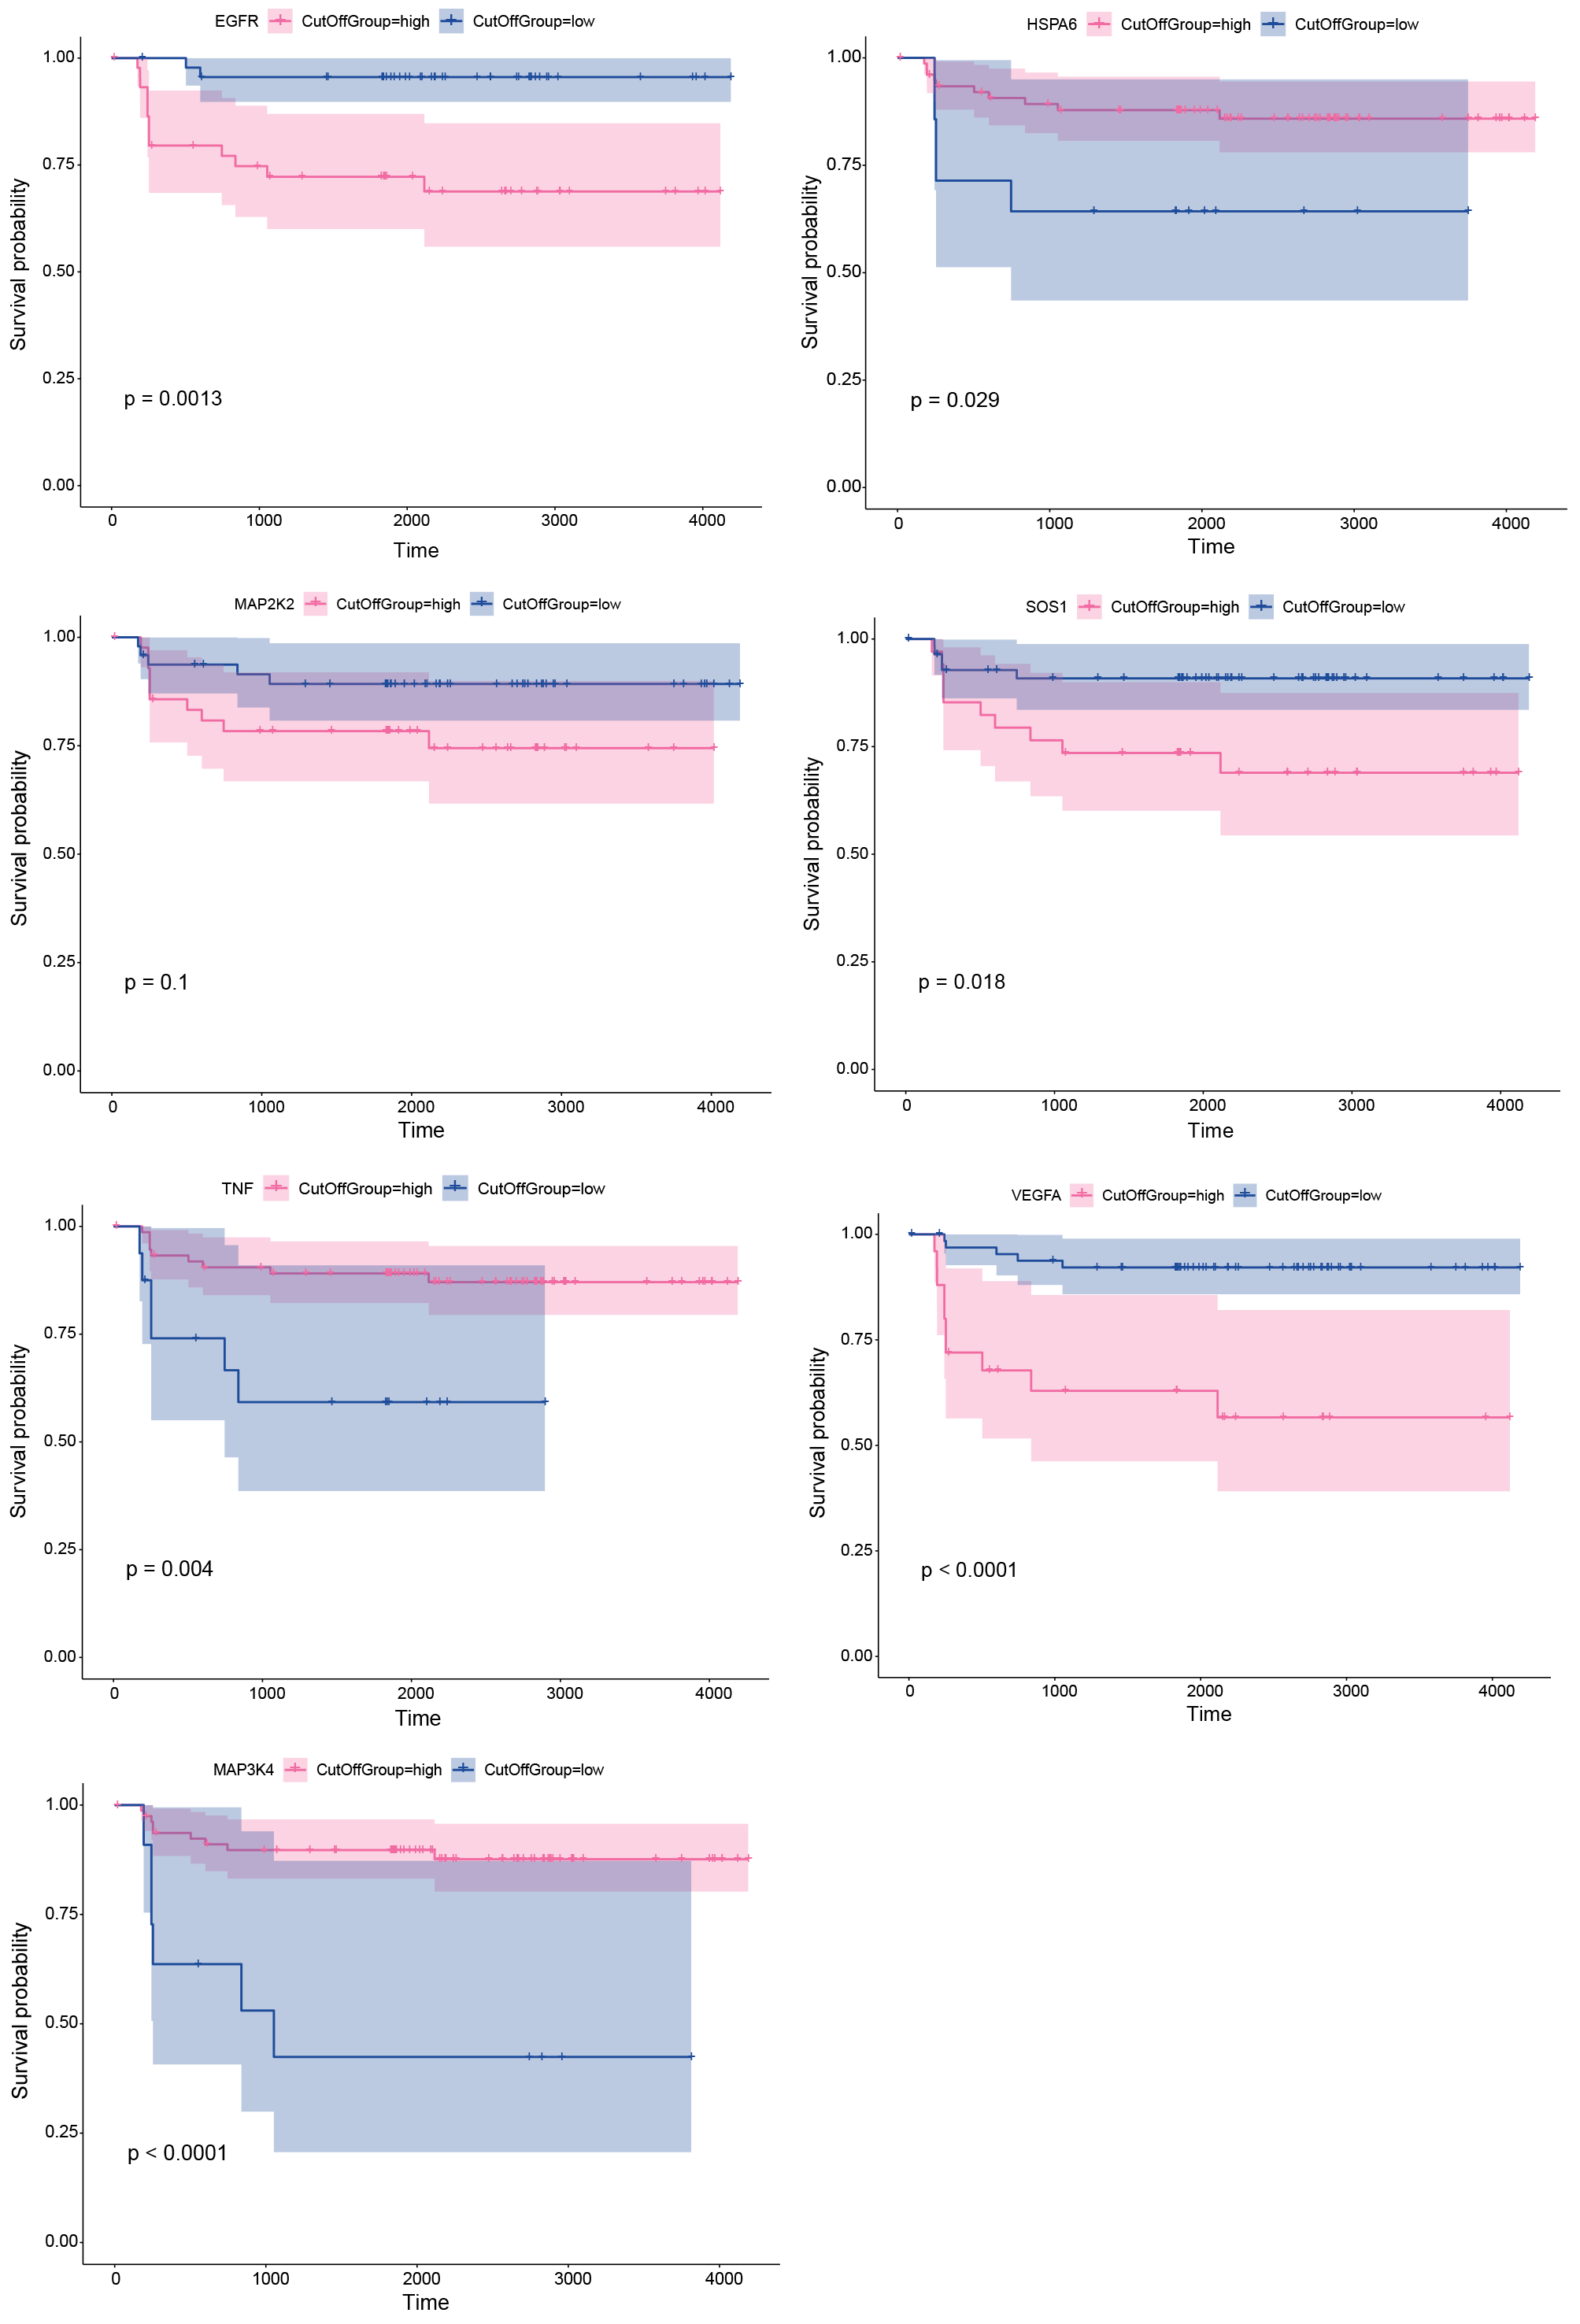
We selected VEGF and MAPK signaling pathways for further exploration, two classical immune-related signaling pathways. Based on the RNAInter database, we found that there were a wide range of interactions among 5 signature lncRNAs (AC008443.4, AC073349.1, AC239584.1, LINC00525 and AL0223161.1) with the proteins encoded by genes in VEGF/MAPK (Figure 4A). And we found that the interaction probability was higher than 0.5 between lncRNA and protein, indicating the signature lncRNA and protein were likely to interact with each other (Table 3). Compared with normal tissues, 3 characterized lncRNAs (AC008443.4, AL0223161.1, LINC00525) interacting proteins (Prediction using RF classifier>0.8, Prediction using SVM classifier>0.9) exhibited high staining in tumor tissues (Figure 4B). Molecular docking indicated that characterized lncRNAs had the potential to target binding proteins (Figure 4C). Besides, Prognostic prediction of targeted proteins in the validation set, high-expression EGFR (P=0.0013), HSPA6 (P=0.029), SOS1 (P=0.018), TNF (P=0.004), VEGFA (P<0.0001) and MAP3K4 (P<0.0001) had poor survival (Figure S1). Furthermore, we depicted a proposed mechanism based on the signature lncRNA-protein. As shown in Figure 4D, the COAD patients with the low signature score may receive better immunotherapy efficiency with ICI therapy.
Drug response characteristics based on TMB related DE lncRNAs
We trained a predictive model against GDSC data in order to estimate the IC50 for each sample in the TMBhigh and TMBlow groups. We predicted 12 drugs that might affect genes in the TMBhigh and TMBlow groups (Figure 5): ZM.447439, CCT018159, KU.55933, BAY.61.3606, Cisplatin, AUY922, AICAR, TW.37, Camptothecin, WO2009093972, X17.AAG and Thapsigargin.