3.1 Physical and chemical properties of CMS
The XRD spectra of MS samples (Fig. 1) demonstrated the presence of MgCO3 (JCPDS card No. 08-0479), Mg3(OH)4SO4·8H2O (No. 53-1039), SiO2 (No. 75-0443), etc., the XRD analysis revealed that the composition of MS was consistent with that result of XRF. After calcination, The XRD spectra of CMS peaks indicated the formation of MgO particles from MgCO3, Mg3(OH)4SO4·8H2O during pyrolysis, SiO2 (No. 75-0443) was also observed as the which remains from the raw magnesite waste. The highly dispersed MgO particles on CMS was ascribed to the dehydrogenation and decomposition of MgCO3, Mg3(OH)4SO4·8H2O compounds(Choudhary et al. 1992), which could provide efficient adsorption site for phosphate in water(Jiang et al. 2019, Luo et al. 2021).
Understanding the calcination processes of MS was crucial for insight into the active site formation of material. The calcination behavior of CMS generated from MS was analyzed by TGA-DTA (5°C/min to 800°C). As depicted in Fig. 2, the turning temperature points indicated different stages of MS decomposition, the first step ranged from room temperature to 120°C was ascribed to the loss of water and volatiles from the MS(Luo et al. 2021). The second step varied from 120 to 318°C was the dissociation of crystal water. The third stage within the range of 318 to 451°C was attributed to the decomposition of hydroxyl(Wang et al. 2020). The fourth stage ranged from 451 to 681°C was the conversion of carbonate into CO2.The decomposition of MS during the thermal treatment, as shown in the following reaction.
Mg3(OH)4SO4·8H2O→MgO+SO3+H2O
MgCO3·nH2O→MgO+CO2+H2O
MgSO4→MgO+SO3
MgCO3→MgO+CO2
The morphology and microstructure of the MS and CMS were processed using SEM, EDS(Fig. 3). The SEM proved that the morphology between MS and CMS was significantly different. As shown in Fig. 3a, the SEM image of MS showed irregular plates with a smooth surface, as well as sharp edges and corners. Fig. 3b shows in-situ generated homogeneous nano metal oxide particles on the surface of CMS, the obtained nano particles provided more adsorption sites, and improve phosphate adsorption capacity.
The elemental contents of pristine MS and CMS were analyzed by EDS (Fig. 4c, 4d), the EDS analysis showed the amounts of Mg, O, Ca, Si, Al and Fe elements in the composites. As would be expected, the O% in the CMS decreased, and the Mg, Si, Ca, Al% increased after calcination.
It is well known that Mg, Ca, Fe and Al have a high chemical affinity to phosphate. The MgO, as one of main components of CMS can easily react with phosphate to form Mg-PO4(Mg3(PO4)2, Mg(H2PO4)2, MgHPO4) composition via precipitation reaction(Liu et al. 2019). The CaO, Fe2O3 and Al2O3 can react with phosphate ions to form Fe–O–P, Al-O-P complexes by surface complexation(Liu et al. 2019, Peng et al. 2019). Therefore, the CMS used in this work contains MgO, CaO and Fe2O3 was promising for phosphate removal from wastewater.
Table 2 lists the porosity-related characteristics (e.g., BET surface area, pore volume, and average pore diameter) of MS and CMS. The MS and CMS were classified as type II isotherms (Fig. 5) with distinct hysteresis loop according to the International Union of Pure and Applied Chemistry classification. Compared to raw MS (specific surface area 4.69 m2 g−1, total pore volume 0.0315 cm3 g−1), CMS featured triflingly increased textural properties (specific surface area of 4.73 m2 g−1 and total pore volume of 0.0356 cm3 g−1). The specific surface area, total pore volume and average pore diameter of the MS and CMS were approximately similar. The BET data suggested that the in-situ generated metal oxide particles did not impact the specific surface area of CMS.
Table 2
Surface area and pore structure of the MS and CMS.
|
Sample
|
SBET(m2 g-1)
|
VTotal (cm3 g-1)
|
Average pore width (nm)
|
|
MS
|
4.69
|
0.0315
|
26.87
|
|
CMS
|
4.73
|
0.0356
|
30.1
|
3.2 Impact of calcination temperature on phosphate adsorption capacity
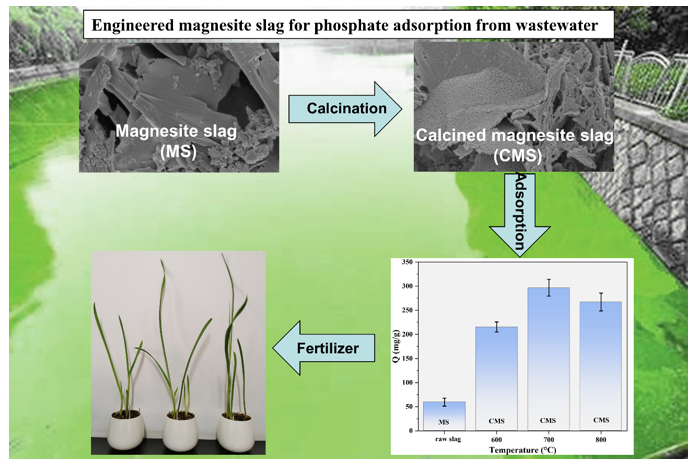
The effects of calcination temperature on phosphate adsorption capacity were shown in Fig. 6. With an increase in the calcination temperature from 600°C to 800°C, the SEM figures indicate that a visible increase of nano particles formation on the surface of the CMS. The phosphate adsorption capacity of CMS increases rapidly with the increase of calcination temperature, and then slight decrease when the calcination temperature exceeded 700°C, the phosphate adsorption capacity was 296.9 mg g−1(59.5 mg g−1 of MS). The calcined magnesite slag exhibited much higher adsorption capacity than the pristine magnesite slag. It is mainly because that the high-temperature calcination process could in-situ generate metal oxide particles on the magnesite slag surfaces, which can significantly increase the affinity to phosphate in solution. Thus, the calcination treatment can effectively enhance the phosphate adsorption activity and capacity of magnesite slag, Considering the adsorption amounts and related economic aspects of CMS, CMS-700 was selected for further investigation.
3.3 Impact of pH on phosphate adsorption capacity
The solution pH strongly influenced the adsorption capacity of adsorbent in adsorption process(Zheng et al. 2020). In this work, the effects of pH on phosphate adsorption capacity of CMS were determined by adsorption isotherms, the obtained equilibriums data were fitted by using Langmuir(Eq. 2) and Freundlich(Eq. 3) isotherm models(Fig. 7), the adsorption isotherm parameters were presented in Table 3, as compared to the regression coefficient(R2), the Langmuir adsorption model showed more satisfactory fitting to the phosphate adsorption isotherms on CMS, which indicated that phosphate adsorbed on CMS is primarily monolayer adsorption. With the increase of pH from 5 to 11, the phosphate adsorption capacity increased, then slight decrease. When the pH value was 9, the highest phosphate capacity for CMS was 526 mg/g, similar results had been reported by other studies(Liu et al. 2020, Luo et al. 2021, Xu et al. 2018, Yang et al. 2014). Thus, CMS had a wide range of pH values from 5~11, alkaline wastewater was more favorable for the phosphate adsorption process. Some studies reported that the main existent of phosphate was H2PO4− and HPO42− ions at pH 9 value. The MgO and other metal oxide can generate electrostatic attraction with H2PO4− and HPO42− at alkaline environment(Deng et al. 2020).
Table 3
Adsorption isotherms constants for phosphate adsorption onto CMS 700 by different pH of solution.
|
pH
|
Langmuir model
|
Freundlich model
|
|
K
(L mg-1)
|
qm
(mg g-1)
|
R2
|
Kf
|
n
|
R2
|
|
5
|
0.255
|
410.6
|
0.96
|
147.4
|
4.5
|
0.85
|
|
7
|
0.196
|
430.6
|
0.98
|
128.7
|
3.76
|
0.87
|
|
9
|
0.114
|
526
|
0.99
|
105.2
|
2.61
|
0.97
|
|
11
|
0.16
|
519.8
|
0.97
|
146.8
|
3.53
|
0.94
|