Animal experiments:
C57BL/6J young (3-months) and aged (20 months) male mice were housed in a specific pathogen-free facility (light cycle 12/12 h light/dark). Food and water were provided ad libitum. Due to changes in estrous cycle that has impact on histamine levels in young females[33], we used only males for this study.
Experimental groups
To examine the role of histamine after stroke in young (Yg) and aged (Ag) mice, mice underwent MCAO surgery and were euthanized at 6h (n=5), 24h (n=5) and 7 days (n=5) post-ischemia; sham mice received the same surgery but the suture was not inserted into the MCA (n=3,5). In total, the groups were divided into Yg-6-sham, Yg-6-stroke, Yg-24-sham, Yg-24-stroke, Ag-6-sham, Ag-6-stroke, Ag-24-sham and Ag-24-stroke. Seven-day post-ischemic studies were performed only in aged mice (Ag-7d-Sham and Ag-7d-Stroke). A mortality of 20% was observed in the aged 24 hours MCAo cohort additionally, 40% mortality was seen at 7 days in aged MCAo mice.
Middle cerebral artery occlusion (MCAo)
Animals in the respective groups underwent transient focal ischemia under isoflurane anesthesia for 1 hour by occlusion of the right middle cerebral artery (MCA). Body temperature was maintained at 37.0 ± 1.0°C throughout the surgery by an automated temperature control feedback system. One hour after MCAo, animals were re-anesthetized and reperfusion was established by the withdrawal of the monofilament. Animals were placed in a recovery cage. All mice were given subcutaneous injections of 0.9% sodium chloride twice a day for 7 days and were provided with wet mash in their cages. Body weight was recorded daily for the duration of the experiments. All experiments were performed by investigators blinded to animal groups and treatments to reduce experimenter bias. (Blinded: Due to the size of these animals and stroke having impact on how the animals behave, we used the following methods to blind our samples and the analysis. We followed the blinding of the harvested samples. Tissue harvesting was performed by a blinded individual and analysis is performed by a separate individual who is also blinded. For IHC, the histology core processed the embedding and sectioning of the samples and were performed blinded. Staining was performed and followed up with imaging and analysis blinded. Only after the quantification we un-blinded the samples to allocate them to the respective groups).
Immunohistochemistry:
Formalin fixed, paraffin-embedded intestinal (cecal, ileum) tissue sections (4 µm) were incubated overnight at 4 °C with a primary antibody targeting the mouse antigens 1) histamine receptor 2 (AHR-002, Alomone labs, Israel), 2) Tryptase (ab2378, Abcam, USA), after antigen retrieval according to the manufacturer’s instructions. Samples were washed and subsequently incubated with secondary antibody for 45 min at RT (Histofine simple stain anti-rabbit, 414341F, Nacalai, USA and Alexa fluor® 647, ab150131, Abcam, USA). Sections were counter-stained either with the diaminobenzidine substrate kit (Nacalai, USA) followed by haematoxylin or sections were stained with 6-diamidino-2-phenylindole (DAPI, Thermofischer, USA) as previously described for visualization of cell nuclei.
Lectin staining to visualize intestinal mucus secreting goblet cells:
Mouse cecal segments were fixed in Carnoy’s fixative, embedded in paraffin and serially sectioned to 5 mm sections. Section were stained with hematoxylin and eosin (H&E) for intestine architecture. Terminal mucin glycans were examined using a panel of FITC-conjugated lectins: Ulex europaeus agglutinin-1 (UEA-1) for terminal fucose; concanavalin A (CONA) for mannose, Dolichos biflorus agglutinin (DBA) for N-acetylgalactosamine, Peanut agglutinin (PNA) for galactose and Wheat Germ Agglutinin (WGA) for N-acetylglucosamine (Vector Laboratories, Burlingame, CA) as previously described [34]. Briefly, de-paraffinized sections were incubated with citrate buffer pH 6 (Vector Labs) for 20 min in a pressure cooker and blocked with PBS containing 10% BSA. Sections were then stained in a humidified chamber with FITC-labeled lectin (10 mg/ml) for 1 h at room temperature. Sections were washed with PBS, counterstained with DAPI (Thermo Fischer, USA) for 5 min at room temperature and mounted using aqueous mounting media (Sigma Aldrich). Sections were analyzed by confocal microscopy (Leica Dmi8) and fluorescence was semi-qualitatively calculated by tabulating mean pixel intensity using ImageJ software (National Institutes of Health).
mRNA in-situ hybridization of intestinal tissues:
mRNA in situ hybridization (ISH) was performed on the distal ileum part of intestinal tissue from the sham and stroke cohort by using the RNAscope 2.5 HD assay system (Advanced Cell Diagnostics, Hayward, CA) with recommended probes [Probe-Mm-Hrh1 (Catalogue # 491141), Probe-Mm-Hrh2 (catalogue # 517751), RNAscope 2.5 HD reagent kit-Red]. ISH scores were generated at ×200 magnification and recorded using the RNAscope system Counting guidelines: number of purple dots (positive stain for H2R mRNA) per villi. Each point represents data from 15 crypts per section per sample.
Fluorescence in situ hybridization (FISH)
For intestinal tissue preparation, the small and large intestines were carefully removed immediately following euthanasia and rapidly dissected. Mouse terminal ileum (3-6 cm above the cecum), cecum, and mouse proximal and distal colon were carefully removed, fixed in 10% formalin fixative at room temperature for 24 hours followed by 70% ethanol transfer, then rinsed in 100% ethanol and embedded in paraffin wax. The tissues were sectioned at a thickness of 4 µm. These sectioned tissues were used for FISH staining as described. Four µm sections were mounted on glass slides, baked at 60°C for 1 hour, then de-paraffinized with xylene and dehydrated in 100% ethanol followed by incubation in ddH2O. A previously validated, 5’ Cy3’-labelled, EUB338 bacteria-specific probe (Bact338; 5’- GCTGCCTCCCGTAGGAGT-3’) which is complimentary to the V1 to V4 region of the 16S rRNA gene that is highly conserved in bacteria domain. The probe was hybridized to the samples by adding 20-25 µL of 1:25 dilution probe with hybridization buffer to each slide and placed in a hybridization chamber at 51°C for overnight. Nuclei were labeled with DAPI. Intestinal sections from mice in each cage (total 5-6 per group) were utilized to confirm bacterial location. The slides were analyzed using a Leica DMi8 confocal microscope (Leica biosystems, USA) equipped with appropriate filter set for Cy3’ fluorescence (ex 550nm / em 570 nm).
Intestinal content collection and 16S rRNA gene sequencing:
Microbiota in the intestinal (cecum and feces) samples, were collected from mice and stored in sterile tubes at -80°C until analyzed. Bacteria taxa in each intestinal content samples were analyzed by amplifying the V4-V5 hyper-variable regions of the 16S rRNA gene using high throughput sequence analysis (Illumina MisSeq platform). Quality filtered 16S rRNA sequences were clustered into operational taxonomic units (OTU’s), with 97% similarity, by closed reference OTU-picking using the UCLUST algorithm and GreenGenes reference database (v13.5) as implemented in Quantitative Insights Into Microbial Ecology (QIIME versions 1.6 and 1.7). Sequences were checked for chimeras using ChimeraSlayer with standard options as implemented in QIIME. Sequences not clustered were identified using the Ribosomal Database Project to the lowest possible taxonomic level. The data were randomly rarefied to 10,000 sequences per sample prior to any downstream analysis.
Murine cytokine measurements in blood plasma by protein multiplex:
Relative amounts of GM-CSF, IFN-gamma, IL-1, IL-6, IL-9, IP-10/CXCL10, MCP-1/CCL2, VEGF-A and G-CSF in the blood plasma were measured using cytokine multiplex kits (Millipore, Billerica, MA, USA). Quantification of cytokines was performed using the MAGPIX system (Austin, TX, USA) according to the manufacturer’s instructions. Briefly, 25 µl of plasma samples collected from each mouse were thawed completely and diluted with the same amount of Assay Buffer provided in the kits. The assays were performed in duplicate blindly. The reports generated by MILLIPLEX® Analyst 5.1 Software were carefully reviewed and only cytokines that were within the limit of detection value and below the saturated value were considered. The detection limits for the aforementioned cytokines were between 10,000 pg/ml and 3.20 pg/ml, respectively.
mRNA gene expression in the intestinal mucosa:
To quantify relative mRNA expression levels of Histamine receptor 1 and 2 (H1R and H2R), interferon (IFN)-γ, tumor necrosis factor (TNF)-α, interferon gamma-inducible protein (IP)-10, interleukin (IL)-6, IL-1 and IL-12, RNA was extracted from intestinal mucosa samples (cecum) using the miRNeasy® mini kit (QIAGEN). One µg of RNA was reverse-transcribed to single-stranded cDNA using the RevertAid H minus First Strand cDNA Synthesis Kit (Thermo Fischer, USA). Reverse transcriptase real-time (RT) PCR was performed using the Quant Studio 3 Real-Time PCR system (Applied Biosystems, USA). The RT-PCR reaction mix (adjusted with H2O to a total volume of 20 µl) contained 1 µl template DNA, 10 µl Power SYBR Green PCR master mix (ABI), 0.5 µl of the respective primers (10 µM each). The forward and reverse primers used for IFN-γ, IP-10, IL-12, IL-17, TNF-α, and IL-6 quantification were described previously [5, 35]. Relative mRNA target gene expression levels (Ratio = [(Etarget) dCPtarget (control-sample)] / [(Eref.) dCPref. (control-sample)]) were normalized to the house keeping gene glyceraldehyde 3-phosphate dehydrogenase (GAPDH) and used as a reference. Subsequently, intestinal mucosal cytokine of the sham control group were set to 1.0 and used as the calibrator to identify the relative mRNA fold difference between the sham and stroke groups at 6 hours, 24 hours and 7 days after stroke.
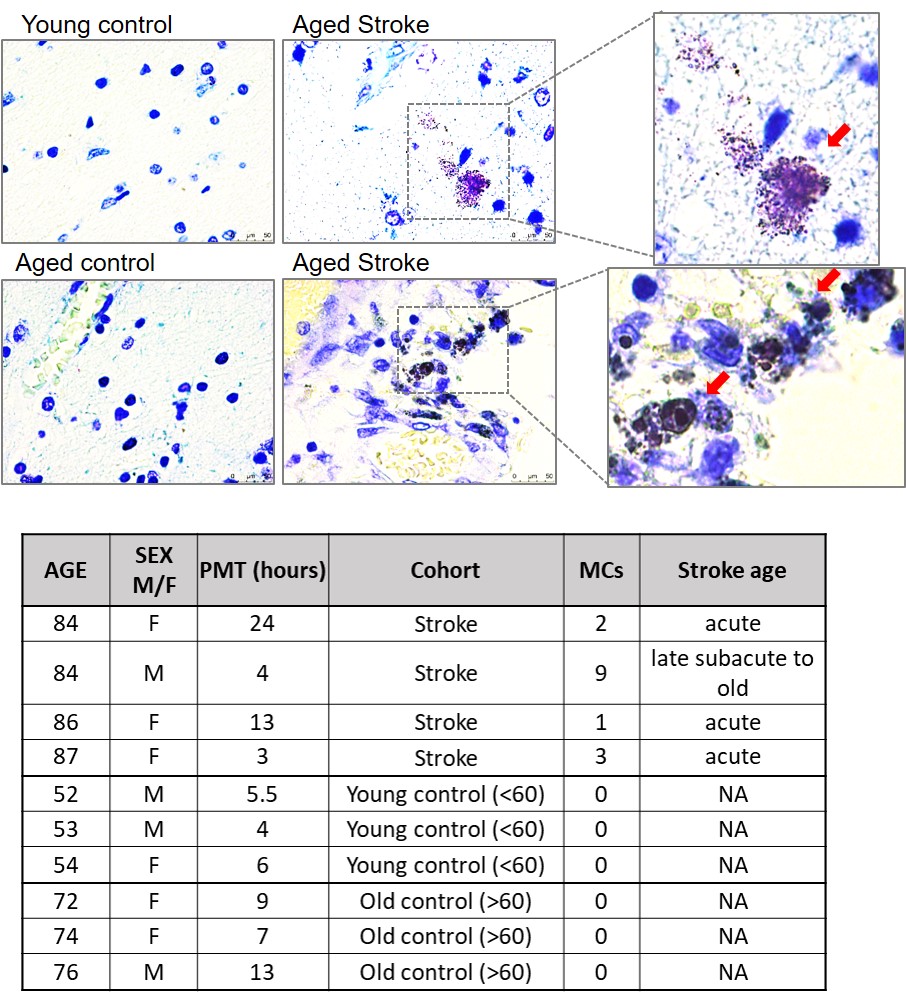
Toluidine blue staining in human autopsy brain:
Formalin fixed paraffin embedded human brain autopsy sections were cut at 30µm. The slides were deparafinnized and hydrated. Slides were treated with Toluidine blue working solution (1% Toluidine blue ethanol solution in 1% sodium chloride) followed by dehydration. Nuclei were counterstained with hematoxylin. Human brain autopsy samples were obtained from stroke patients. The infarct region is from the cortex. MCs were quantified by counting the positively stained cells around the infarct region per section with a 40X magnification.
Flow cytometry:
Brain: After removal of intestinal tissue, mice were transcardially perfused with 60 ml cold, sterile PBS prior to aseptic removal of spleen, lung, and brain tissues. Brain tissue was placed in complete Roswell Park Memorial Institute medium 1640 (Lonza) medium and mechanically and enzymatically digested in Collagenase/Dispase (1 mg/mL) and DNase (10 mg/mL; Roche Diagnostics) for 45 minutes at 37 °C. Lung tissue was processed similarly with the exception that digestion cocktail contained hyaluronidase (MilliporeSigma, 3000U/digestion), as well. The cell suspension was filtered through a 70 μm filter. Leukocytes were harvested from the interphase of a 70%-to-30% and 70%-to-40% Percoll gradients for the brain and the lung tissues, respectively. MCs were gated for CD45 positive (+) followed by FCeR1+ with CD117 (c-Kit+) expression.
Intestines: Tissue-specific protocols were used to obtain single cells suspensions. Following the euthanasia by Avertin injection, small (ileum) and large (cecum and proximal colon) intestines were rapidly removed and placed in ice-cold PBS. The intestinal tissue was opened longitudinally after removal of fat and connective tissues. Fecal content was removed and the tissue was cut into pieces (approximately 1.0 cm) after washed in ice-cold PBS. Intestinal tissues were then incubated in 5 mL of 5 mM ethylenediaminetetraacetic acid (EDTA) in Hank’s Buffered Salt Solution (HBSS, Invitrogen, Carlsbad, CA) for 30 min at 37 °C with slow rotation (100 rpm). The epithelial cell layer was removed and filtered through a 70 μm cell strainers. The retrieved intestinal pieces were washed in HBSS and cut into smaller pieces and immersed in 10 mL digestion solution containing 5% FBS (Sigma-Aldrich, St. Louis, MO), collagenase IV (1.75 mg/mL; Roche, Nutley), and DNase I (0.5 mg/mL; Sigma-Aldrich) at 37 °C for 45 min with slow rotation. MCs were gated for CD45 positive (+) followed by FCeR1+ with CD117 (c-Kit+) expression.
Mass spectrometry histamine quantification:
Histamine concentrations were quantified in the blood plasma at 6 hours, 24 hours post-stroke and sham control of Yg and Ag mice. Blood plasma was processed through methanol (Sigma Aldrich, USA) separation. The obtained supernatants were transferred into 3-kDa filtrate and centrifuged for 14,000 g, 40 min at room temperature. Flow-through was collected and mass spectrometry analysis was performed. Mass spectrometric quantification was performed as follows,
Histamine, formic acid (FA), and perfluoroheptanoic acid (PFHA) were obtained from Sigma-Aldrich (St. Louis, MO). Histamine-α,α,β,β-d4 was obtained from CDN isotopes (Pointe-Claire, Canada). Water and acetonitrile (ACN) were obtained from Fisher Scientific (Waltham, MA). The histamine-d4 internal standard solution was prepared at a concentration of 250 ng/mL of d4-histamine in water with 0.1% FA. 30 µL of internal standard solution was added to 30 µL of each sample, vortexed for 1 min, and dried in a SpeedVac for 5 hours. 30 µL of water:0.1% FA was added to each sample, vortexed for 1 min and centrifuged for 5 min at 10,000 rpm. Samples were then loaded into 0.5 mL autosampler vials for quantification.
Chromatography was performed on a Shimadzu (Kyoto, Japan) Nexera-XR HPLC system consisting of a SIL-20ACxr autosampler, a CTO-20AC column oven and 2 LC-20ADxr binary pumps. Samples were loaded onto a Phenomenex (Torrance, CA) 1 mm x 50 mm phenylhexyl reversed-phased column equipped with a Phenomenex phenylhexyl 4 mm x 2 mm guard column. The aqueous mobile phase (A) consisted of H2O:ACN:FA:PFHA (99.3:0.5:0.1:0.1 v/v/v/v) and the organic mobile phase (B) consisted of H2O:FA (99.9:0.1 v/v). Column flow was 80 µL/min and 5µL of sample was injected onto the column and eluted with a constant mobile phase flow rate of 80 µL/min. The elution gradient was optimized as follows: started from 10% B and increased to 70% B over 5 min; ramp to 80% B for 6 sec and held for 1min; ramp back to 10% B over 6 sec and maintained at 10% for a total chromatographic run time of 12 min to re-equilibrate.
Selected reaction monitoring (SRM) was performed on a Sciex (Framingham, MA) 6500 QTRAP with a Turbo V source. The mass spectrometer was operated in the positive ion mode under the following conditions: curtain gas: 20 psi; collision gas: HIGH; spray voltage: 4.5 kV; ion source gas 1: 20 psi; ion source gas 2: 20 psi; interface heater temperature: 175° C; Q1 and Q3 resolution: unit; scan time: 100 mS; de-clustering potential: 100 V; entrance potential: 8 V; collision exit potential: 10 V. The instrument was calibrated by using Sciex PPG calibration standard and tuned to the manufacturer’s specifications. SRM transitions monitored for histamine were 112 → 95 (20eV) and 112 → 68 (30eV). For histamine-d4, the SRM transitions 116 → 99 (20eV) and 116 → 72 (30eV) were monitored. Data were acquired with Analyst® Software (ver 1.6.2) and quantification performed using Multiquant™ Software (ver 3.0.1).
Statistics:
Data were tested for normal distribution using the Kolmogorov–Smirnov test. Normally distributed data are presented as means with standard deviation while the medians with their range are given for non-normally distributed data. Significance of differences between Sham (control) and Stroke (experimental) at 6 hours, 24 hours and 7days post-stroke mice were analyzed using the One-way analysis of variance test for normally distributed data (or) the Kruskal-Wallis test for non-normally distributed data, followed by either Bonferroni /Tukey’s multiple comparison post-hoc tests. Differences between sham and stroke at single time-point were analyzed using students t-test followed by the Mann-Whitney test for non-normally distributed data. Differences between the groups were considered significant at *P < 0·05, **P<0.01, ***p<0.001. Prism 5.0 software (Graph Pad Software, Inc., La Jolla, CA, USA) for Windows, was used for data presentation and for data analysis. All experiments were performed by an investigator blinded to stroke and age groups during analysis. Differences in Phyla in the gut microbiota of young and aged mice were analyzed using the unweighted UniFrac distance and plotted in a Principal Coordinates Analysis. The UniFrac distance is a measure that takes into account the branch length shared by the young and aged microbiota when placed on a common phylogenetic tree[36, 37].