Differential expression of m6A related genes in Lung cancer
By analyzing the expression of 17 m6A related genes in 233 TP53 mutant samples and 236 TP53 wild-type samples, we found that the expression of 9 genes were significantly different between two cohorts (Figure1A-B). The coexpression analysis showed that WTAP was significantly negatively correlated with YTHDC1, ZC3H13, METTL3 and METTL16 in the wild-type, while the negative correlated genes in mutant cohort are FTO and METTL3, YTHDC2 and HNRNPC. Most of the other genes are positive correlated in two cohorts (Figure 1C-D).
Clustering and grouping prognoses for mutant and wild-type cohorts
The wild-type cohort and the mutant cohort were divided into two clusters by consensus clustering respectively, based on the expression profiles of all genes in TCGA (Figure 2A-B). In the process of consensus clustering, we analyzed the possibility of clustering count (k value) from 2 to 9 (Figure 2C-H). Finally, k=2 was applied to the mutant cohort and the wild-type cohort. The clinicopathological characteristics of the patients in each cluster are listed in Table 1.
We then analyzed the clinicopathology and survival of two subgroups of each cohort. We found that two subgroups of wild-type have a significant difference in T stage, while a more significant difference in M status consists in mutant cohort. There was a significant difference in stage exists in both cohorts (Figure 3A-B). However, survival analysis, according to the results of both in the wild-type cohort (p=0.121) and mutant cohort (p=0.089), survival situation between the subgroups were no significant differences (p<0.05) (Figure 3C-D).
Independent prognostic signatures building and comparison in wild-type and mutant cohorts
We then constructed a prognostic model by using univariate cox regression and multivariate cox analysis. Univariate cox regression was applied to m6A related regulators to screen prognostic-associated genes. HNRNPA2B1 gene has a good correlation with prognostics in cases without TP53 mutant, and is positively correlated with prognostic risk. This “risk gene” in cases with TP53 mutant are HNRNPA2B1 and ALKBH5, with which P < 0.05 (Figure 4A-B). When we expanded the range to P <0.1, 5 of 17 genes in the wild cohort came into view (FTO, METTL14, HNRNPC, HNRNPA2B1 and YTHDC2), while the number in the mutant cohort is 10 (FTO, RBM15, METTL3/14/16, HNPNPC, HNPNPA2B1, YTHDC1, ALKBH5 and ZC3H13). Interestingly, high expression of FTO or METTL14 means different prognostic risk in cases with and without TP53 mutant. Forest map shows that high expression of FTO and METTL14 was considered low risk in the wild-type patients, which was exactly the opposite in the mutant patients (Figure 4A-B).
We constructed prognostic signatures of 17 genes in mutant cohorts by using multivariate cox regression analysis to predict patients’ prognostic risk score with the coef value of each gene calculated. By this method, we established prognostic signatures containing 2 genes in the mutant cohorts. Then based on the calculated risk score, the patients were divided into the high-risk group and the low-risk group. Signature of 2 genes (HNRNPA2B1 and ALKBH5) also did well in separating mutant patients into two groups according to risk score and was statistically significant in overall survival (Figure 4C). The results of ROC curve also showed that it was feasible to evaluate the overall survival rate of lung cancer patients using risk score obtained by multivariate cox analysis in the TP53 gene mutant patients. (Figure 4D). Significant gender differences were revealed when exploring the relationship between demographics and clinicopathology (figure 5C). To validate the signature`s performance in predicting the patients outcome, univariate and multivariate cox regression were applied to evaluate the accuracy of demograghy, clinicalpathlogy and risk score. And the result showed that whether in univariate or multivariate cox regression analysis, risk score performed well in predicting the prognosis of TP53 mutant patients (figure 5A-B). This result indicates that the independent prognostic model constructed by ALKBH5 and HNRNPA2B1 has better predictive value than TNM staging in TP53 mutant patients. In the framework of the relationship of the risk score and patient survival we constructed, we can perceive that in the figure 5D, cases were arranged in order of risk score from low to high. In the scatter plot, we observed that green plots become sparse as the risk score increases, and the red plots are the opposite (figure 5D-E). It can also be concluded that with the increment of HNRNPA2B1 and ALKBH5 expression, an increasing trend occurred in the risk score (figure 5F). These finds confirmed the accuracy of the independent prognostic model.
The following we explored the distinction of m6A regulators between high-risk and low-risk group. The results showed that the expression of ALKBH5 in high-risk group was higher than low-risk which difference was statistical significance, as similarly found in the result of HNRNPA2B1 transcript (figure 5G). Among them, more than half of m6A regulators expression differential between two groups (figure 5H).
m6A-regulated signaling pathways and functional enrichment
In order to explore the elements for the different prognostics between high and low risk groups, GSEA analysis was conducted to excavate the different signaling pathways and cell functional enrichment. As is shown in figure 7, biological functions related to cell proliferation and DNA synthesis were highly enriched in high-risk group which including cell cycle, spliceosome, folate involved one carbon metabolism, aminoacyl-tRNA synthesis, RNA degradation, DNA replication, purine and pyrimidine metabolism, mismatch repair (MMR) and nucleotide excision repair (NER), etc. IgA producing intestinal immune networks was observed to be silent in high-risk group and enriched in low-risk group (figure 6). FDR<0.05 of signaling pathways and cell functions was used as inclusion criteria in GSEA analysis.
Then we searched for the differentially expression genes (DEGs) between high and low-risk groups. Using the R version tool, DEseq package, 338 DEGs get into our field of view. Heatmap and volcano plot were shown in figure S1. The 338 DEGs are analyzed in BINGO plugin of cytoscape, and the functional enrichments of three modules of GO analysis (BP, CC, MF) were output. In the cellular component analysis, we observed that most of the biological functions of enrichment on extracellular region and plasma membrane. Molecular functions dominated by these DEGs are more enrichment in receptor binding, organic acid transmembrane transporter activity, IgE binding, symporter activity, etc. Biological processes associated are mainly the regulation of response to external stimulus, cytolysis, humoral immune response, response of fibrinolysis, etc. (figure 7A). And these molecular functions and biological process can also be verified in the heatmap that output by R version (figure 7B).
We then put all the DEGs to STRING web tool (http://string-db.org/) to analyze the protein-protein interaction network to further determine the molecular mechanism of the DEGS (figure 7C). And the PPI network obtained from the String database is then imported in cytoscape for visualization. Green nodes represent the down-regulated genes and red nodes represent the up-regulated genes (in high-risk groups) (figure 7).
Relationship between m6A regulators and prognostic in TP53 mutant individuals
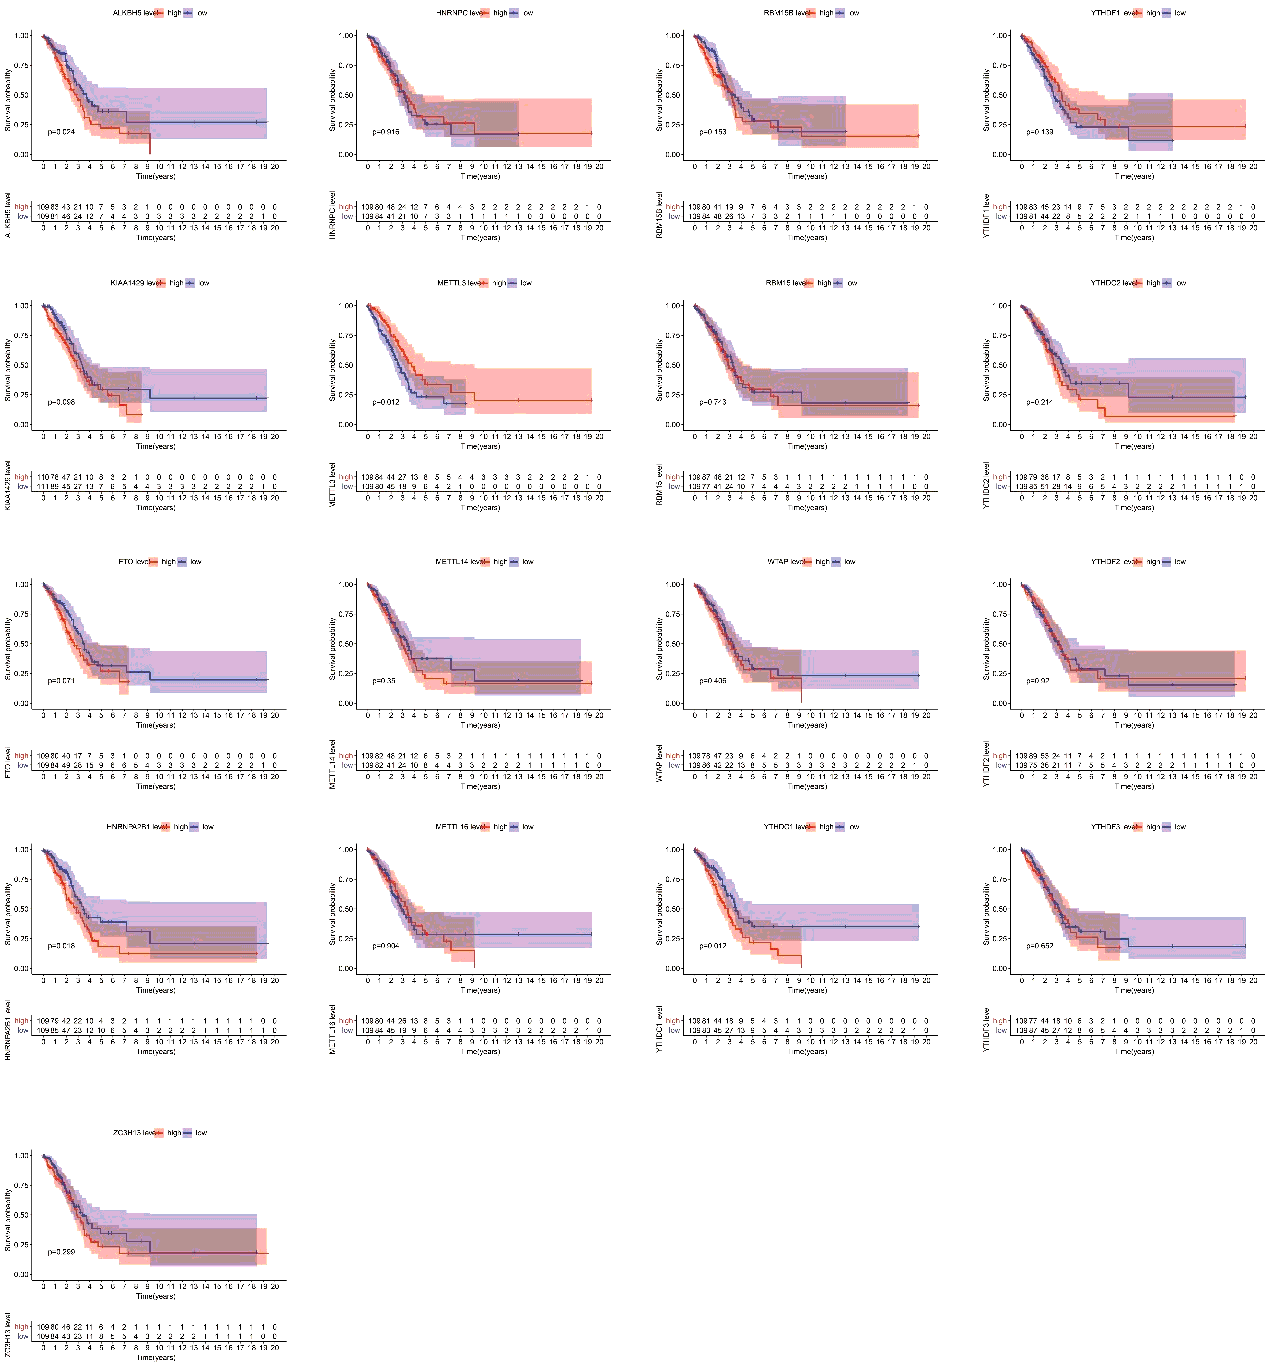
Finally, we assessed the relevance between m6A regulators expression and overall survival in TP53 mutant patient cohort. All the cases were categorized into two groups by median expression value of each gene, and Kaplan-Meier survival curves were plotted between high-expression and low-expression groups. According to the feedback information from the survival curves, we got that 4 regulators including ALKBH5, METTL3, HNRNPA2B1 and YTHDC1 which expression levels were significantly correlated with survival (figure S2).
 package “Survival” and “glnmet” were applied to univariate cox and multivariate regression cox in R version 4.0.2 respectively.
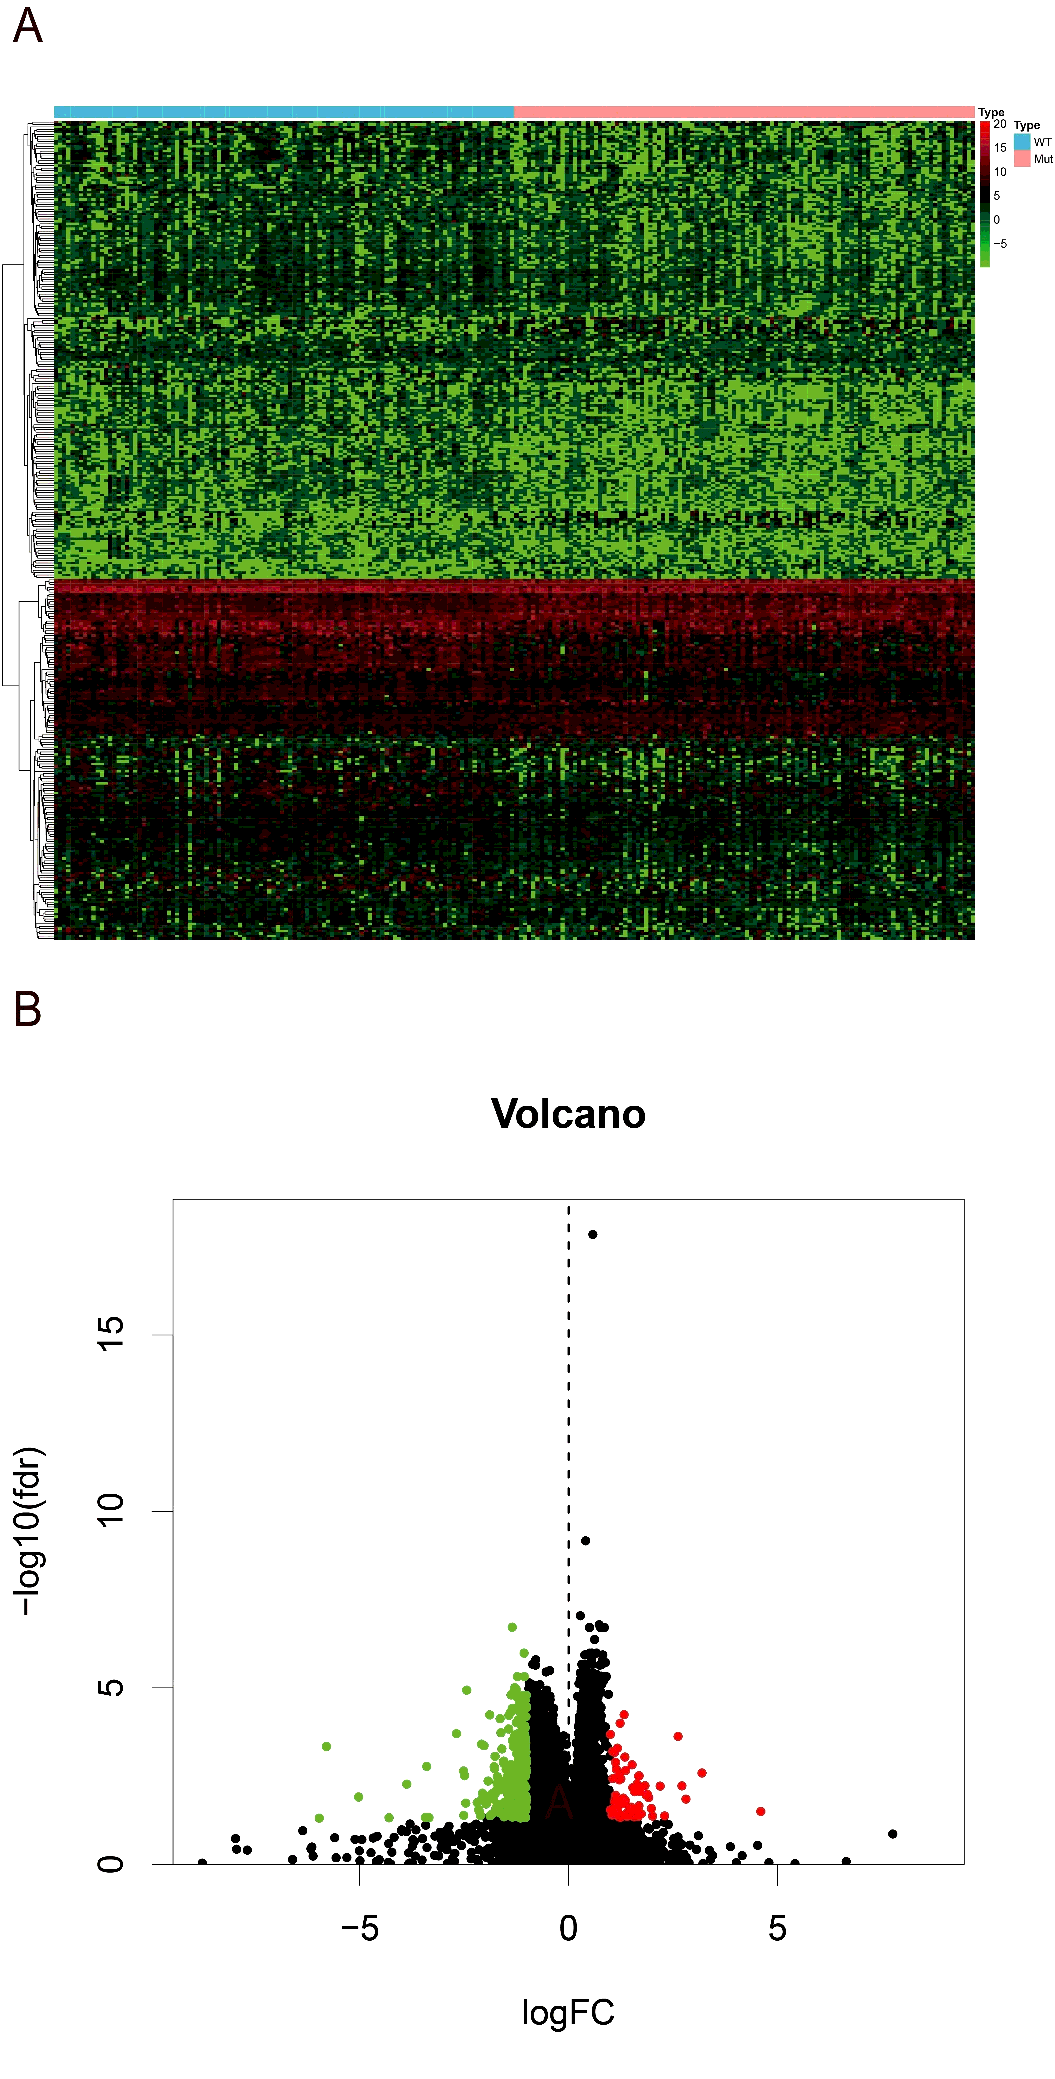