Animals
Male C57BL/6 mice (10–12 weeks old) were used in this study (Orient, Seongnam, South Korea). Mice were housed in a specific pathogen-free barrier facility at Inha University. All animal experiments were approved by our Institutional Animal Care and Use Committee (INHA 170908-513-1).
Transient MCAO (tMCAO) stroke model
The tMCAO stroke model was induced via MCAO using a 6-0 nylon monofilament suture (Doccol Corporation, Sharon, MA, USA). The mice were anesthetized with 2% isoflurane (Kyongbo Pharmaceutical Co. Ltd, Asan, South Korea) in 30% oxygen and 70% nitrous oxide using a face mask. The mice were placed on a heat pad throughout the procedure. After anesthetization, a midline neck incision was made. The left common carotid artery (CCA), internal carotid artery (ICA), and external carotid artery (ECA) were exposed. One knot was made in the CCA, and two were made in the ECA. After cutting between the two knots in the ECA, the suture with a round, coated tip (filament size 6-0, diameter 0.09-0.11 mm, length 20 mm; diameter of coated tip 0.25+/- 0.02 mm, length 5-6 mm, Cat# 602556PK10Re; Doccol Corporation, Sharon, MA, USA) was inserted into the ECA lumen and then gently advanced into the ICA lumen to block MCA blood flow and left there for 45 min until reperfusion. In sham-operated mice, after incision of the skin and the exposure of blood vessels (as in tMCAO), a knot was made in the CCA. After 10 min, this knot was removed and the skin was sealed. Mice were euthanized at various time points.
Neurological severity score (NSS)
The NSS was determined and recorded using the following four parameters:
Zea-longa: 5 score
The Zea-longa score was determined by observing the movement of mice in and out of the cage. Score 0: mice had no neurological deficit. Score 1: mice could not fully extend the left forepaw. Score 2: mice circled to the left while walking. Score 3: Mice fell to the left or limped. Score 4: mice were unable to walk spontaneously. Score 5: death [15].
Prehensile traction: 4 score
The ability of the mice to grab and hold on to a 0.5 cm-diameter wire elevated at a height of 70 cm from a surface was tested. Performance was evaluated on a four-grade score. Score 0: mice could hang on the wire for over 5 s with the hind legs placed on the wire. Score 1: mice could hang on the wire for 5 s. Score 2: mice could hang on the wire for 3–4 s. Score 3: mice could hang on the wire for 0–2 s. In scores 1–3, the mice were unable to place their hind legs on the wire [16].
Circling: 5 score
Circling behavior was determined by observing and scoring the ability of the mice to remain in contact with the floor with their forelegs. Score 0: mice had no observable deficit. Score 1: mice exhibited flexion of the contralateral torso. Score 2: mice circled clockwise. Score 3: mice continuously spun clockwise. Score 4: there were no movements or reactions [17].
Forelimb: 5 score
The mice were held by their tail, and the bending of the torso or forelimbs in the air was observed and scored. Score 0: normal reaction. Score 1: mice occasionally exhibited flexion of the asymmetric forelimb. Score 2: asymmetric forelimb flexion. Score 3: mice exhibited flexion of the asymmetric forelimb and torso. Score 4: there was no motor activity or reaction [17].
Cresyl violet staining
Brains were fixed in 4% paraformaldehyde (PFA; Biosesang, Seongnam, South Korea) and the vibratome sections were stained with 0.1% cresyl violet (Sigma-Aldrich, St. Louis, MO, USA) in distilled water. The infarct areas were measured using ImageJ software (NIH, Bethesda, MD, USA).
Flow cytometric analysis of cell populations in the blood, spleen, and thymus
After anesthesia, blood was collected VIA retro-orbital bleeding using sterile capillary tubes (Paul Marienfeld GmbH & Co. KG. Lauda-Königshofen, Germany). The blood samples (50 μL) were stained using different antibodies at 4°C for 20 min and then the red blood cells (RBCs) were removed with RBC lysis buffer (Sigma-Aldrich). The samples were washed once with fluorescence-activated cell sorting (FACS) buffer [phosphate-buffered saline (PBS) with 1% bovine serum albumin (BSA) and 20 mM ethylenediaminetetraacetic acid] and fixed with 4% PFA. Lymphocytes (1 × 10⁶) from the spleen and thymus were incubated with FACS antibodies at 4°C for 20 min. The cells were rinsed once with FACS buffer and fixed with 4% PFA. Cells were then analyzed via flow cytometry (BD FACS Verse™; BD Biosciences, San Jose, CA, USA), and FlowJo software (BD Biosciences, San Jose, CA, USA) was used for data analysis. FACS antibodies anti-CD3 (145-2C11), CD4 (RM4-5, GK1.5), CD8 (53-6.7), CD44 (IM7), CD25 (3C7), CD45R/B220 (RA3-6B2), and T-cell receptor (TCR)-β (H57-597) were purchased from BD Biosciences. Anti-CD3 (17A2), was purchased from BioLegend (San Diego, CA, USA). Anti-CD8 (5H10) and CD62L (MEL-14) were purchased from Invitrogen (Carlsbad, CA, USA).
Thymocyte proliferation assay in vivo using BrdU
One day after tMCAO, 150 µl of BrdU (10 mg/mL) was injected intraperitoneally into the tMCAO and sham mice. The thymus was removed 2 h later and BrdU-positive cells were analyzed using a BrdU assay kit, according to the manufacturer’s protocol (BD Biosciences).
Cell culture and cytokine analysis using enzyme-linked immunosorbent assay (ELISA)
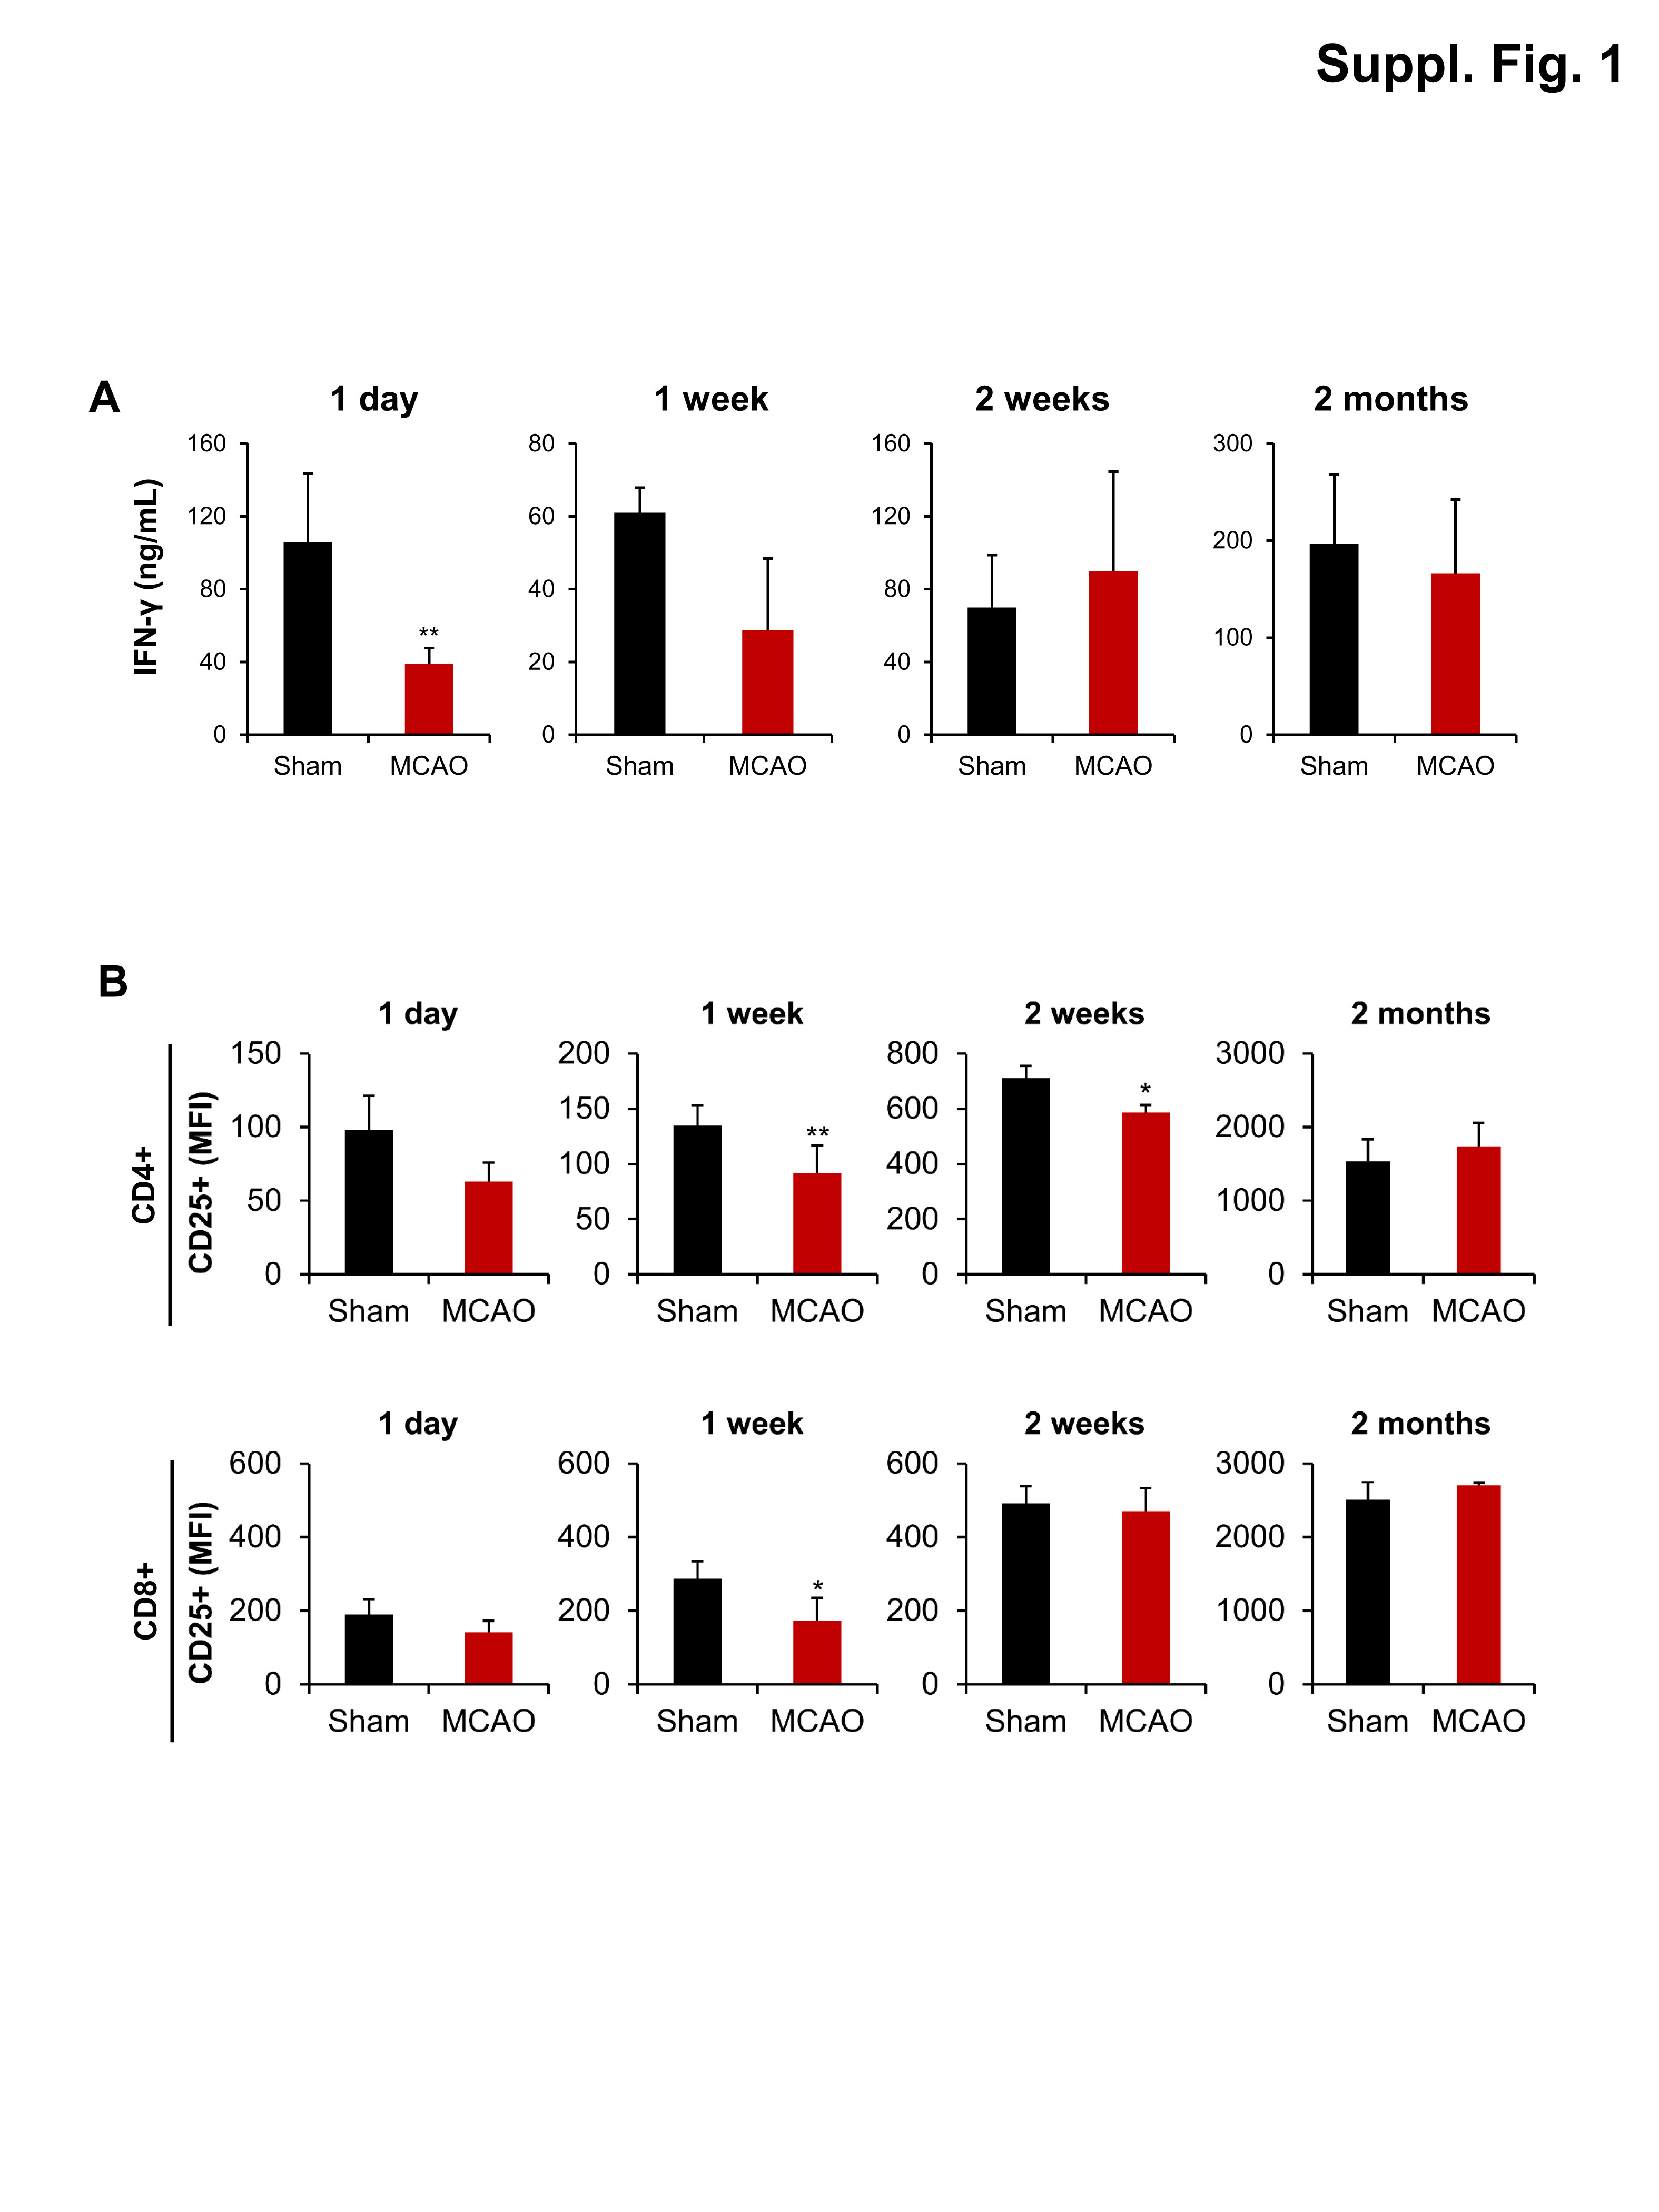
First, 1 x 10⁶ lymphocytes from the spleen were stimulated with 0.1 μg/mL of anti-CD3 (145-2C11) and anti-CD28 (37.51) antibodies (BioGems, Westlake Village, CA, USA) in Roswell Park Memorial Institute (RPMI) 1640 (HyClone, GE Healthcare Life Science, PA, USA) culture medium containing 0.1% 2-mercaptoethanol (Thermo Fisher Scientific, MA, USA), 10% heat-inactivated fetal bovine serum (FBS; Gibco®, Australia origin, Thermo Fisher Scientific), and 1% antibiotic-antimycotic (Thermo Fisher Scientific) in a 24-well plate and incubated at 37°C in a 5% CO2 incubator. After 24 and 48 h of stimulation, interleukin (IL)-2, IL-4, IL-13, and interferon (IFN)-γ levels in the culture medium were quantified using ELISA kits according to the manufacturer’s protocol (BD Biosciences).
Isolation of T lymphocytes from the brain
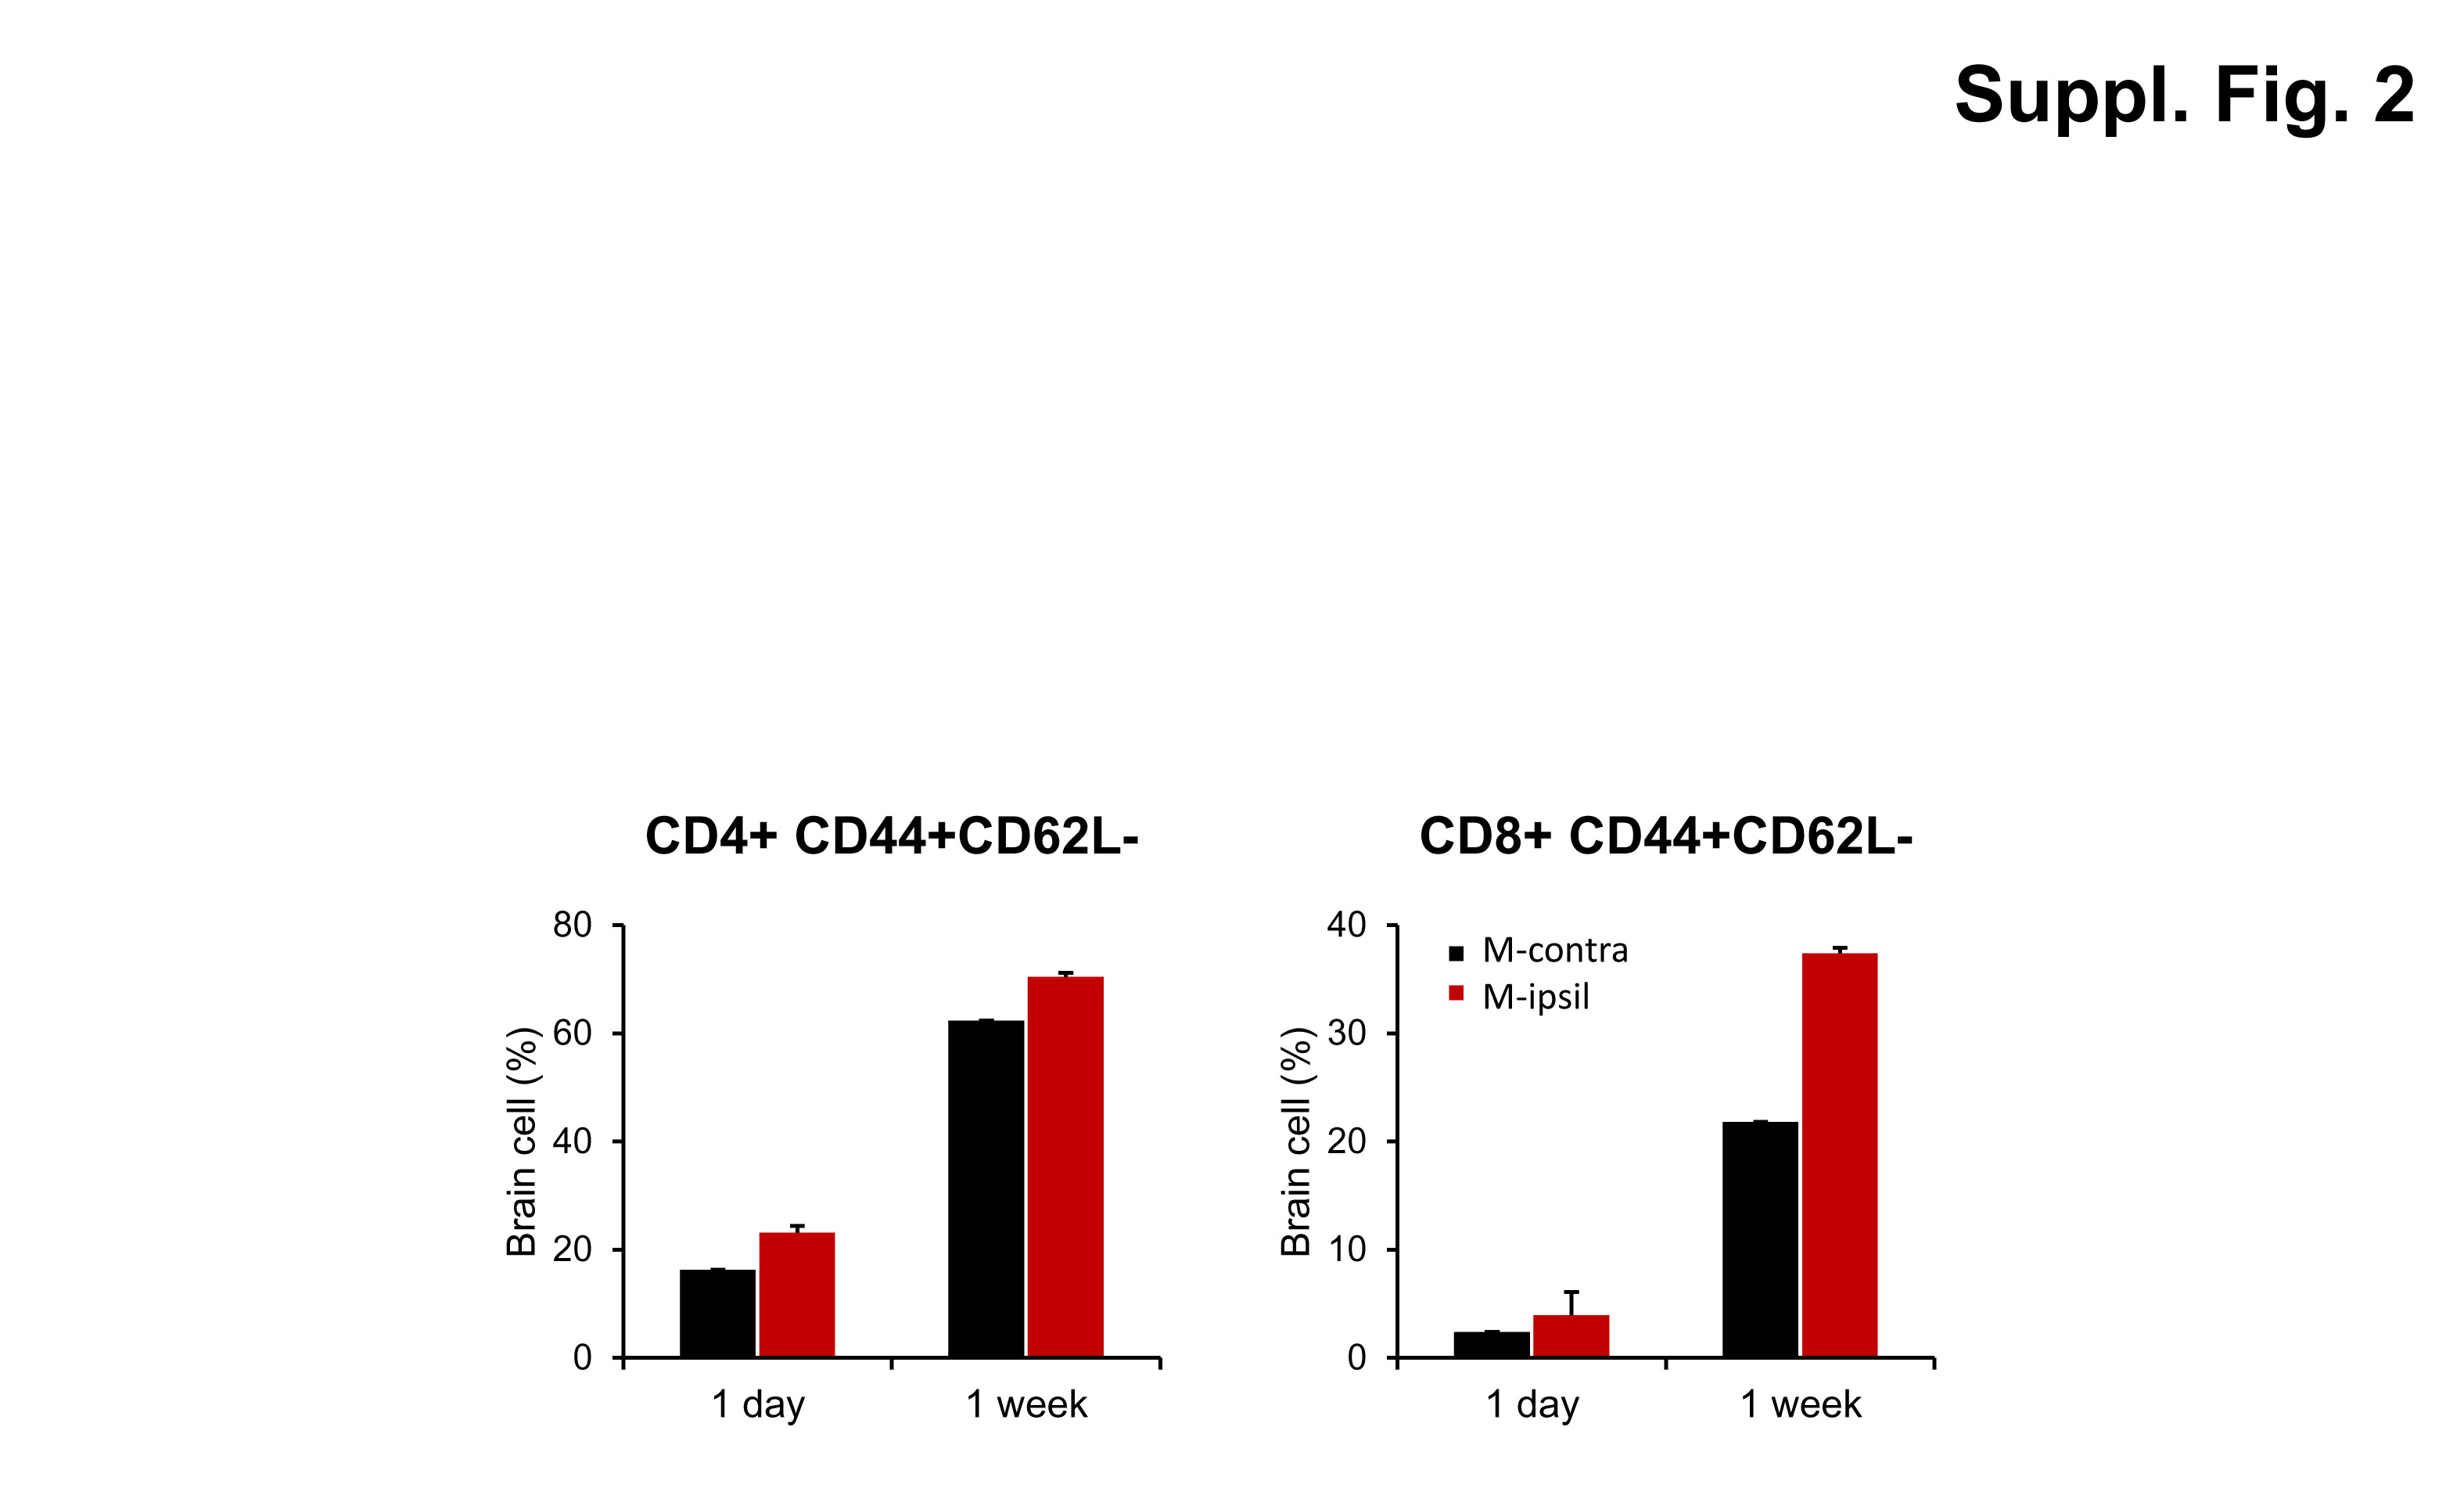
T lymphocytes from the brain were isolated as described previously, with some modifications [18]. A Percoll gradient protocol was used. The stock isotonic Percoll (SIP) was prepared by mixing nine parts of Percoll (Sigma-Aldrich) with one part of 10× PBS without calcium chloride or magnesium sulfate. Each hemisphere of the brain was minced using a homogenizer in a 1.5 mL tube with RPMI 1640 containing 0.1% 2-mercaptoethanol, 10% FBS, and 1% antibiotic-antimycotic. Digestive enzymes, including collagenase Type I (2 mg/mL, Sigma-Aldrich) and DNase Type II (40 μg/mL, Sigma-Aldrich) in 1× DPBS without calcium chloride or magnesium sulfate (GenDEPOT, Texas, USA) were added after homogenization and incubated at 37°C for 45 min. The cell suspension was then passed through a 70 μm cell strainer and rinsed with 1× DPBS, and the volume was made up to 7 mL. Next, 3 mL of SIP was added to the cell suspension to obtain a final concentration of 30% SIP. The cell suspension (10 mL in 30% SIP) was layered on top of 2 mL of 70% SIP in a 15 mL conical tube to make a total volume of 12 mL. After centrifugation at 2000 rpm for 20 min continuously at room temperature (RT), 3–4 mL of the white layer at the 70–30% interface was collected into a new tube. After further centrifugation at 1500 rpm for 3 min, the cells were rinsed once with FACS buffer or 1× PBS.
Immunohistochemistry
Mice were transcardially perfused with saline solution containing 0.5% sodium nitrate and heparin (10 U/mL), and then fixed with 4% PFA dissolved in 0.1 M phosphate buffer. Brain tissues were dissected from the skull, post-fixed overnight in buffered 4% PFA at 4°C, and stored in a 30% sucrose solution for 24–48 h at 4°C until they were settled, frozen, and sectioned on a cryostat in 30 μm-thick coronal sections. Tissue sections were washed in cold PBS three times for 10 min and blocked with universal blocking solution (0.3% Triton™ X-100, 1% BSA, 0.05% Tween 20, and 0.05% sodium azide in PBS) for 1 h at RT. Sections were then incubated with the following primary antibodies: rat anti-Foxp3 (1:100, Invitrogen) and anti-IL-10 (1:90, R&D system) for 2 h at RT. Thereafter, the tissues were rinsed and incubated with Alexa Fluor 488 donkey anti-rabbit IgG (1:400, Invitrogen) and Alexa Fluor 594 goat anti-mouse IgG (1:400, Invitrogen) for 1 h. After washing with PBS, coverslips were mounted on glass slides using mounting media with DAPI (Vector Laboratories), and were analyzed using a confocal microscope (LSM 800, Carl Zeiss). For CD4 staining, tissues were stained with rabbit anti-CD4 (1:400, Santa Cruz) at 4°C overnight. The following day, tissues were rinsed and incubated with Cy3-conjugated-anti-rabbit IgG (1:800, Millipore) for 1 h. Labeled tissue sections were mounted on gelatin-coated slides and analyzed under a confocal microscope (LSM 700, Carl Zeiss).
Statistical analysis
Student’s t-test was used to compare two independent groups of data that were properly distributed. Values of *p ≤ 0.05, ** p ≤ 0.01, and ***p ≤ 0.001 were considered significant.