Single-cell analysis of the eutopic endometrium and ectopic lesions of AM.
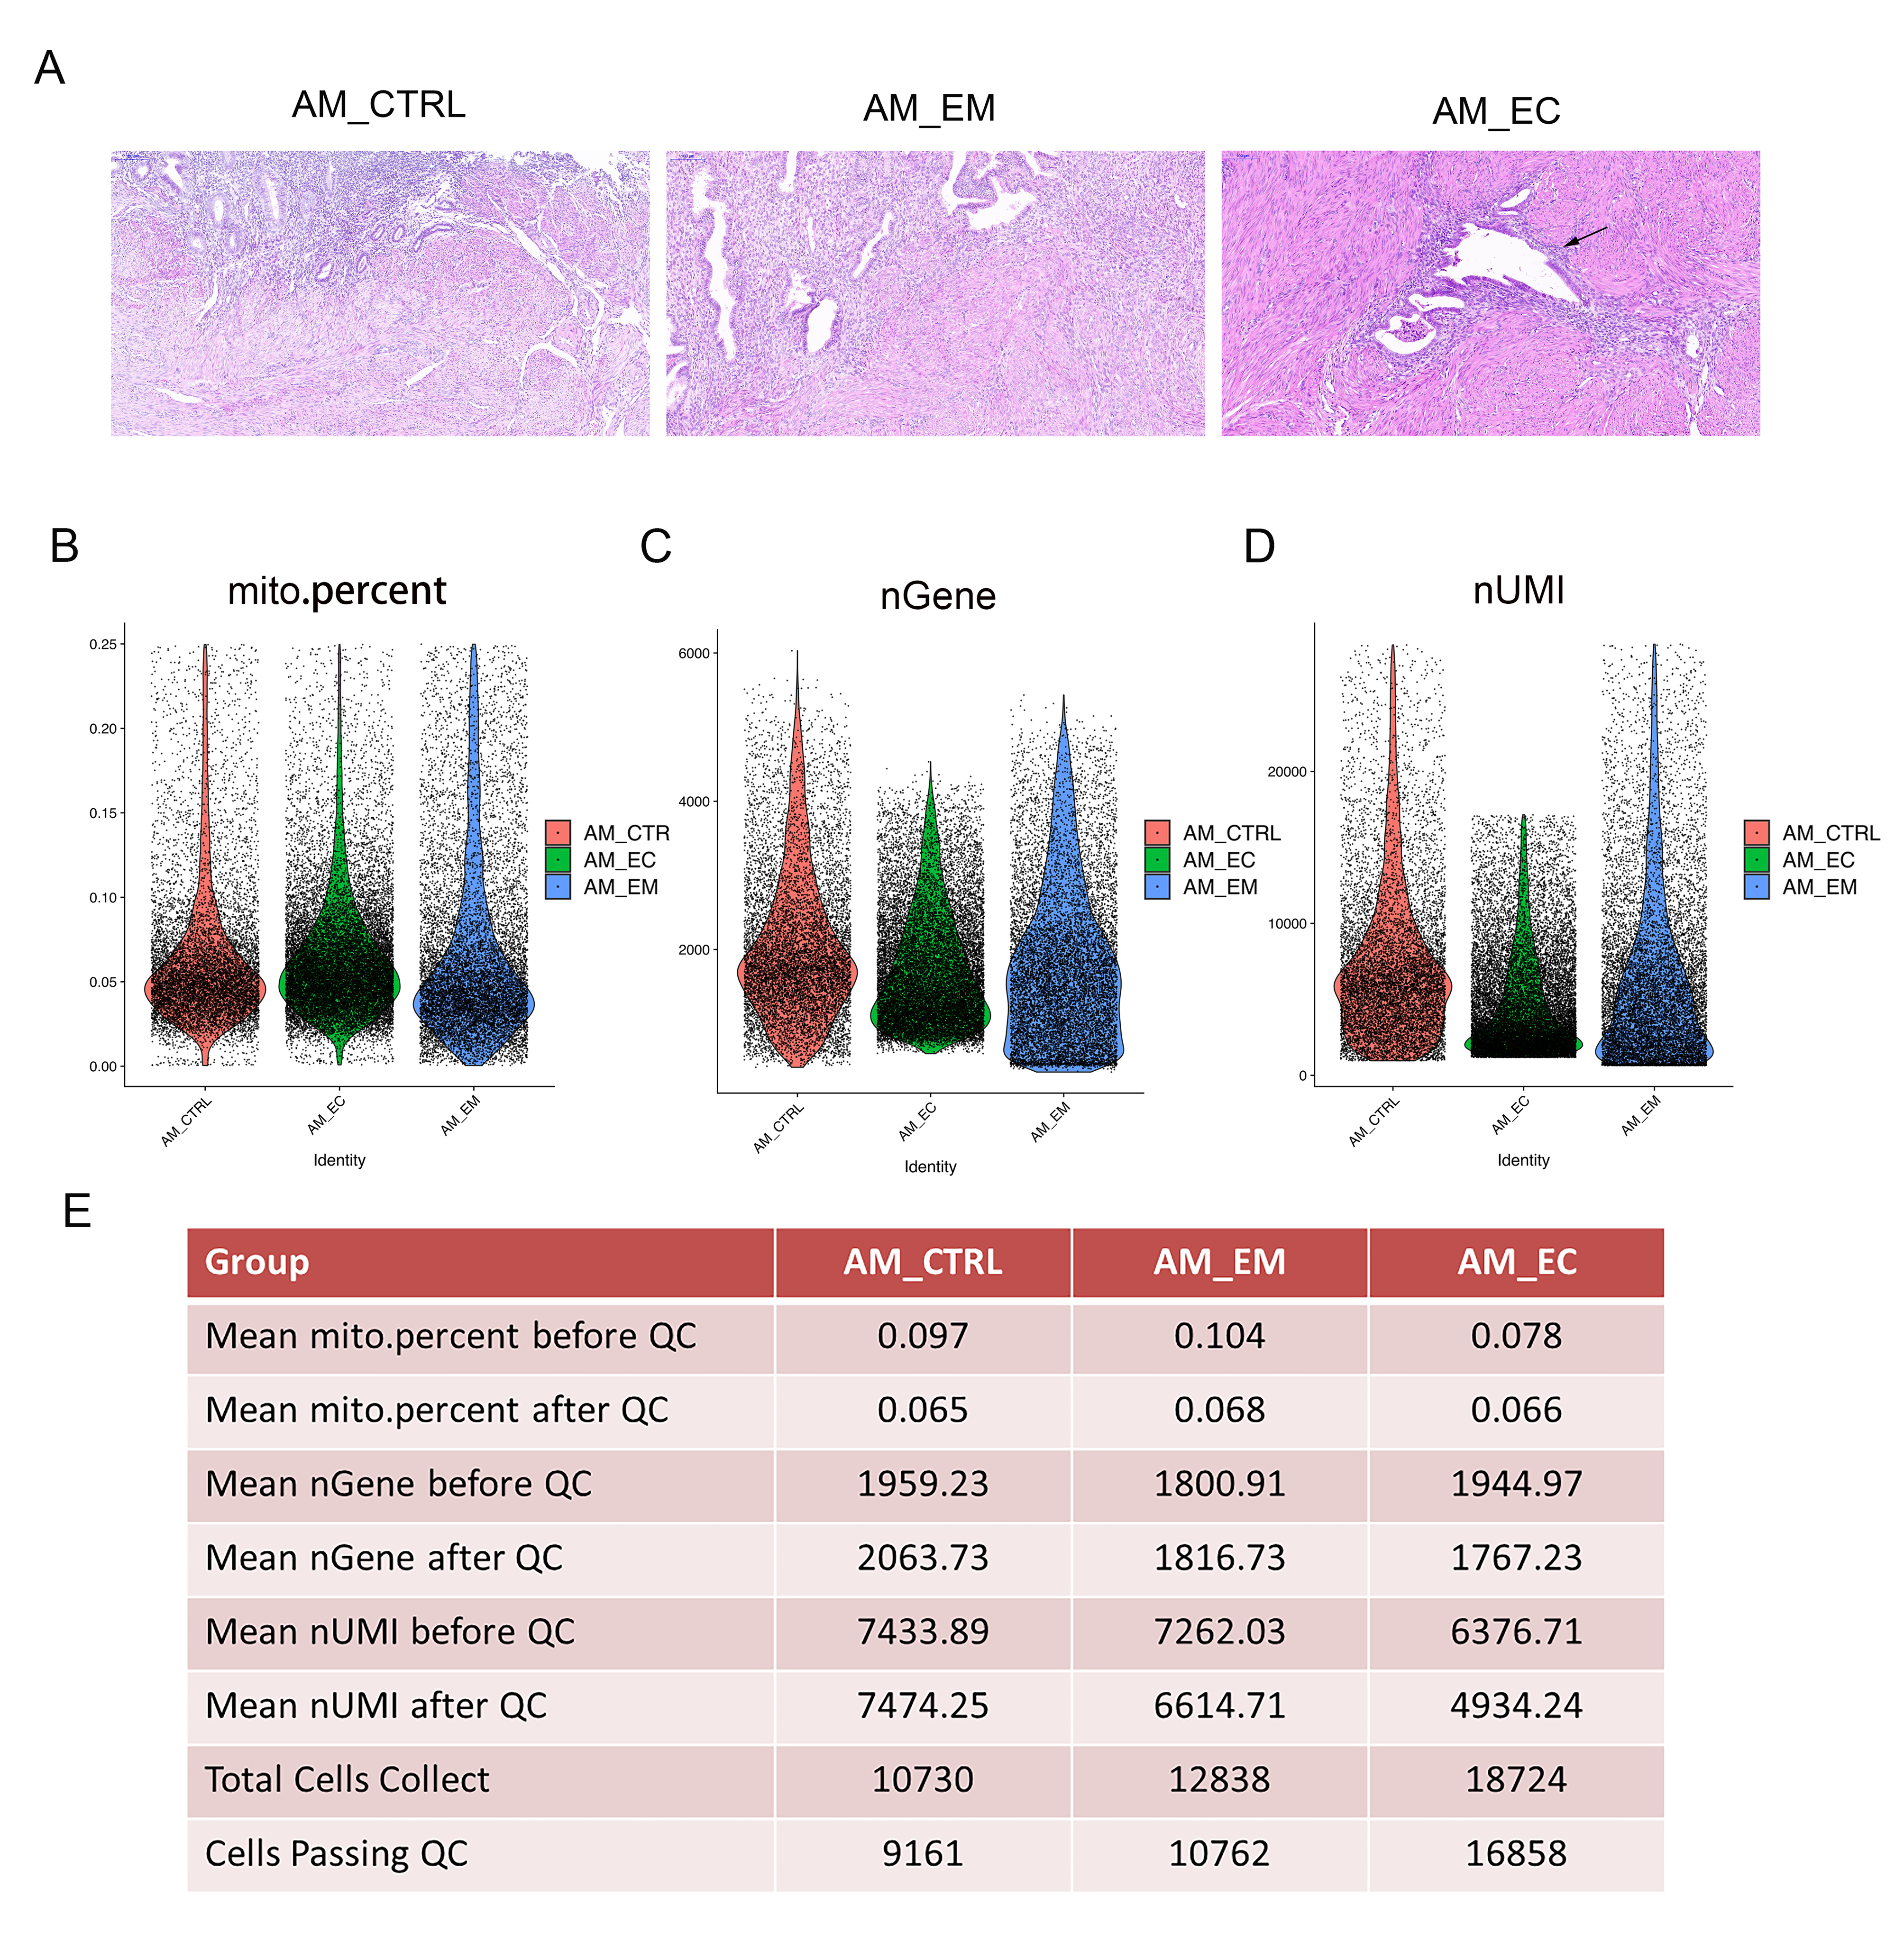
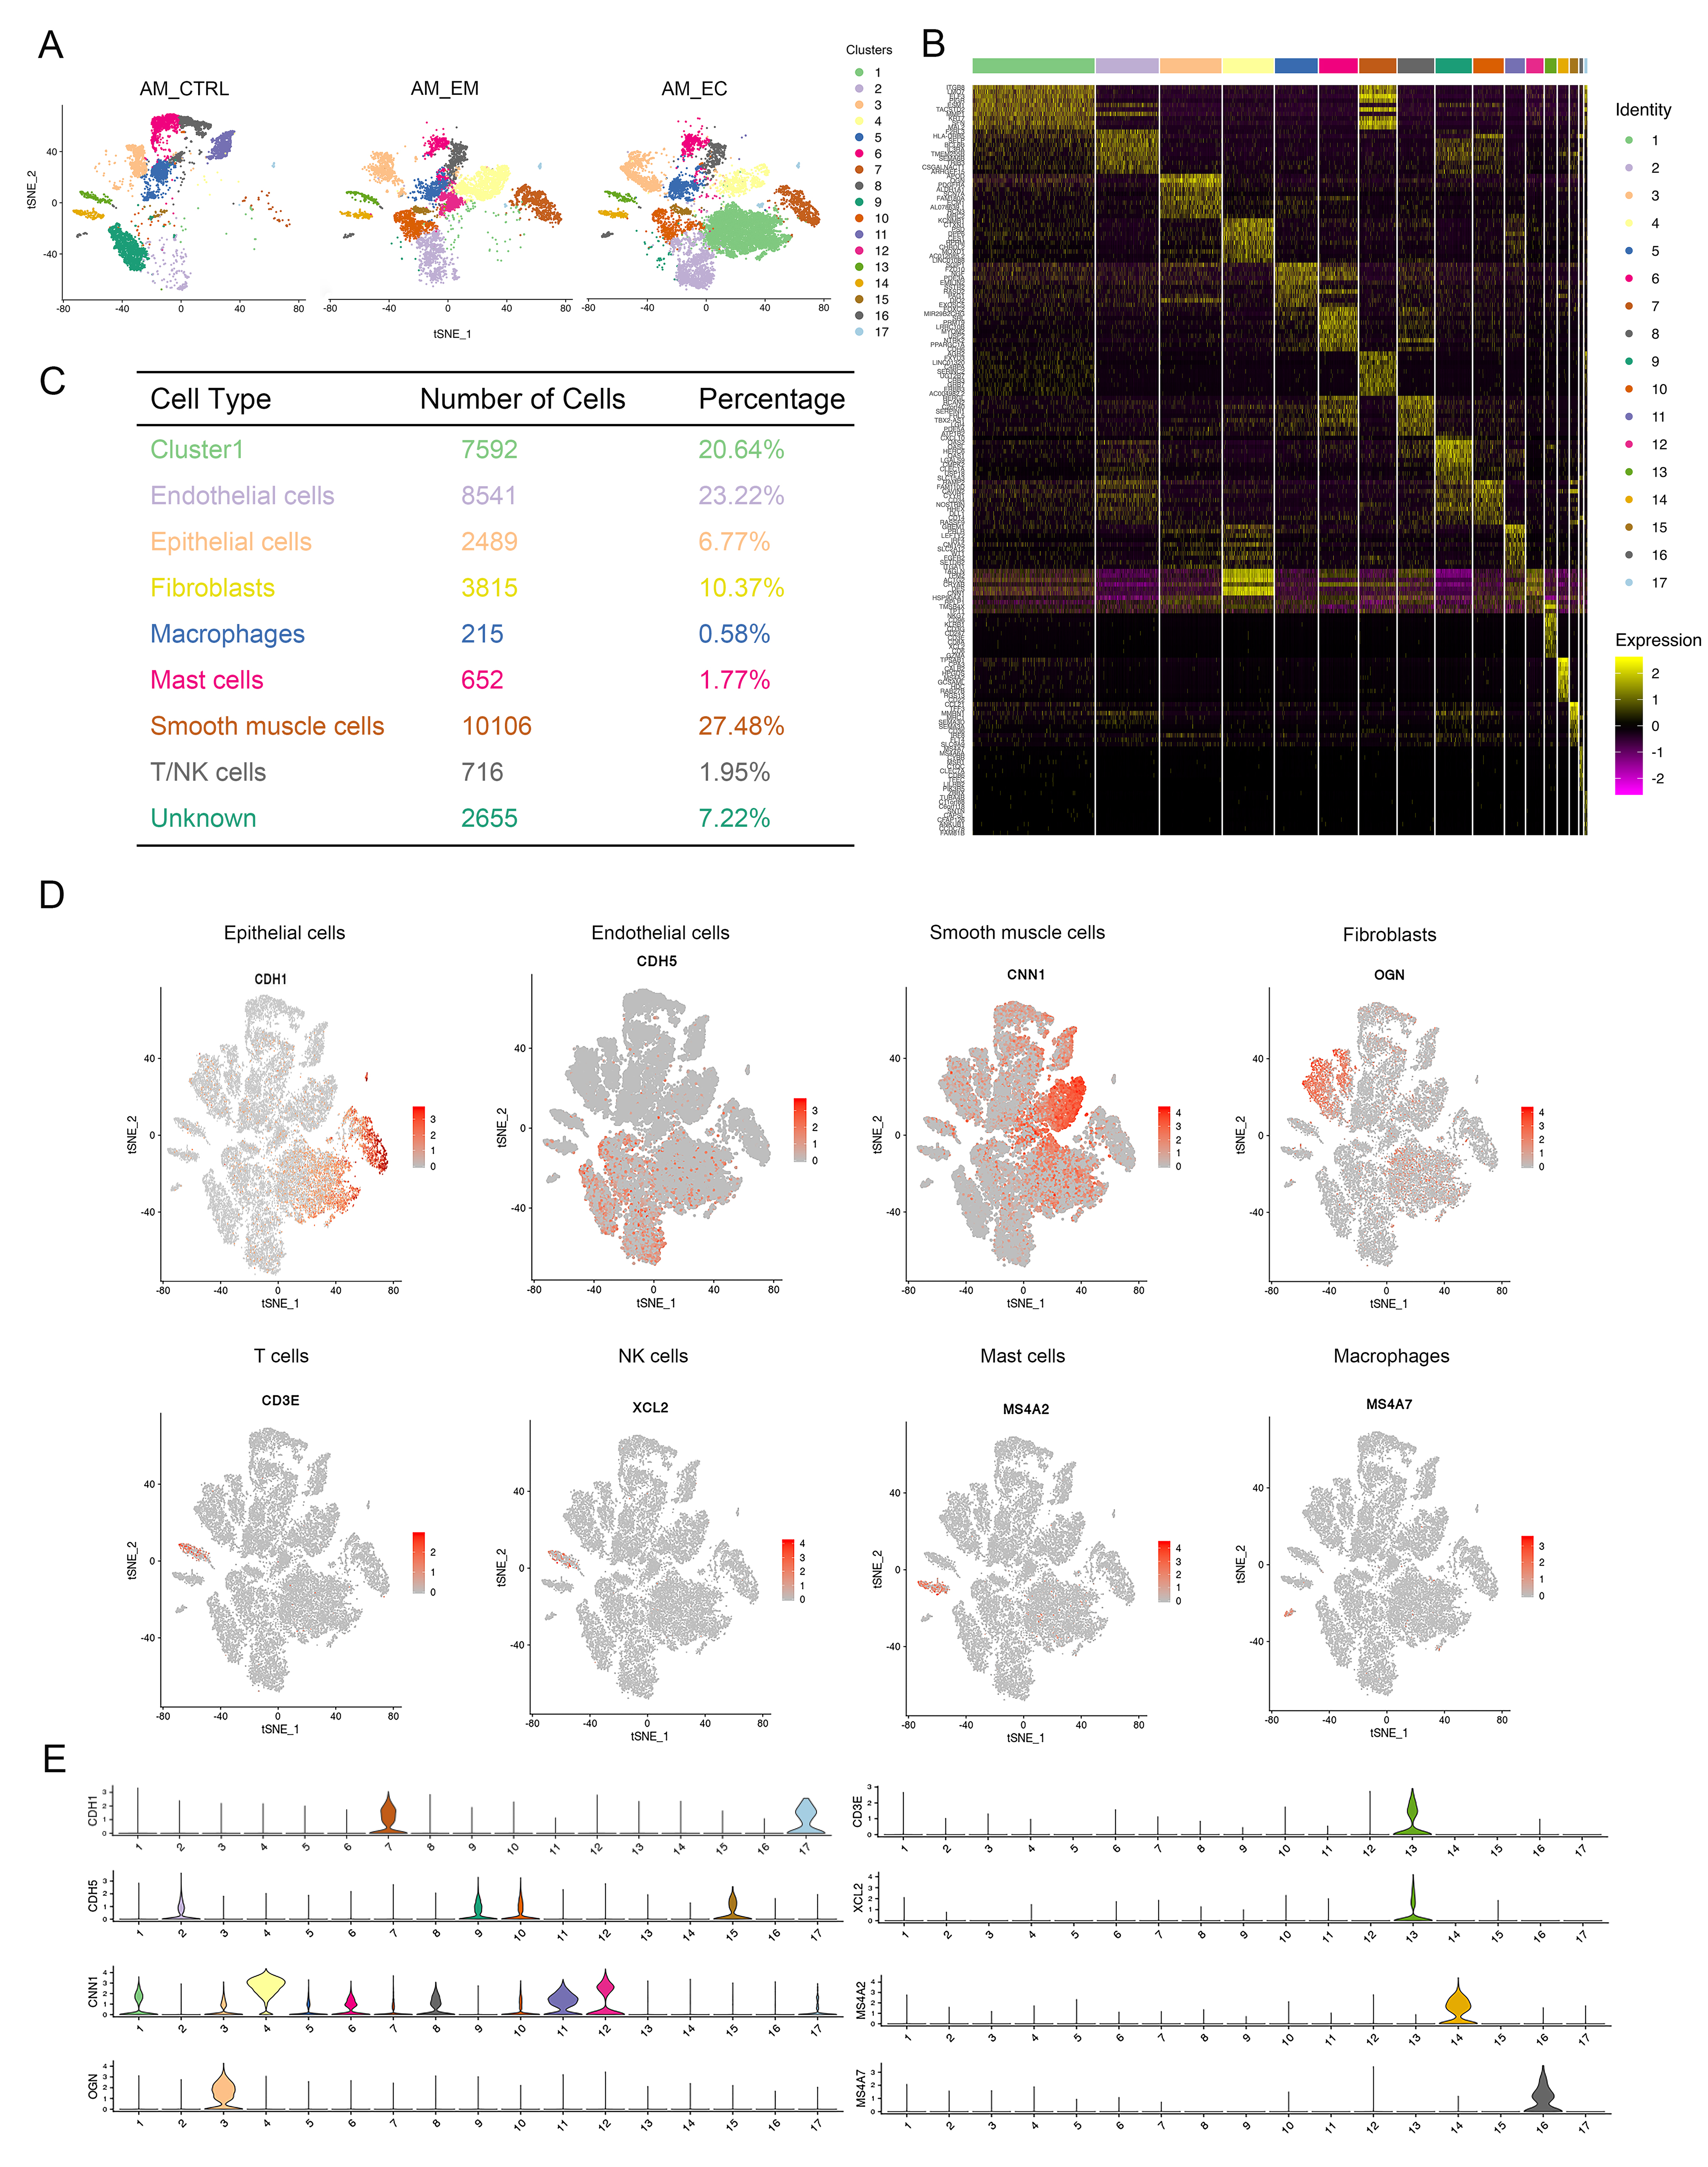
To understand the potential molecular basis of the development of AM, samples were obtained from patients and analysed by scRNA-sEq. To this end, eutopic endometrium (AM_EM group) and ectopic endometrium (AM_EC group) samples were obtained from total hysterectomies of patients with AM, and endometrial tissue from patients with hysteromyoma served as the control (AM_CTRL group). Hematoxylin-eosin (HE) staining was used to detect the histological characteristics, and we found that the gland invaded the muscle layer of the AM_EC group (Additional file 1: Figure S1A), which was consistent with the characteristics of AM. To explore cell diversity, we generated scRNA-seq profiles from the 3 groups mentioned above (Fig. 1A). Our scRNA-seq data were analysed with strict quality control (QC) criteria according to the method (Additional file 1: Figure S1B-E). A total of 42,292 cells, including cells from the AM_CTRL, AM_EM and AM_EC groups, was sequenced, of which 36,781 cells were used for a following analysis after QC (Additional file 1: Figure S1E). The proportion of mitochondrial genes, the number of genes expressed, and the number of unique molecular identifiers (UMIs) in each cell are shown in the violin plots (Additional file 1: Figure S1B-D). After the completion of QC, t-distributed stochastic neighbour embedding (t-SNE) analysis was conducted, and 17 cell clusters were obtained (Fig. 1B, C and Additional file 1: Figure S2A). The top ten genes expressed in each cluster are shown in the heatmap (Additional file 1: Figure S2B). The 17 clusters were divided into 7 different cell types according to cell type-specific gene expression. In addition, there was also an unidentified cluster (named unknown) and an unnamed cluster (cluster 1) (Fig. 1D and Additional file 1: Figure S2C). In the process of cell type identification, widely recognized cell markers were used, such as EPCAM for epithelial cells, PECAM1 for endothelial cells, and APOD for fibroblasts (Fig. 1E, F). Various additional cell markers were also used to identify cell types, such as CNN1 for smooth muscle cells, MS4A7 for macrophages, and CD3E for T cells (Additional file 1: Figure S2D,E) (representative marker reference from: http://biocc.hrbmu.edu.cn/CellMarker/ and https://panglaodb.se/search.html). Cluster 1 was a special cell group, and the results of cell type identification showed that it expressed markers in different cells, including epithelial cells and endothelial cells (Fig. 1E, F). Its characteristics will be deeply studied.
Cluster 1 possessed colocalization of epithelial and endothelial markers and high copy number variation (CNV) levels.
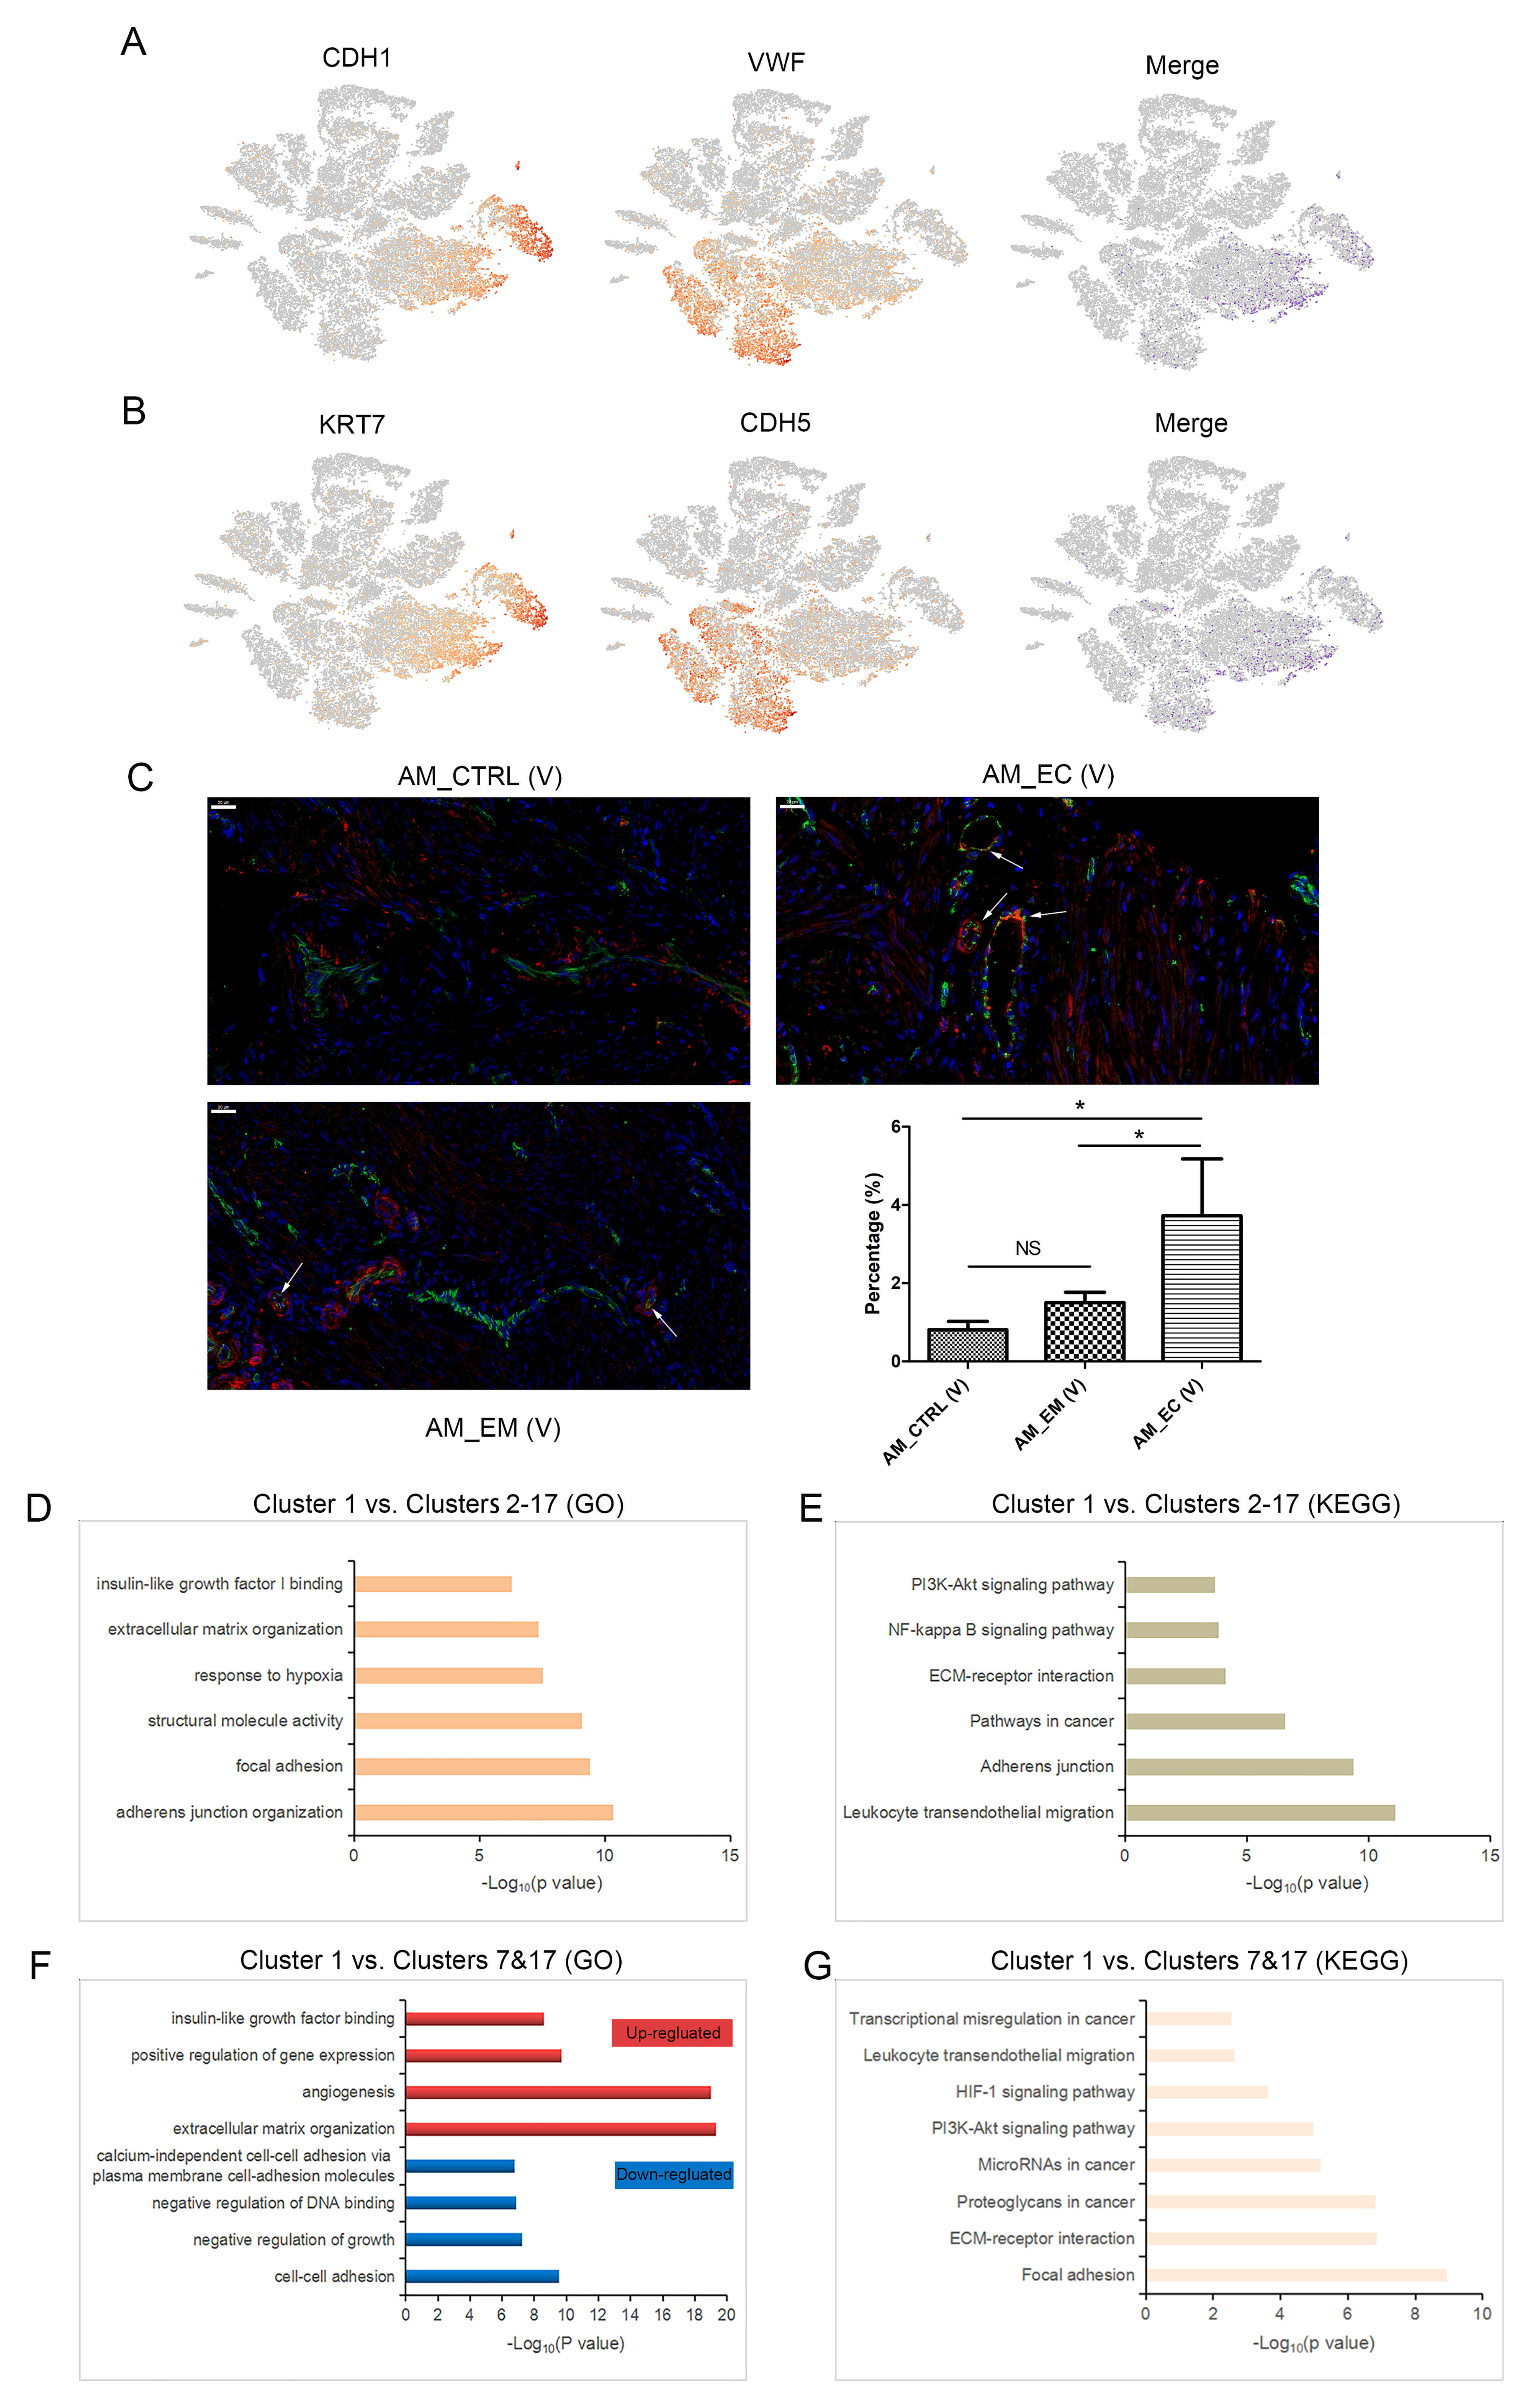
By comparing the distribution of cluster 1 in the three groups of samples, it was found that the proportion of cluster 1 in the AM_CTRL, AM_EM and AM_EC groups had an increasing trend (Fig. 2A, B), especially in the AM_EC sample. Moreover, the tissues of the AM_EC samples were taken from ectopic lesions of AM, indicating that cluster 1 may be closely related to AM. Markers of different cell types were expressed in cluster 1, particularly according to the distribution of EPCAM and endothelial cell marker (PECAM1) in the t-SNE map, suggesting that there was colocalization of the two markers in some of the cells belonging to cluster 1. Moreover, the number of colocalized cells in the AM_EC group was greater than those in the AM_CTRL and AM_EM groups (Fig. 2C, D). In addition, the colocalization of CDH1 and VWF, KRT7 and CDH5 also indicated the coexpression of epithelial and endothelial markers in cluster 1 (Additional file 1: Figure S3A, B). The immunofluorescence results also revealed the colocalization of EPCAM and PECAM1 in the corresponding tissues of the AM_EM and AM_EC samples (Fig. 2E). In addition, the proportion of cells that colocalized with the two markers of the verifiable AM_EC (V) group was significantly higher than that of the AM_EM (V) group and AM_CTRL (V) group (Additional file 1: Figure S3C, P < 0.05), which was consistent with the trend of colocalization in the t-SNE map (Fig. 2A, B). These results indicated that cluster 1 was a unique cluster, which was worth studying to determine its genetic background.
The t-SNE map classified cells based on the similarity of gene transcription, and there was colocalization of the epithelial and endothelial markers, which indicated that the cell cluster might possess malignant characteristics. For the top 500 genes expressed in cluster 1, Gene Ontology (GO) and Kyoto Encyclopedia of Genes and Genomes (KEGG) pathway analyses revealed that cancer-, cell motility- and inflammation-associated terms (CMI terms) were enriched in cluster 1 (Fig. 2F, G). Moreover, compared with other clusters (clusters 2–17), cluster 1 was enriched for CMI- and cell growth-associated terms (Additional file 1: Figure S3D, E). Compared with epithelial cell populations (clusters 7 and 17), cluster 1 showed the accumulation of angiogenesis-, cell growth-, cancer- and motility-related terms (Additional file 1: Figure S3F, G). Hence, chromosomal CNV analysis was carried out according to the average expression patterns across intervals of the genome. The results show that cluster 1 had a high level of CNV (Fig. 2H).
Taken together, our results show that there were colocalization markers of epithelial cells and endothelial cells in cluster 1, and it possessed a high CNV level. Furthermore, the terms of CMI, angiogenesis and cell growth, which contribute to tumour progression, were enriched in cluster 1. The above results indicate that malignant cell populations were present in the ectopic endometrium, which was consistent with AM possessing tumour-like characteristics [21].
Gene expression pattern analyses in AM_CTRL, AM_EM and AM_EC samples.
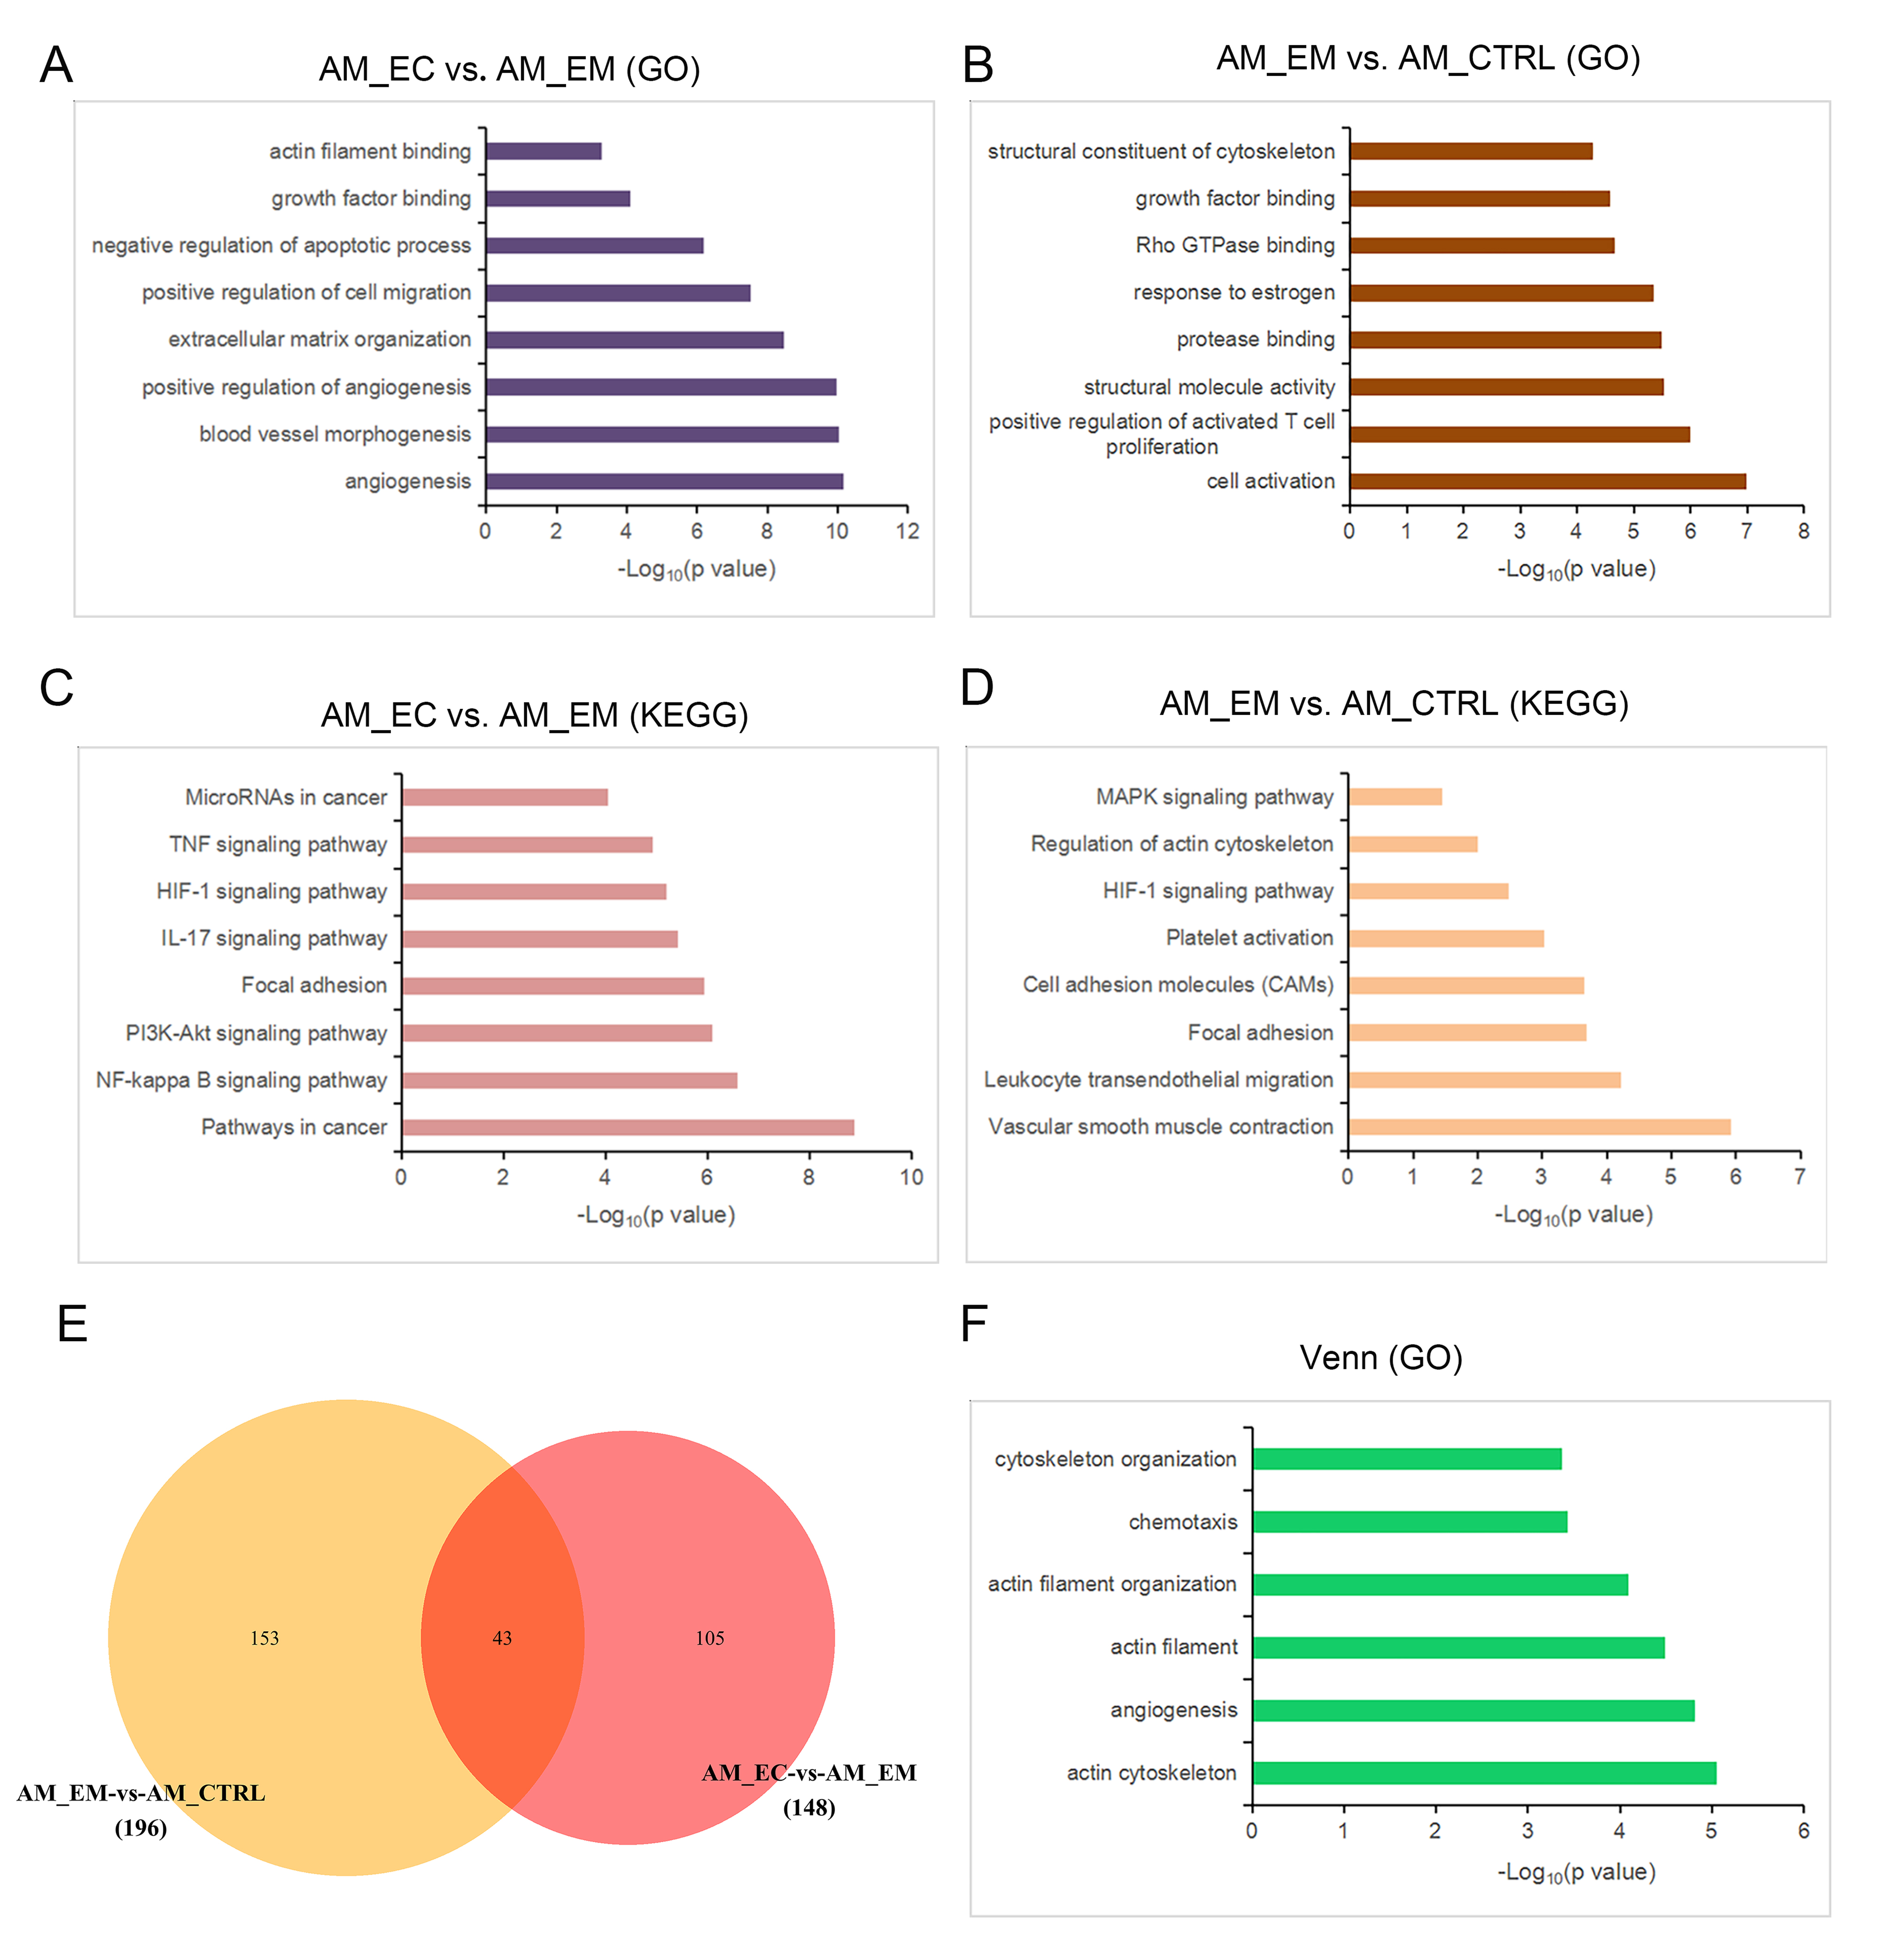
The tissues were derived from eutopic endometrium and ectopic lesions, which prompted us to analyse the gene expression patterns of the AM_EC and AM_EM groups. Compared with the AM_EM group, 535 genes were differentially expressed in the AM_EC group, among which 383 genes were upregulated and 152 genes were downregulated (Additional file 2: Table S1). GO analysis was performed on the upregulated genes, and the gene functions were mainly enriched for terms involved in angiogenesis, cell motility, and cell growth and survival, including positive regulation of angiogenesis, positive regulation of cell migration, growth factor binding and negative regulation of apoptotic process (Additional file 1: Figure S4A). The AM_EM group was compared with the AM_CTRL group, and GO analysis showed that the functions of upregulated genes were also enriched in cell motility- and cell growth-associated terms, such as structural constituent of cytoskeleton, Rho GTPase-binding and growth factor-binding (Additional file 1: Figure S4B). KEGG analysis showed that compared with those of the AM_EM group, the enrichment items of the AM_EC group were mainly concentrated in CMI- and cell proliferation-related terms, such as pathways in cancer, focal adhesion, the NF-κB signalling pathway and the PI3K-Akt signalling pathway (Additional file 1: Figure S4C). Furthermore, cell motility-, inflammation-, and cell proliferation-related terms, such as focal adhesion, leukocyte transendothelial migration and the MAPK signalling pathway, were also enriched in the AM_EM group compared with the AM_CTRL group (Additional file 1: Figure S4D). There were 43 differentially expressed genes (DEGs) coexisting in AM_EM versus AM_CTRL (196 DEGs) and AM_EC versus AM_EM (148 DEGs) (Additional file 1: Figure S4E and Additional file 3: Table S2). The functions of coexisting DEGs were mainly focused on angiogenesis, cell mobility-related cytoskeleton regulation and chemotaxis (Additional file 1: Figure S4F). Taken together, the results reveal that the disease progression of AM was closely related to CMI terms. Furthermore, a series of GO and KEGG terms enriched in ectopic lesions partially appeared in the eutopic endometrium of AM patients.
A heatmap showed that genes related to angiogenesis in the AM_EC group were upregulated compared with those in the AM_EM group, including MMP1 [22], ESM1 [23], ANGPT2 [24] and CYP1B1 [25] (Fig. 3A). GO and KEGG analyses in endothelial cells indicated that multiple angiogenesis-associated terms were accumulated in the AM_EC group versus the AM_EM group, in addition, CMI- and proliferation-related terms, such as pathways in cancer, positive regulation of cell migration, NF-κB signalling pathway and PI3K-Akt signalling pathway, were also enriched in the comparison (Fig. 3B, C). These results suggest that endothelial cells in the AM_EC group possessed some malignant characteristics and that the angiogenic ability was enhanced.
The DEGs (p value < 0.05, fold change > 1.5) in AM_EC versus AM_EM are presented as volcano maps, and analysis of the upregulated genes with log2 fold change > 1 showed that the functions of a series of genes were related to angiogenesis (such as MMP1 and ESM1), inflammation (such as CXCL8 [26]) and cell motility (such as ITGA2 [27] and ITGB8 [28]) (Fig. 3D). It has been reported that the pathogenesis of AM is closely related to the enhancement of invasion and migration of endometrial cells and epithelial-mesenchymal transition (EMT) [29, 30]; therefore, the cell motility of epithelial cell clusters became our focus. The DEGs of epithelial cells in the AM_EC versus AM_EM groups were analysed, and ITGA2, ITGB8 and CXCL8 were also identified in the upregulated genes with a log2 fold change > 1 (Fig. 3E). These results suggest that the enhancement of cell motility and migration in the AM_EC group compared with those in the AM_EM group may be related to the epithelial cell group, which is worthy of further study.
Distinct subclusters in the epithelial cell group.
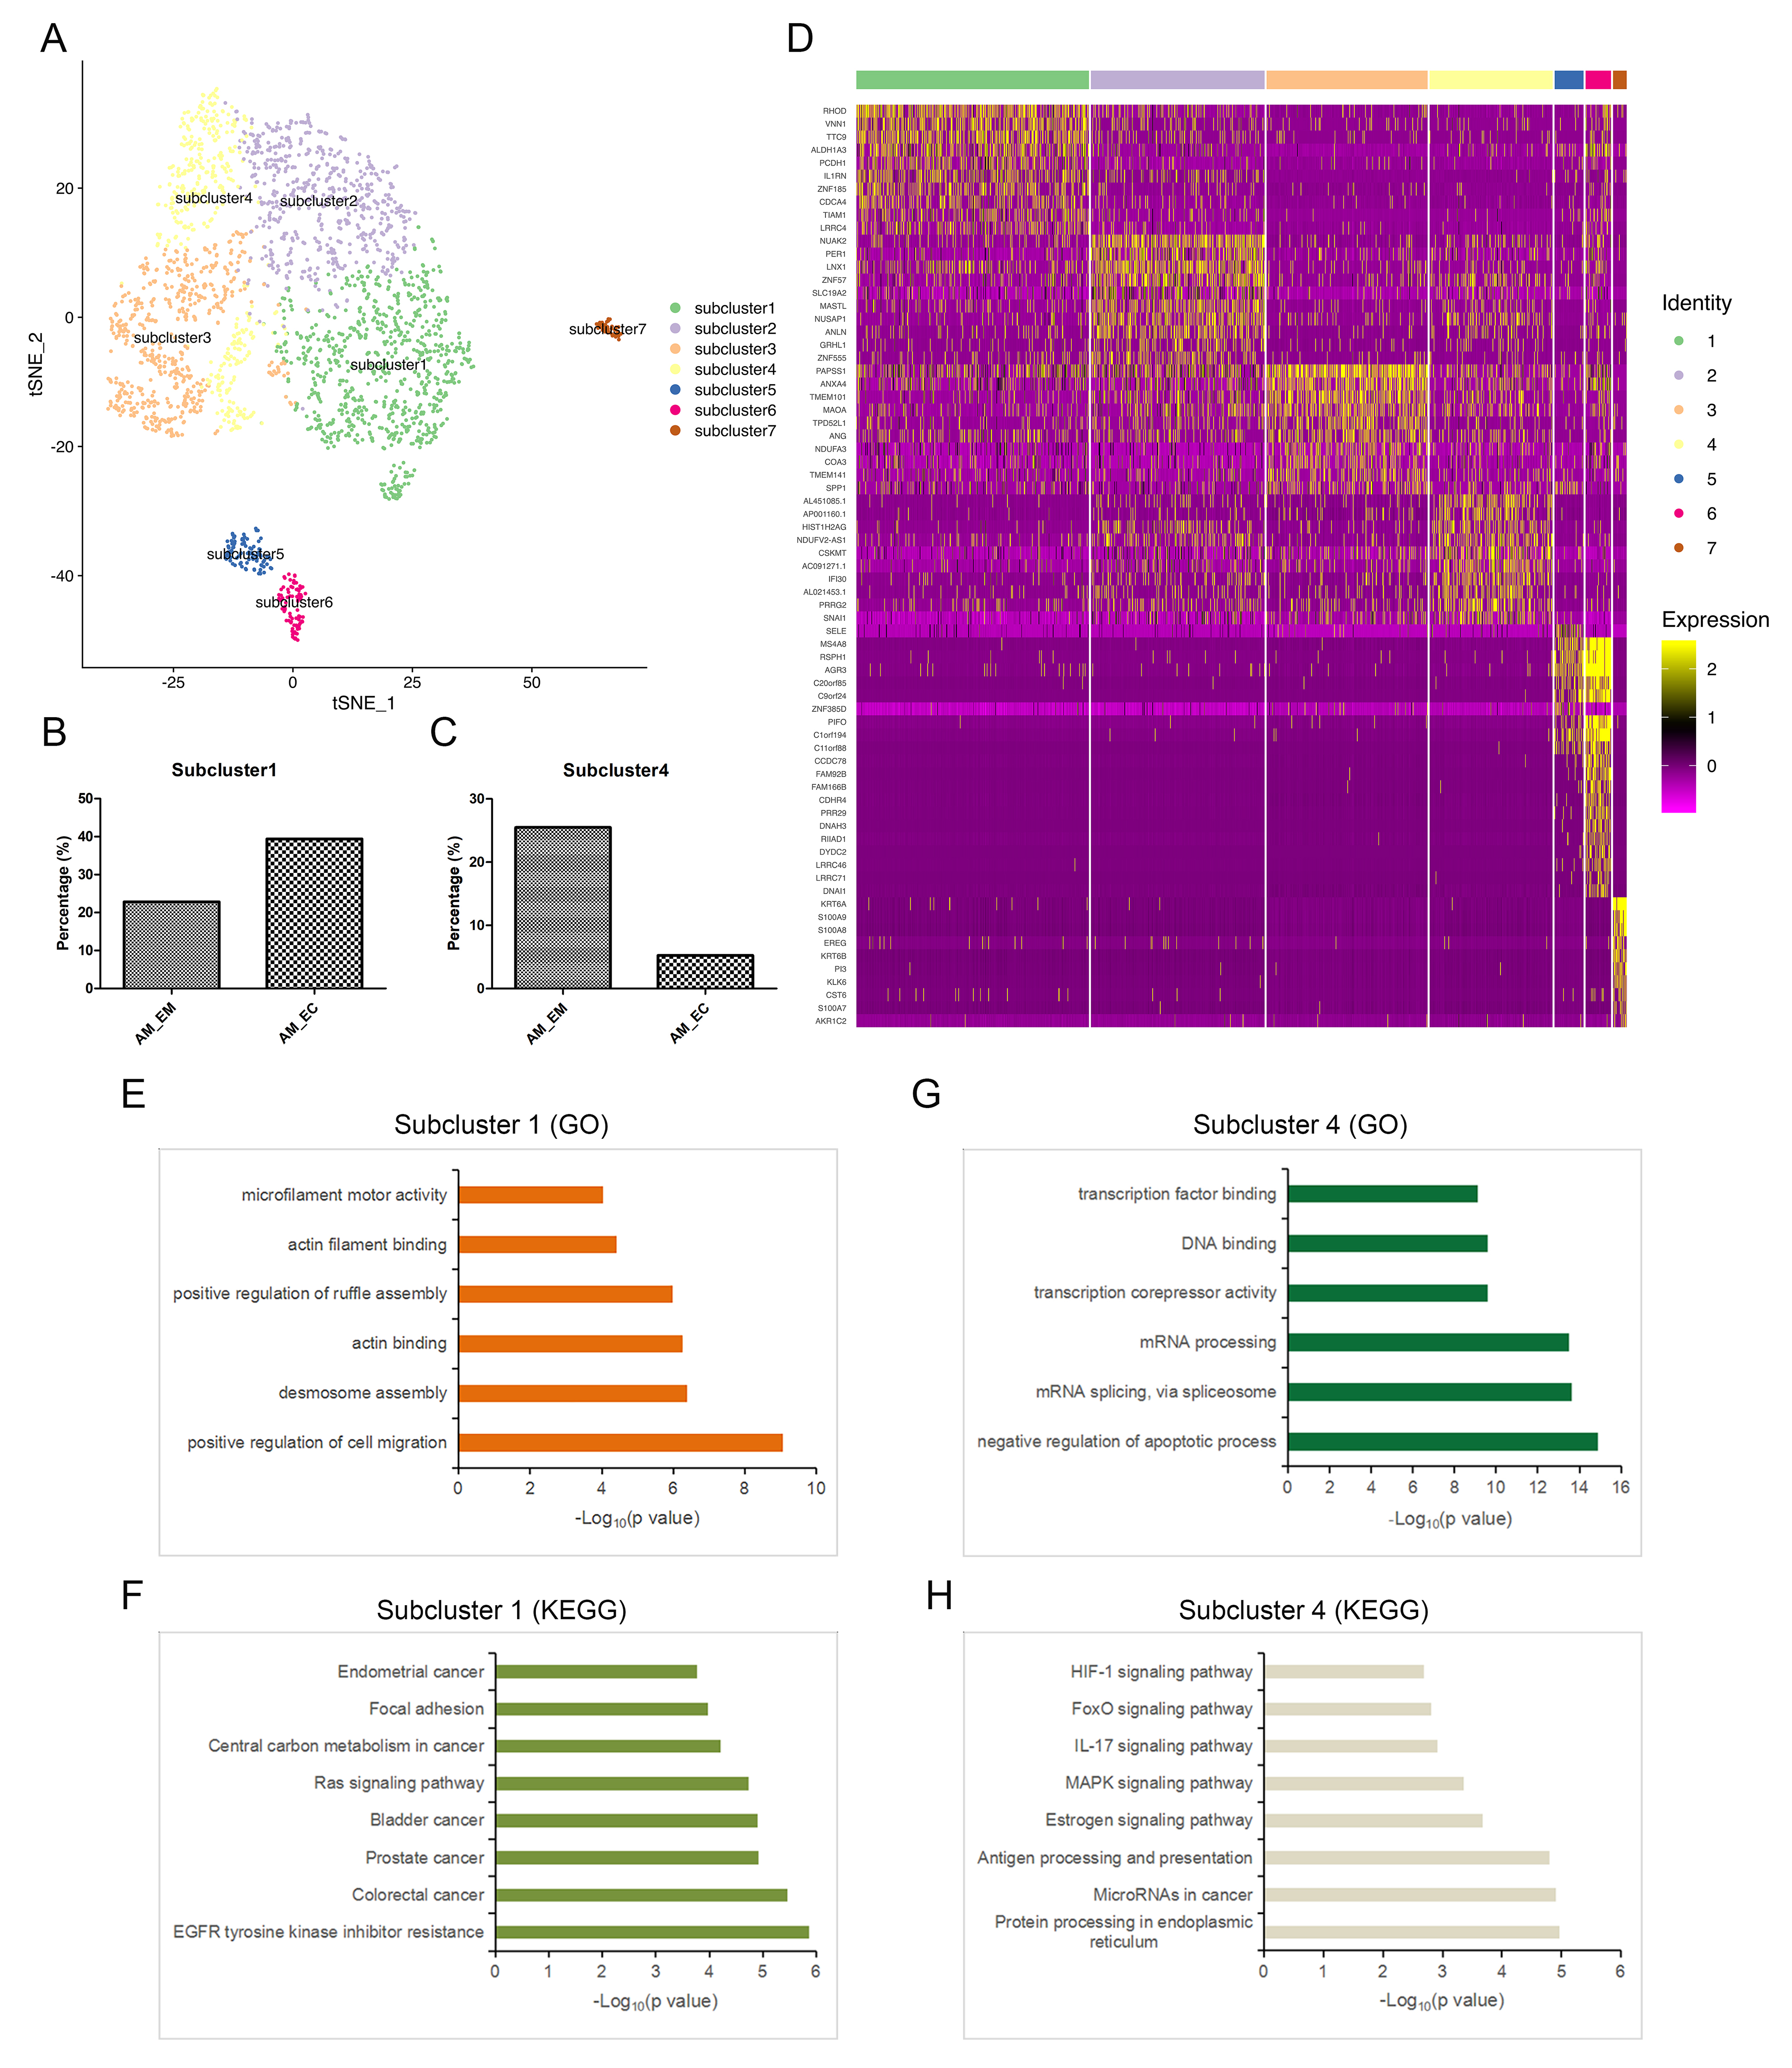
In the epithelial cell population, compared with those in the AM_EM group, the upregulated genes (fold change > 1.5) in the AM_EC group were evaluated by GO analysis, and the main functions of these genes were enriched in the items related to cell motility, including positive regulation of cell migration, extracellular matrix organization, wound healing, etc. (Fig. 4A). KEGG analysis showed that in addition to the items related to cell motility, inflammatory-related pathways, such as the NF-κB signalling pathway, IL-17 signalling pathway and TNF signalling pathway, were also enriched among the upregulated DEGs (Fig. 4B). Moreover, the genes that promote cell mobility, including ITGA2, ITGB8, RHOD [31], VNN1 [32, 33], ALDH1A3 [34], and TIAM1 [35], were highly expressed in the AM_EC group (Fig. 4C). These results indicate that the epithelial cells derived from AM exhibited high motility.
Seven subclusters were identified in epithelial cells based on t-SNE analysis (Additional file 1: Figure S5A); moreover, the proportion of subcluster 1 in the AM_EC group was higher than that in the AM_EM group, while the proportion of subcluster 4 followed the opposite trend (Fig. 4D and Additional file 1: Figure S5B, C). Through the heatmap visualization of gene expression, we found that each subcluster had different gene expression characteristics. Moreover, genes related to cell migration, such as RHOD, TIAM1, VNN1, and ALDH1A3, were mainly enriched in subcluster 1 (Additional file 1: Figure S5D). This indicates that subcluster 1 may be a group of cells with a high migratory ability. Since the pathogenesis of AM is related to endometrial invasion, migration and EMT, functional enrichment analysis was conducted for subcluster 1, and the results suggest that the specific functions of subcluster 1 mainly focus on cell migration and related cytoskeleton regulation (Additional file 1: Figure S5E), which is consistent with the enrichment of migration-related genes in subcluster 1. The proportion of subcluster 1 cells in the AM_EC sample was higher than that in the AM_EM sample (Additional file 1: Figure S5B); thus, more cells with an active migratory ability accumulated in the AM_EC group. KEGG analysis in subcluster 1 revealed that this cell group was mainly enriched for cancer-associated terms (Additional file 1: Figure S5F), which was identical to the report that AM possessed malignant tumour features. VNN1 participated in the regulation of cell migration and specifically existed in subcluster 1 (Fig. 4E, F); therefore, EPCAM, as a marker gene of epithelial cells, was costained with VNN1 to identify the existence of this cell group in tissue samples. EPCAM and VNN1 colocalization emerged in the AM_EM and AM_EC groups (Fig. 4G). These results suggest that there was a group of cells with high migratory ability in the epithelial cells of AM, which contributes to the progression of the disorder.
The proportion of subcluster 4 in the AM_EM group was higher than that in the AM_EC group (Additional file 1: Figure S5C), and the functions of the subcluster were mainly focused on the regulation of cell survival, transcription and mRNA processing (Additional file 1: Figure S5G). KEGG analysis showed that inflammation-related pathways and antigen processing and presentation were enriched in this subcluster (Additional file 1: Figure S5H); thus, subcluster 4 might be involved in inflammation. In general, these results indicate that functions related to cell migration, tumour, cell survival and inflammation in AM had begun to accumulate in epithelial cells; however, the proportion of corresponding subclusters was different between the AM_EC and AM_EM groups.
Pseudotime trajectory analysis of the epithelial cell, cluster 1 and endothelial cell groups reveals epithelial transition to endothelial cells.
In view of the existence of epithelial cells and endothelial cells in the identification of cell types, cluster 1 was sandwiched in the middle next to the epithelial cells and endothelial cell groups in the t-SNE map, and there was colocalization of epithelial cells and endothelial cell markers in cluster 1. In addition, it has been reported that epithelial-endothelial transition (EET) may occur in the process of tumour progression, which is considered a subtype of EMT [36]. Accumulating evidence indicates that there may be a transition between epithelial cells and endothelial cells in AM; therefore, pseudotime trajectory analysis was conducted in the epithelial cell, cluster 1 and endothelial cell groups.
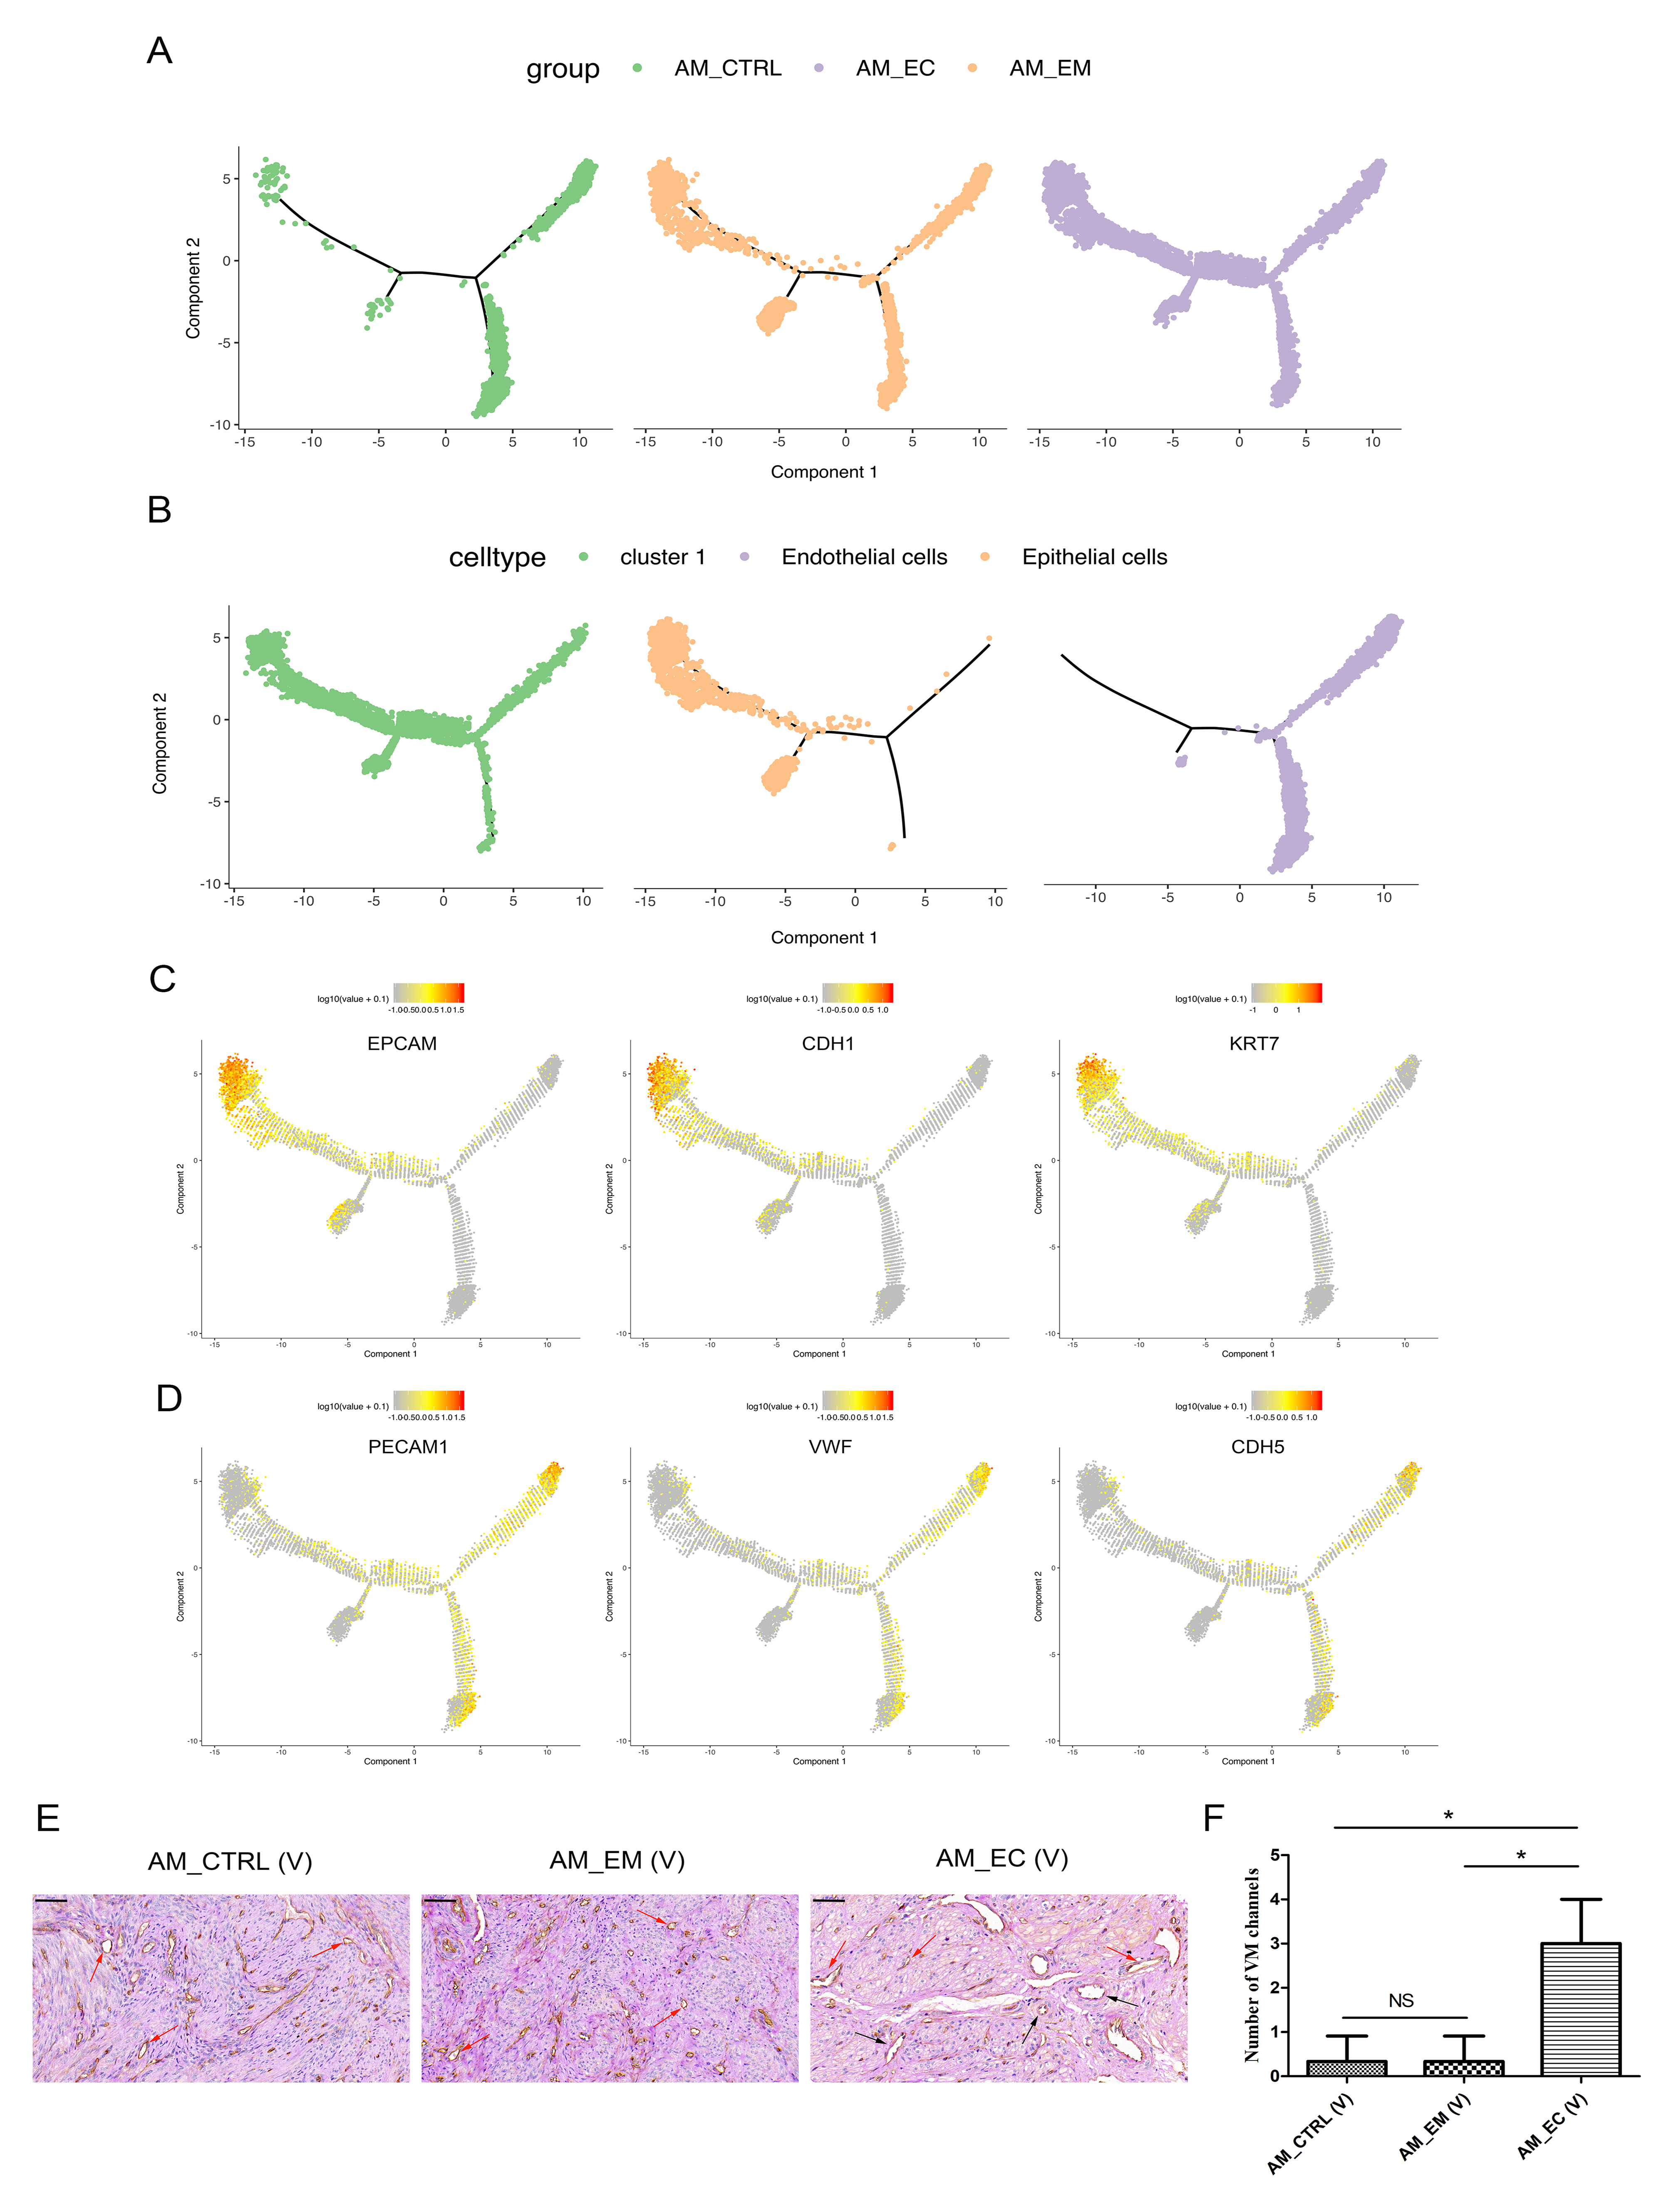
To reveal this relationship in transcriptology and to study the genes that regulate this process, cells were arranged in a pseudotime manner with a pedigree reconstruction algorithm for biological processes based on transcriptional similarity [37, 38]. We found that the cells in epithelial cell, cluster 1 and endothelial cell groups formed a continuous trajectory (Fig. 5A, B), and the groups and cell types on trajectory was indicated (Additional file 1: Figure S6A, B). Furthermore, markers of epithelial cells (EPCAM, CDH1 and KRT7) and endothelial cells (PECAM1, VWF and CDH5) were mapped on the trajectory (Additional file 1: Figure S6C, D). The above results suggest that epithelial cells transited to endothelial cells according to the continuous pseudotime trajectory, and only AM_EC group, but not AM_CTRL and AM_EM groups, could form continuous trajectory. The epithelial cell type and its markers were mainly located on the left side of the pseudotime trajectory, and the endothelial cell type and its markers were mainly distributed on the right side of the pseudotime trajectory, while cluster 1 cells were distributed over the entire trajectory (Additional file 1: Figure S6B-D). The distribution of cluster 1 was partly related to its characteristics, including epithelial cells, endothelial cells and epithelial and endothelial marker coexpression cells.
Gene expression dynamics showed that the relative expression levels of epithelial cell markers (EPCAM, CDH1 and KRT7) decreased as pseudotime progressed (Fig. 5C); however, that of endothelial cell markers (PECAM1, VWF and CDH5) increased (Fig. 5D). Moreover, the relative expression levels of angiogenesis-related and vasculogenic mimicry (VM) formation-associated markers (F2R, FLT1 and KDR) [36] were also upregulated (Fig. 5E). This indicates that angiogenesis is enhanced with the transformation of epithelial cells into endothelial cells. Since EET could produce the endothelial-like phenotype of tumour cells and promote the formation of VM to enhance the blood supply [36, 39], VM formation was assayed by CD34-periodic acid-Schiff (PAS) double staining. The results show that the number of VM formations in the AM_EC group was increased in the sequencing samples (Fig. 5F, G). Moreover, in the verified samples, the number of VM in AM_EC (V) was significantly increased compared with that in AM_CTRL (V) and AM_EM (V) (P < 0.05). Nevertheless, there was no significant difference between AM_CTRL (V) and AM_EM (V) (Additional file 1: Figure S6E, F). Taken together, the epithelial cell, cluster 1 and endothelial cell groups exhibited EET, with increases in angiogenic factor expression levels and VM formation, which were beneficial to the blood supply.