QTLs associated with LR, SR, and YR
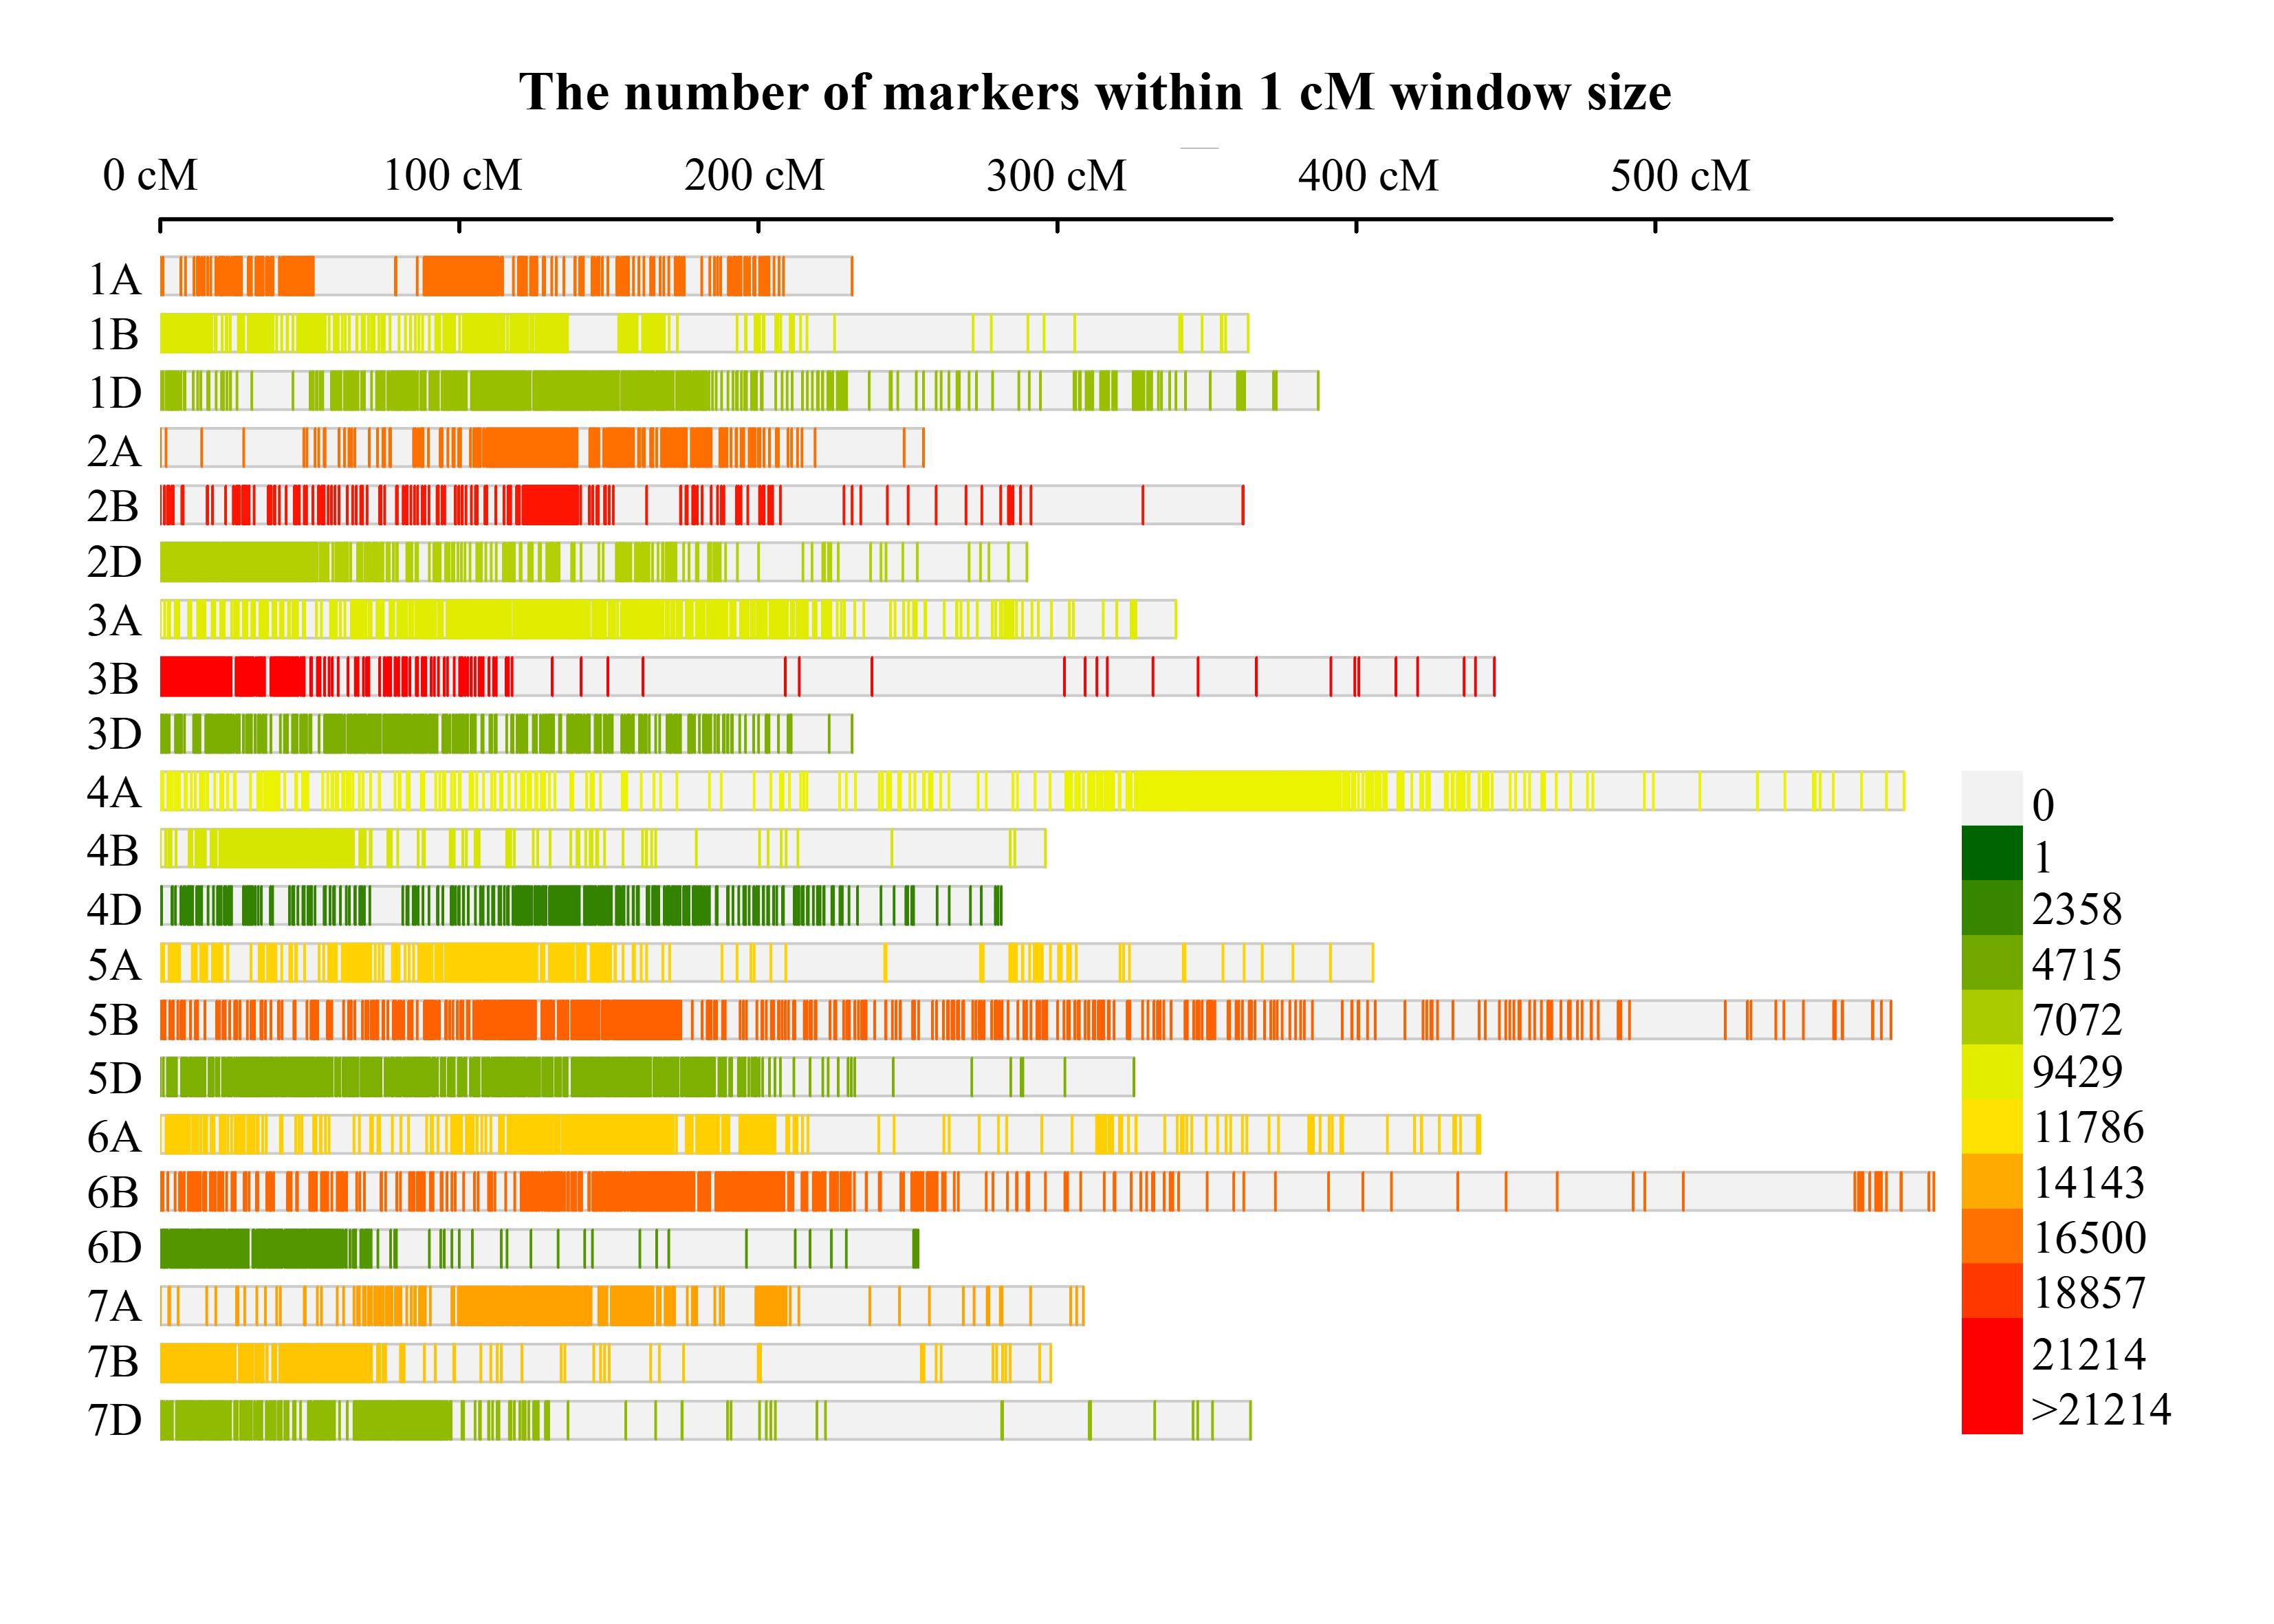
Information of 1146 wheat QTLs (368 for LR, 291 for SR, and 487 for YR) from 152 interval mapping studies were collected (Table S2). These 152 studies included 31 studies for LR, 24 studies for SR, 66 studies for YR, and 31 studies each associated with at least two different rusts (Table S2, Fig. 1a). A total of 160 mapping populations were utilized in these 152 studies, which included 117 sets of RILs, 31 sets of DH lines, and 12 F3/backcross populations (some studies utilized more than one population). The population size in different studies ranged from 58 (Zhang et al. 2016) to 1020 (Agenbag et al. 2014), and the number of QTLs in individual studies ranged from one each in several individual studies (e.g., Kolmer et al. 2011; Wang et al. 2015; Zhang et al. 2016; Zwart et al. 2008) to a maximum of 59 QTLs in one study (Bajgain et al. 2016). The distribution of QTLs for three individual rusts and among 21 chromosomes along with the distribution of QTLs according to PVE and LOD score are presented in Fig. 1.
Consensus map for QTL projection
The three maps (other than the SNP maps) shared 566 markers, whereas, ‘Wheat Composite 2004’ had 3531 unique markers, ‘Wheat Consensus SSR 2004’ had 81 unique markers, and ‘Integrated 2013’ durum wheat map had 2351 unique markers. The number of unique and shared (or common) markers among these maps has been shown via a Venn diagram (Fig. 2). Markers showing ordinal conflicts were removed while constructing the consensus map using LPmerge package of R programming. The consensus map developed for the present study included 234,619 loci, which included both marker loci (SNPs, DArT, SSR, AFLP, RAPD, STS, EST-SSR, SRAP, ISSR, KASP) and gene loci (Vrn, Ppd, Rht, Glu, etc.) (Table S3). The length of the consensus map was 7637.09 cM (Fig. S1), giving a density of 30.72 loci/cM (Table S4). The marker densities for individual chromosomes are presented in Fig. S1. The marker density for individual chromosomes ranged from 7.78 markers/cM for 4D to 71.62 markers/cM for 1A (Table S4). Sub-genome ‘A’ had a genetic length of 2565.38 cM with 91,856 loci (35.8 markers/cM), sub-genome ‘B’ had a length of 2938.05 cM with 106,811 loci (36.35 markers/cM), and sub-genome 'D’ had a length of 2133.66 cM with 35,952 loci (16.85 markers/cM).
For QTL projection, only 718 QTLs, which had flanking markers available on the consensus map were used. These projected QTL included 175 QTLs for LR, 222 QTLs for SR, and 321 QTLs for YR. The distribution of these projected QTLs on three sub-genomes was 209 (65.11%) for A subgenome, 367 (59.09%) for B subgenome and 139 (68.14%) QTLs for D subgenome. Similarly, the number of projected QTLs for individual chromosomes ranged from 9 (4D, 6D) to 93 (2B) with an average of around 34 QTLs per chromosome. Mean CIs in original and projected QTLs also differed for LR, SR, and YR (Fig. 3). Most of the projected QTLs for these diseases showed higher CIs, with respective mean values of 11.84 cM and 14.64 cM for original and projected LR CIs, of 5.63 cM and 6.45 cM for original and projected SR CIs, and of 10.77 cM and 11.2 cM for original and projected YR CIs. For LR, 39.67% and 24.45% of the original and projected QTLs had CIs greater than 10 cM, respectively. For SR, 20.62% and 18.55% of the original and projected QTLs possessed CI values greater than 10 cM, respectively. Lastly, for YR, 32.85% and 21.97% of the original and projected QTLs had CIs greater than 10 cM, respectively.
MQTLs and their salient features
The number of MQTLs obtained was 86, which involved only 596 of the 718 QTLs that were projected (Fig. 4, Table 2, Table S5). The remaining 122 projected QTLs included (i) 110 QTLs, for which the predicted QTL peaks were not included within any MQTL, and (ii) 12 singletons, each with solitary QTL in a predicted MQTL. The 86 MQTLs were distributed on all wheat chromosomes except chromosome 6D (Fig. 4), involving a maximum of 9 MQTLs on 6A and a minimum of only two MQTLs each on 3D, 6B, 7A, and 7D (Fig. 5a). Moreover, the number of MQTLs did not depend on the number of QTLs on individual chromosomes utilized for MQTL analysis, for instance, chromosomes 3B, 6B, and 7D each had many more initial/original QTLs but relatively fewer MQTLs (Table S5).
Only 71 of the 86 MQTLs could be classified as MDR-MQTLs, which included 28 MQTLs for all the 3 rusts, and 43 for two rusts each (8 for LR and SR; 14 for LR and YR; 21 for SR and YR) (Fig. 5b). The remaining 15 MQTLs each provided resistance for only one rust (1 for LR; 6 for SR and 8 for YR) (Table 2, Table S5). The number of QTLs per MQTL ranged from ≤ 5 in 52 MQTLs to ≥ 20 QTLs in the three MQTLs (viz., MQTL2B.3, MQTL3B.1, and MQTL7D.1) (Fig. 5c). At least 34 MQTLs (39.53%) were derived after clustering QTLs from four or more different studies involving distinct parental lines; they should be more stable across environments.
The CI of the MQTLs ranged from 0.04 to 14.3 cM (mean 1.58 cM), while that of projected QTLs ranged from 0.008 to 83.5 cM (mean 10.57 cM); this amounts to a range of 21.6 fold reduction in MQTL on 6B and ~14-15 fold reduction in MQTLs on 3B, 7D, 2B, with a mean of 6.69 fold reduction in the CI of all MQTLs (Fig. 5d). These lengths of CI in cM (genetic distance) corresponds to a physical distance, which ranged from 19 Kb (MQTL6A.1) to 604.3 Mb (MQTL2D.1) with a mean of 51.3 Mb in 78 of the 86 MQTLs (barring 1A.1, 1A.2, 1B.7, 1D.4, 1D.5, 2A.1, 4B.7, 4B.8); CI in 47 of these MQTLs each covered a physical distance of <20 Mb. The LOD score of individual MQTLs ranged from 3.09 to 28.05 (mean 8.33), while the PVE ranged from 4.74 to 51.02% (mean 16.33%).
Ten MQTLs were selected to be the most important for breeders and were, therefore, named breeders’ MQTLs. Following criteria were used for the identification of breeders MQTLs: (i) MQTLs involving QTLs for all the three rusts, (ii) CI <2 cM, (ii) average PVE >15%, (iii) average LOD >8, and (iv) involvement of at least 5 QTLs within the MQTL. These MQTLs included the following: MQTL1B.1, 2A.3, 2A.5, 2B.1, 2B.2, 2B.3, 3B.1, 4A.1, 6A.1, and 7D.2 (Table 3). Five MQTL hotspots were also identified, one each on chromosomes 1B, 2A, 2B, 3B and 4B. Each of the five hotspots consisted of 2 MQTLs as follows: (i) MQTL1B.2 and MQTL1B.3, containing 10 QTLs, each controlling all the three rusts (ii) MQTL2A.3 and MQTL2A.4, containing 23 QTLs, each controlling all the three rusts, (iii) MQTL2B.2 and MQTL2B.3, containing 49 QTLs, each controlling all the three rusts (iv) MQTL3B.2 and MQTL3B.3 comprising 10 QTLs, each controlling two rusts (v) MQTL4B.5 and MQTL4B.6 containing 4 QTLs, each controlling two rusts (Fig. 4; Table 3).
MQTLs overlapping GWAS-MTAs
In order to identify MQTLs with a higher level of confidence, the above 78 MQTLs (only 78 of 86 were physically anchored) were compared with 1,926 MTAs for the three rusts, reported in 23 GWAS; this resulted in the identification of 54 MQTLs overlapping 497 MTAs (Table S6); 22 MQTLs overlapped MTAs for all the three rusts while 17 MQTLs overlapped MTAs, each for at least two of the three rusts; 15 MQTLs overlapped MTAs controlling only one the three rusts. The number of MTAs for each MQTL also varied, ranging from 1 MTA (for several MQTLs) to 78 MTAs (for only one MQTL, namely MQTL6A.9) (Table S6).
MQTLs carrying R genes
R genes overlapping MQTLs were also identified; 42 R genes (9 Lr genes: 5 Sr genes and 28 Yr genes) were colocalized with 20 MQTLs (Table S5); MQTL2B.5 co-localized with the following 13 R genes: Lr35, Sr36, YrSP, Yr5, Yr7, Yr43, Yr44, Yr53, Yr72, Lr13, Yr27, Sr9, and Sr28 genes; MQTL1B.2 colocalized with Yr10 and Yr64 and MQTL2A.2 colocalized with Lr17 and Lr37 (Table S5). Overall, 3, 1, and 11 MQTLs colocalized with the genes conferring resistance to LR, SR, and YR, respectively. The only MQTL with R genes for all the three rusts is MQTL2B.5.
Candidate genes (CGs) and their gene ontology (GO) terms
In total, 1707 putative CGs were identified for 77 MQTLs (no CG for MQTL4B.3) revealing several GO terms involved in various biological, molecular, and cellular processes. Some of the important GO terms include those involved in processes like the following: defense response, toxin activity, DNA binding, phosphorylation, protein ubiquitination, proteolysis, transmembrane transport, oxidation-reduction processes, catalytic activity, ATP binding, protein binding, heme binding, iron ion binding, metal ion binding, transmembrane transporter activity, oxidoreductase activity, etc. (Table S7).
Differentially expressed CGs (DECGs) in MQTL regions
In-silico expression analysis was carried out for CGs of only 27 MQTLs (of 77 MQTLs that were used for identification of CGs), each with QTLs for all the three rusts (541 CGs were available). Only 81 CGs belonging to 22 MQTLs (from 27 MQTLs) were differentially expressed. These 81 DECGs were also analyzed for GO enrichment. GO terms were not available for 14 of these genes. The remaining 67 genes revealed important GO terms (Fig. 6a). These DECGs encoded proteins belonging to the following categories: R-domain containing proteins, transcription factors (Zn finger binding proteins, SANT/Myb domains, NAC domain, bHlH TFs), transporters (ABC transporter, proton/oligo-peptide transporter, MFS transporter domain), protein kinases, proteins involved in calcium signaling, peptidases, proteins involved in oxidoreductive processes (RuBisCO_sc, G6P_DH, FAD/NAD(P)-binding domain), etc. (Table S8 and S9). Interestingly, 8 out of the 81 DECGs showed differential expression for all the three rusts. A representative heat map of these DECGs is presented in Fig. 6b.
Homoeology among MQTLs
In the present study, homoeologous genes were identified for the 78 MQTLs located on 20 wheat chromosomes. The number of genes that were conserved among different MQTLs at corresponding position, ranged from few to hundreds. The information regarding the number of total genes available from the MQTL regions and those conserved between the MQTLs located on different chromosomes is reported in Table S10. In addition to the detection of homoeology among the MQTLs located on chromosomes of a certain homoeologous group, partial homoeology was also observed among the MQTLs located on chromosomes belonging to different homoeologous groups (Fig. 7).