For a comprehensive understanding of TECPR2 function, we compiled and integrated independent layers of genome-scale functional data. Such combined information provides a clearer and broader interpretation of TECPR2 function than offered by each layer separately (Fig. 1). Information streams used to understand TECPR2 function included PPI, expression patterns, phylogenetic profiling, transcription factor binding, and population variation. The full list of genes and proteins and their relationships to TECPR2 is detailed in Table S1.
TECPR2 transcription factors and coregulated genes have developmental functions
Since genes that function together are often co-regulated at the transcriptional level, we first identified putative transcriptional regulators of TECPR2 and examined their other targets. Among transcription factors predicted to bind the TECPR2 promoter and nearby enhancer elements were the developmental factors KDM1A and CTBP1, both part of the notch signaling pathway [37]. The other targets of these factors include the neurological disease-associated CINP, DYNC1H1, and MIR431 genes [38]. Table S2 details the 335 factors predicted to bind multiple TECPR2-associated cis-regulatory elements (promoter/enhancers), and their 37 other gene targets. In light of its suggested developmental context, we next focused our analyses on neurodevelopmental expression.
TECPR2 expression resembles that of neurodevelopmental genes; it is strongly anticorrelated to ribosomal protein expression and downregulated in AD and HD
We analyzed the expression patterns of 524 spatiotemporal samples representing typical human neurodevelopment. TECPR2 expression increased with prenatal age across all brain regions (Pearson’s r = 0.48, P = 0.01, Fig. 2). During the postnatal period, no significant relationship between TECPR2 expression and age was detected (Pearson’s r = 0.22, P = 0.26). No sex difference was detected during prenatal or postnatal development (P = 0.8 and P = 0.4, respectively).
Since genes that function together must be coexpressed, we next examined TECPR2-containing coexpression networks. In all, 578 genes showed a similar expression pattern in the developing human brain (Table S3). Of these, 184 were positively correlated with TECPR2, including many neurodevelopmental disease genes such as KIF1A [39], SHANK3 [40], TOM1L2 [41], ABCA2 [42], PLEKHA6 [43], ATXN1L [44], and CNTNAP1 [45]. Many of the negatively correlated genes (177 of 394 genes) encode ribosomal proteins (RPs), including RPL24, RPS3A, RPS6, RPS8, RPL15, RPL5, RPL11, RPL23, and RPS7, suggesting that TECPR2 function is negatively related to translation.
The release of these RPs, including RPL5, RPL11, RPL23, and RPS7, was previously shown to promote the accumulation of p53, which plays a pivotal role in neurodegenerative disorders via its upregulation [46]. Consistently, we found that TP53 expression is anticorrelated to TECPR2 expression across 31 human tissues in an age and sex adjusted model (Pearson’s r = -0.405, P = 2.33 × 10− 16). Consistently, we found that TECPR2 is downregulated in prefrontal cortex of individuals with AD and HD, two neurodegenerative diseases in in which p53 was shown to be upregulated [46] (AD adjusted P = 2.83 × 10− 6, HD adjusted P = 2.87 × 10− 9, Fig. 3).
We also examined TECPR2 co-expression partners across human tissues at both the RNA and protein levels. Table S4 details 19 genes whose expression pattern resembles that of TECPR2 across 69 human tissues, suggesting that their functions might be related. These include the Charcot Marie Tooth disease gene MTMR2, the coloboma of macula gene NRBP2, and other neurodevelopmental disease genes such as MACROD2 and NGFR.
Phylogenetic profiling reveals that many genes that have co-evolved with TECPR2 serve central neurodevelopmental functions
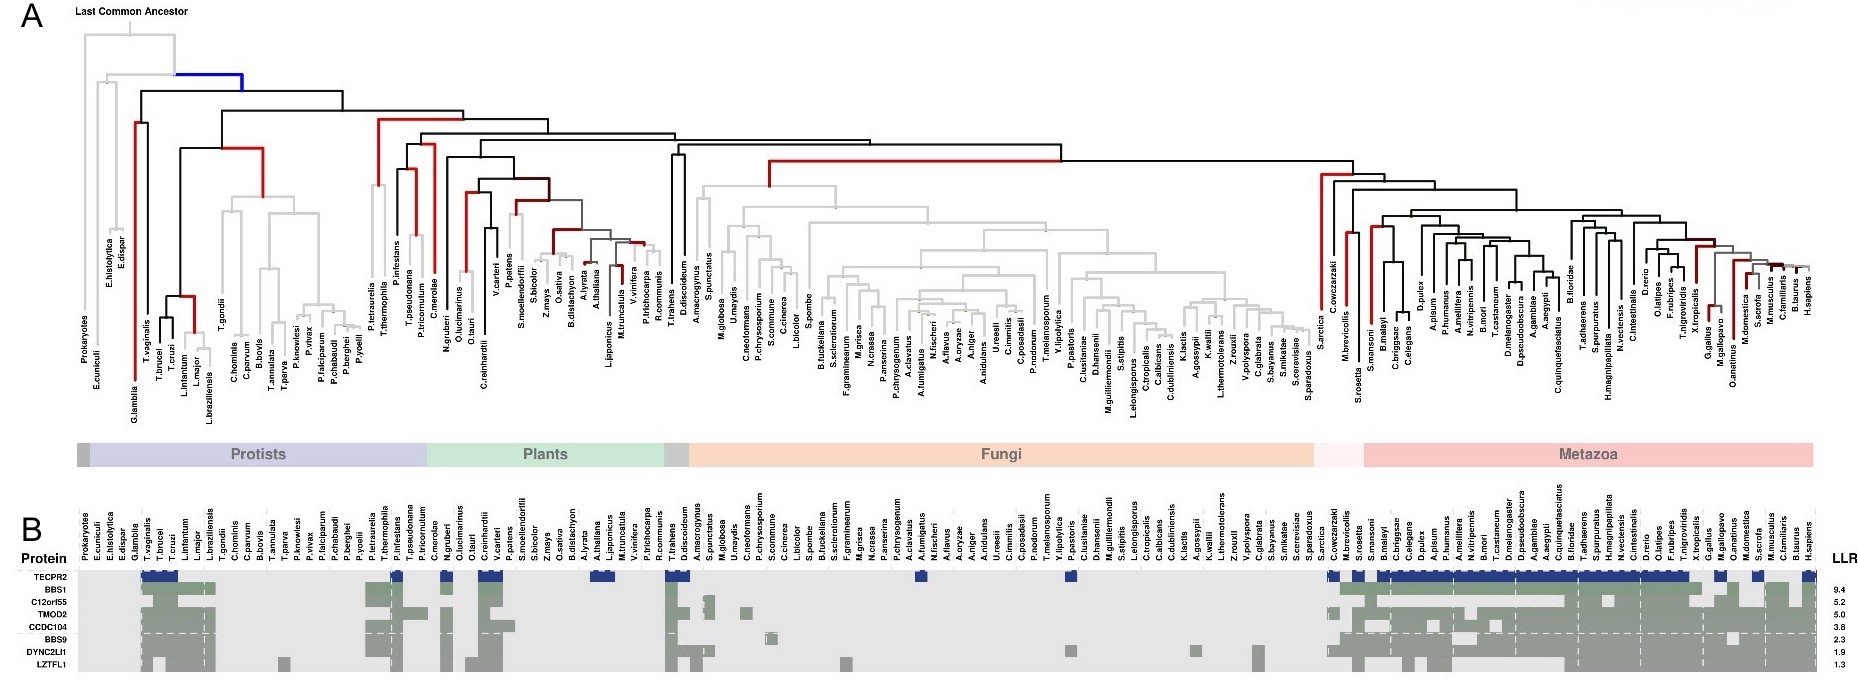
We also examined shared patterns of gene presence and absence across species, that can point to shared functions. For that purpose, we used two phylogenetic profiling approaches. The first, CLIME, identified seven genes predicted to have co-evolved with TECPR2. These include the neurodevelopmental disease genes BBS1, BBS9 [47], and TMOD2 [48], as depicted in Figure S1. The second approach PhyloGene, similarly revealed that many of the genes that have coevolved with TECPR2 serve neurodevelopmental functions. As detailed in Table S5, these include ATXN1 [44], DLGAP4 [40], TRAK1 [49], and FILIP1 [50].
PPI highlight the role of TECPR2 in autophagy
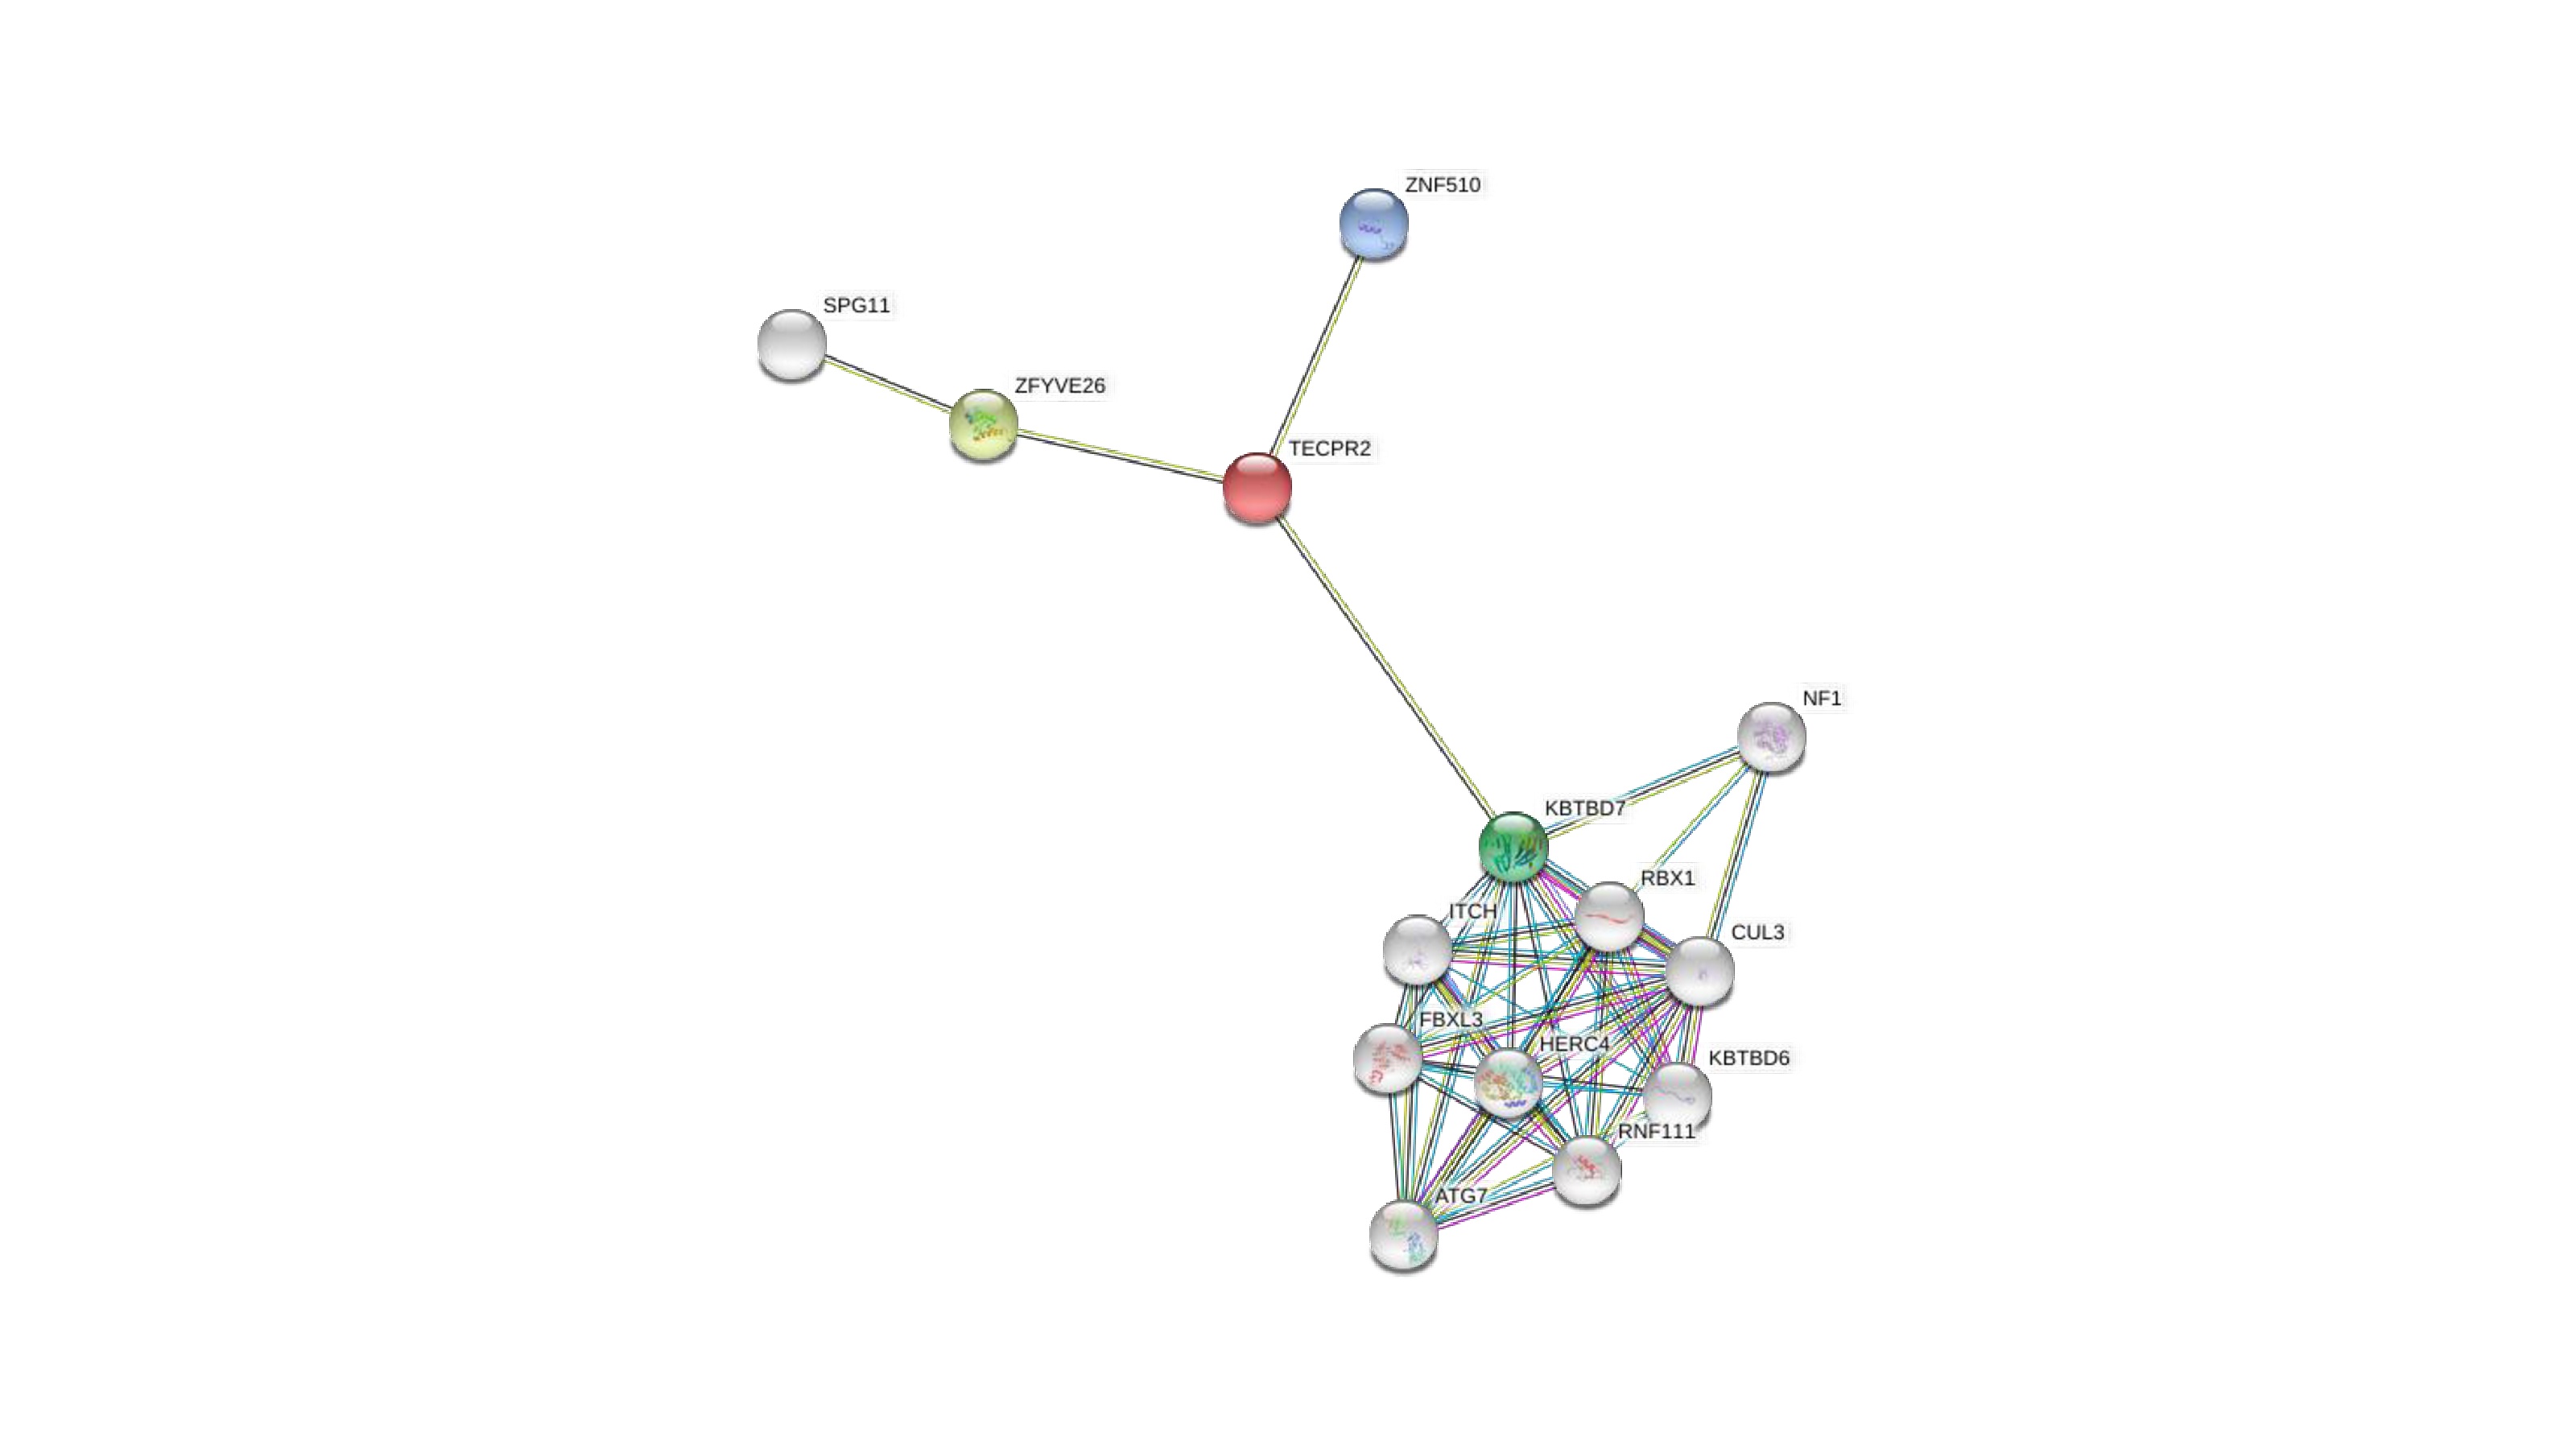
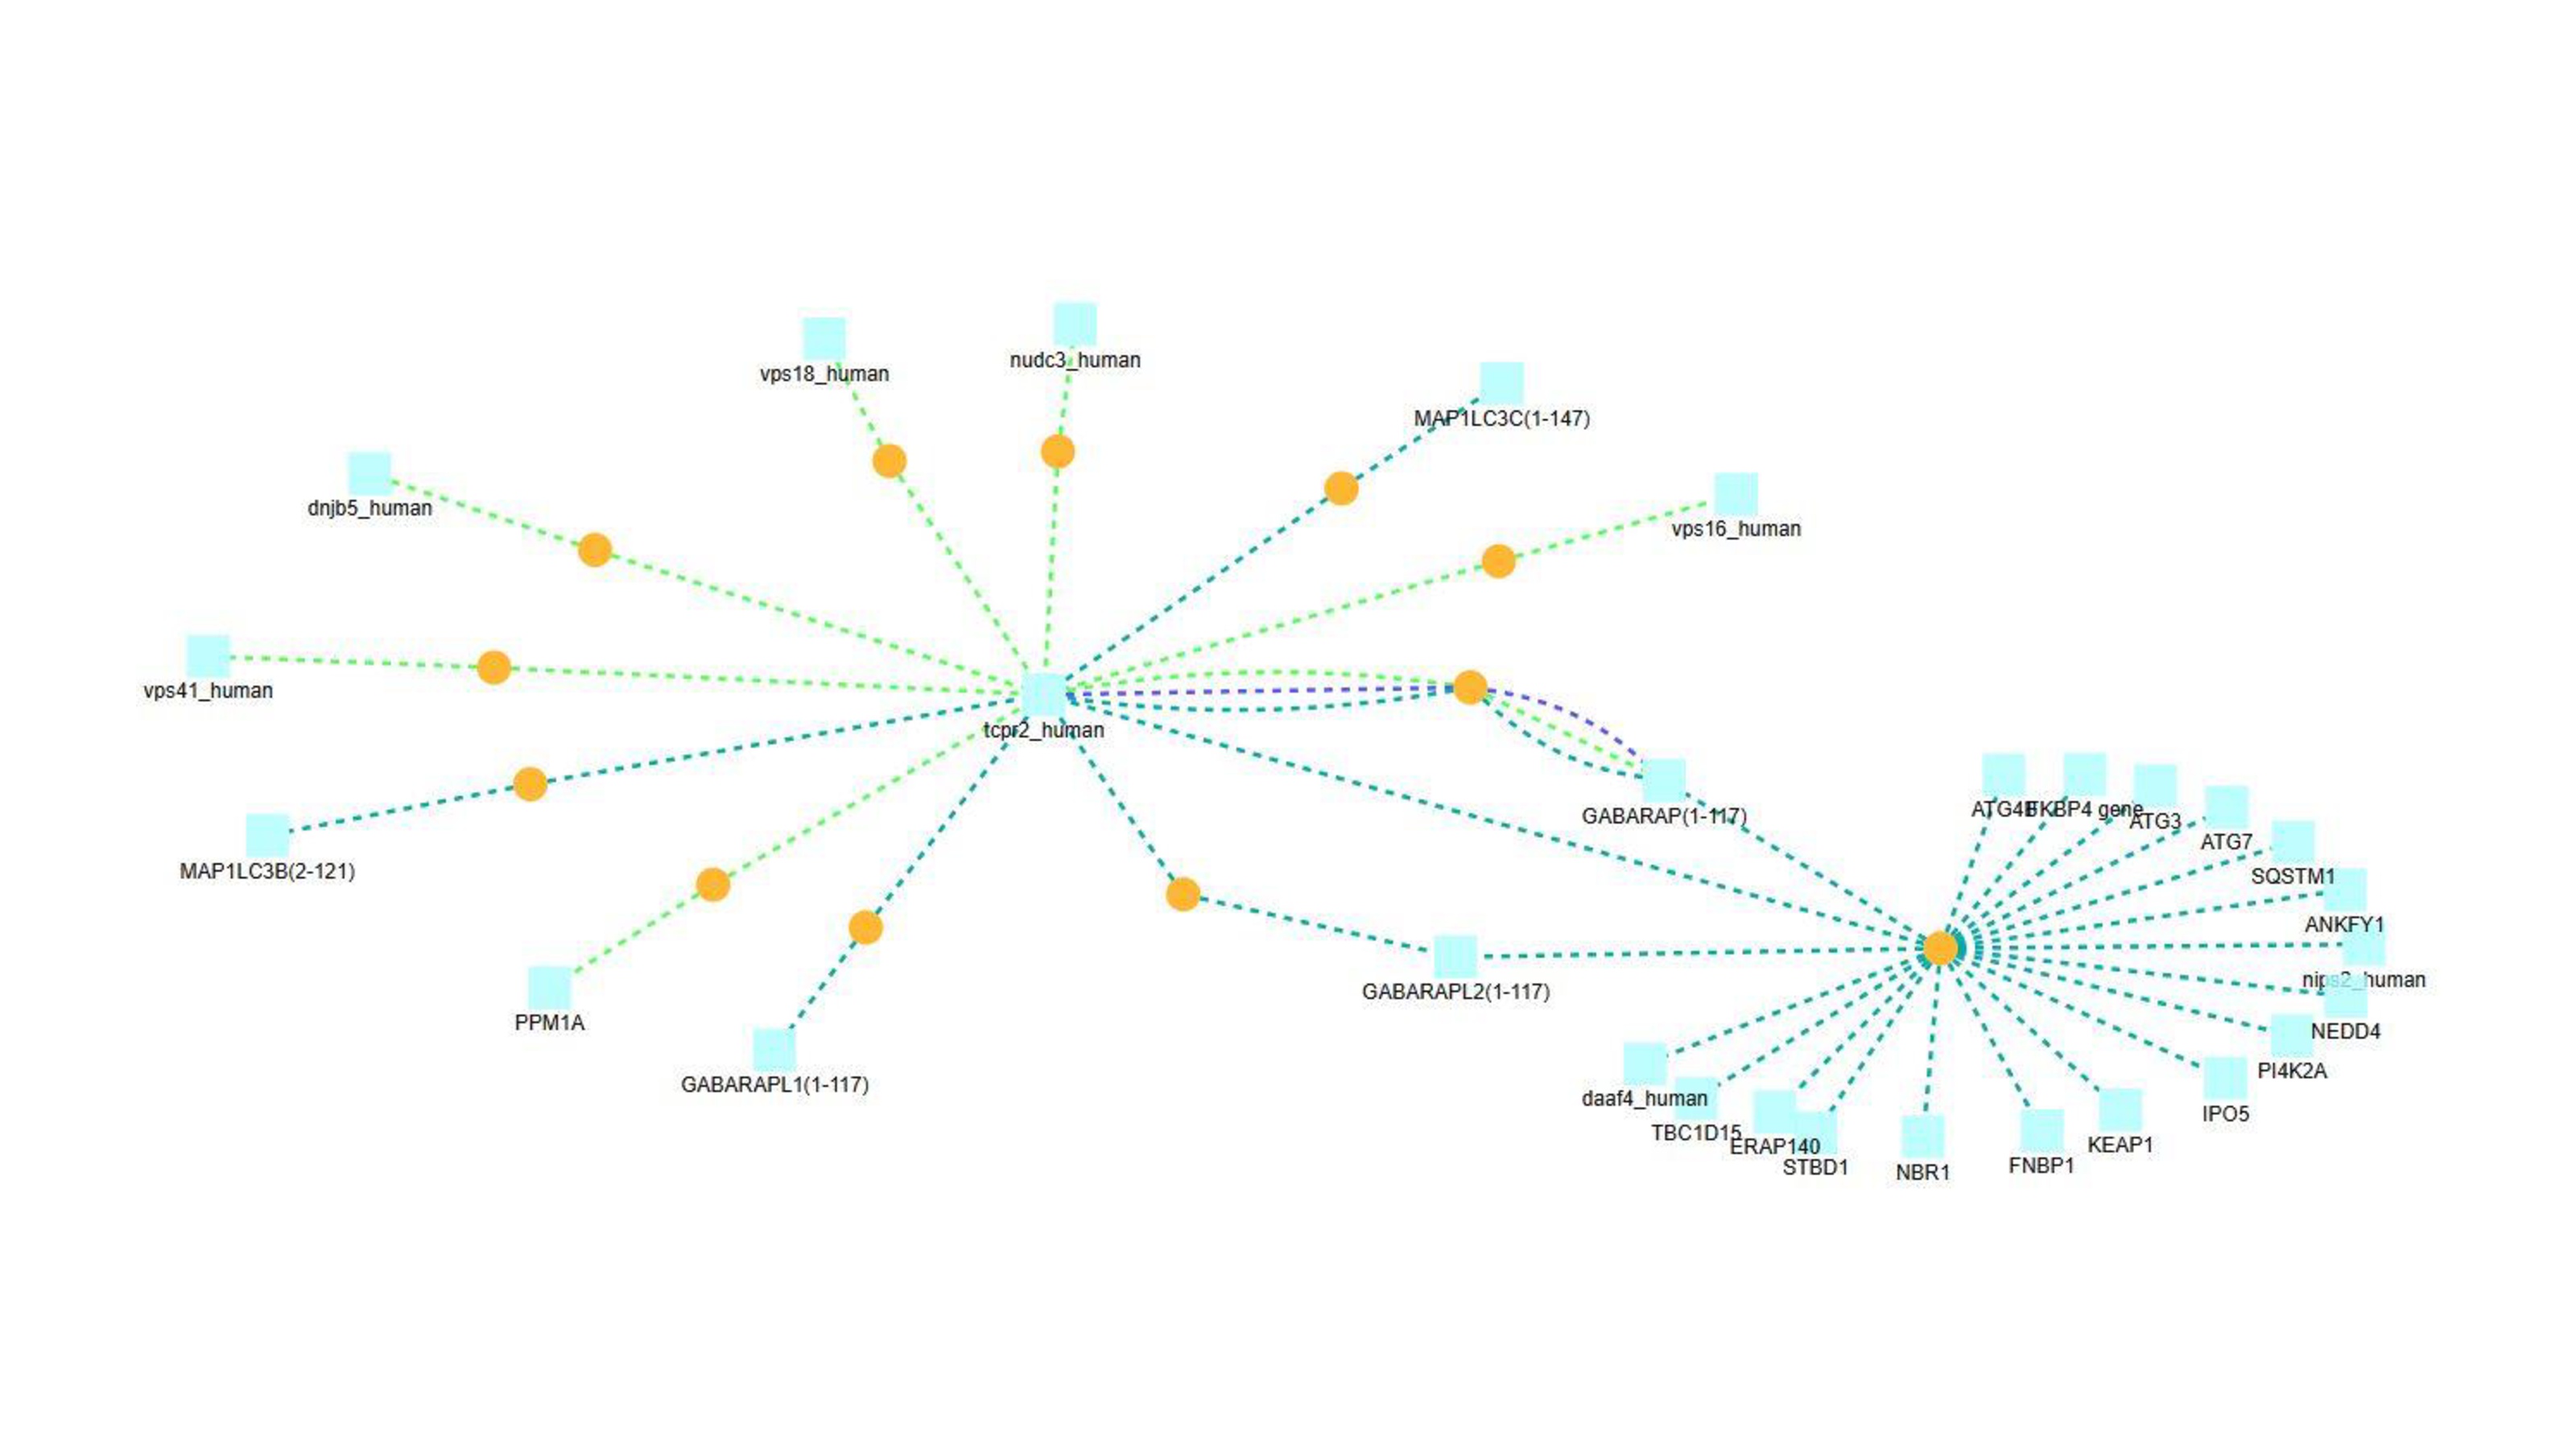
Since interacting partners of known function can point to a shared function, we next mined several PPI databases. In all, 55 experimentally-validated TECPR2-binding partners were identified, as detailed in Table S6. For example, Figure S2 depicts an integrated 27-protein interaction network, showing that the majority of validated TECPR2 interactions are with proteins involved in autophagy. These include the autophagy-related ATG8 family members GABARAP, GABARAPL1, GABARAPL2, MAP1LC3B, and MAP1LC3C [9]. Moreover, a complementary approach implemented in The Search Tool for the Retrieval of Interacting Genes (STRING) identified three direct and ten indirect TECPR2 relationships, highlighting proteins whose dysfunction leads to TECPR2 deficiency-related phenotypes, including FBXL3 [51], ITCH [52], and ZFYVE26 [53]. These are depicted in Figure S3 and detailed in Table S6.
Molecular signatures prognostic of various cancers include TECPR2
We next examined expert-curated expression-based gene sets that include TECPR2, identifying nine sets (Table S7). Of these, seven are informative of various cancers, including gene sets whose expression in optimally debulked ovarian tumors is associated with survival and those up-regulated in nasopharyngeal carcinoma. Genes shared across multiple curated sets include the neurodevelopmental genes BBS9, ATXN1, BACE1, FA2H, FILIP1, NBR1, TRAK1, and ZFYVE26, and the autophagy genes MAP1LC3B and AMBRA1.
TECPR2 expression is associated with survival in renal and liver cancers
In light of the identified TECPR2-containing curated sets, we examined TECPR2 expression in TCGA. TECPR2 was found to be expressed in all cancer tissues at ≥ 1 transcript per million (TPM). When comparing tumor to normal gene expression, TECPR2 was found to be significantly dysregulated in urothelial carcinoma, cholangiocarcinoma, diffuse large B cell lymphoma, acute myeloid leukemia, testicular germ cell tumors, and endometrioid carcinoma (Adjusted P < 1 × 10− 3, Fig. 4A). Kaplan-Meier survival analyses showed a favorable effect for high TECPR2 expression in renal cancers, including clear cell renal cell carcinoma (CCRCC), papillary renal cell carcinoma (PRCC), and chromophobe renal cell carcinoma (P = 6.5 × 10− 9, cut-off of 3.25 FPKM, Fig. 4B), and an unfavorable effect in hepatocellular carcinoma (HCC, P = 5.7 × 10− 5, cut-off of 1.67 FPKM, Fig. 4C). Taken together, these findings suggest that TECPR2 dysregulation might have a high prognostic value for several cancer types.
Integrative functional analyses converge on a neurodevelopmental function in protein synthesis, autophagy, and splicing
To gain an integrative view of TECPR2 function and minimize experiment-specific bias, we focused our analyses on genes and proteins linked to TECPR2 via multiple independent lines of evidence (detailed above). In doing so, we examined the shared functions of 332 genes and proteins linked to TECPR2 function via multiple multimodal datasets (Table S8 and Fig. 1). Their functional enrichment analyses revealed a strong convergence on four molecular themes, namely protein synthesis, autophagy, splicing, and belonging to a neurodevelopmental gene expression program. Among pathways and mechanisms related to protein synthesis were the Reactome pathways “Formation of a pool of free 40S subunits” (Adjusted P = 8.01 × 10− 26), “Peptide chain elongation” (Adjusted P = 2.58 × 10− 24), and “SRP-dependent cotranslational protein targeting to membrane” (Adjusted P = 1.64 × 10− 9). Macroautophagy (Adjusted P = 0.01) and autophagosome (Adjusted P = 0.017) were some of the enriched concepts related to autophagy. The Reactome “mRNA Splicing - Major Pathway” (Adjusted P = 0.017) was most enriched among several splicing-related concepts. Finally, The Reactome pathways “Activation of anterior HOX genes in hindbrain development during early embryogenesis” (Adjusted P = 0.037) and “Downregulation of SMAD2/3:SMAD4 transcriptional activity” (Adjusted P = 0.038) are examples of enriched neurodevelopmental gene expression programs. These and other enriched functions are detailed in Table S8.
TECPR2 population variation demonstrates that its function is nonredundant
After gaining insight into the cellular functions of TECPR2, we further examined their centrality using human population variation data. Based on 141,456 exomes aggregated by gnomAD [34], TECPR2 was found to be extremely intolerant of loss-of-function (LoF) protein truncating variants (probability of LoF intolerance, pLI = 0.95 in ExAC[54]). The strong intolerance of TECPR2 to LoF variation is also supported by a low LoF observed/expected (oe) ratio of 0.22, 90% confidence interval (CI) = [0.14,0.35]. Conversely, its closely related paralog TECPR1, is highly tolerant to LoF variation (pLI = 0.000, oe = 0.36, 90% CI = [0.26, 0.5]). These results suggest that TECPR2 is a nonredundant core gene of the human cellular machinery.