5.1 Materials
All chemicals and organic solvents were of analytical grade. Chemicals and instruments used in this study included Doxorubicin hydrochloride, L-arginine, L-histidine hydrochloride and L-cysteine hydrochloride (Sangon Biotech, Shanghai, China); Beclin1siRNA (CST); Cell Counting Kit-8 (Dojindo Molecular Technologies, Tokyo, Japan); mRFP-EGFP-LC3 (Genomeditech, Shanghai, China); PC3 cells (Institute of Biochemistry and Cell Biology, Shanghai, China); Roswell Park Memorial Institute medium (RMPI 1640), penicillin-streptomycin solution (5 KU/mL) and fetal bovine serum (FBS) (Life Technologies, Grand Island, USA); Gelred (Biotium, CA, USA); Matrigel (BD Biosciences, Spaeks, MD, USA); Annexin V-APC Apoptosis Analysis Kit (eBioscience, CA, USA); Antibodiesagainst Beclin1, P62, LC3I/II, paxillin, anti-Ki67 and β-actin (Cell Signaling Technology); and Autophagy Assay Kit (Sigma-aldrich, California, USA). All animal experiments were performed in accordance with the approval of the ethics committee of the Second Military Medical University(Shanghai, China).
5.2 Cells and cell culture
Human PC3 cells (Institute of Biochemistry and Cell Biology, Shanghai, China) were cultured in RPMI 1640 with 10% FBS and 1% penicillin-streptomycin, and incubated under 5% CO2 atmosphere at 37℃.
5.3 Plasmid and transfection
mRFP-EGFP-LC3 plasmid was from Addgene. Cells were transiently transfected with the plasmid using lipofectamine 2000 (Invitrogen) according to the manufacture’s instructions.
5.4 Synthesis of DHRss
First, a histidine-arginine peptide (CH3CR6, HR) was synthesized using the method of F-moc-solid phase peptide synthesis (SPPS). Second, DOX was coupled to Terminal carboxyl group of HR peptide to obtain DOX-HR (DHR) through condensation reaction. The products were purified by reverse HPLC. Then, the DHR(50 mg) and L-cysteine hydrochloride (0.58 mg) were dissolved in 1.8 mL distilled water (pH 7.0). Then, 0.2 mL 5% hydrogen peroxide was added dropwise to the mixed solutions with stirring and incubated for 12 h. Then, the mixture was dialyzed in water for 12 h and freeze-dried for another 24 h to produce DHRss.
5.5 Preparation of DHRss polymer micelle (DOX-PMs), si-Beclin1 loaded HRss polymer micelle (Co-MPs)
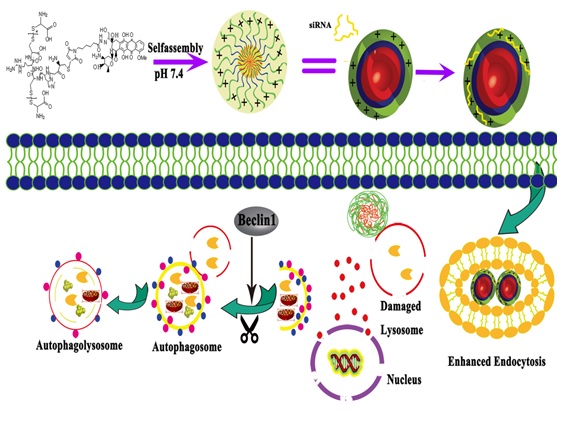
The DOX Conjugated DHRss polymer micelle (DOX-PMs) was prepared using the probe-based ultrasonication technique. DHRss (5 mg) was dissolved in 8 mL distilled water. Then, 2 mL dichloromethane was injected into the DHRss solution dropwise, followed by ultrasonication at 200W for 1 min in an ice bath using a probe-based sonicator (JY92-IIN, Xinzhi Scientific Co., Ltd., Ningbo, China). Then, the mixed solution was immediately stirred overnight at room temperature to eliminate dichloromethane. Finally, a Millipore (MW = 3000) was used to remove the monomer in the micellar dispersion (Fig. 1). DOX conjugated and si-Beclin1-loaded DHR polymer micelles (Co-PMs) were prepared by adding an appropriate amount of si-Beclin1 to DOX-PMs at N/P = 40, followed by vortexing for 30 s and incubated for 30 min at room temperature before use.
5.6 Complex characterization
5.6.1 Particle size, zeta potential and transmission microscopy (TEM)
The particle size and zeta potential of the DOX-PMs (1 mg/mL) and Co-PMs (N/P = 40, 2 µg/mL siBeclin1) were measured by dynamic light scattering (Zetasizer Nano ZS90, Malvern) at 25 ℃.Co-PMs morphology was examined using a transmission electron microscopy (TEM, Hitachi, Japan) using an acceleration voltage of 75 kV.
5.6.2 Agarose gel electrophoresis
The condensation ability of the complexes was determined by agarose gel electrophoresis. The complexes were prepared at different N/P ratios (0.25-20). After 30-min incubation, the complex (1 µg siBeclin1) was added to the pores of an acetic acid-EDTA buffer and TAE-containing 1% agarose gel. The gel was run at 100V for 30 min. The nucleic acid framework was irradiated under UV. The DNA release ability was evaluated by salt separation. Complexes with an N/P ratio of 20 were prepared and incubated in 25 nM DTT at 37 °C for 2 h. Samples were analyzed with agarose gel electrophoresis under the same conditions.
5.6.3 In vitro drug release study
The pH-dependence of the drug release behavior of the Co-PMs was shown using a GloMax-Multi Jr Single Tube Mutiode Reader. To examine the pH-dependent dye release, 10% Co-PMs solution was treated with solutions of disodium hydrogen phosphate citrate buffer at different pHs (pH 5.5, and pH 7.4). The amount of DOX-EMCH released at each time point was determined by fluorescence detector analysis.
5.7 Cellular uptake assay
si-Beclin1 and DOX uptake by PC-3 cells was analyzed using flow cytometry. PC3 cells were seeded into 12-well plates at 3 × 10⁵ cells per well and incubated for 24 h at 37℃ in 5% CO2. To determine the cellular uptake of si-Beclin1 by Co-MPs, FAM-labeled si-Beclin1(FAM-si-Beclin1) was complexed with DOX-MPs at N/P of 10, 20, 40 and 80 to obtain Co-MPs and incubated for 30 min. For DOX uptake, DOX solution and DOX-MPs were added to PC3 cells, with a final DOX concentration of 0.5 µg/mL, 1 µg/mL and 2 µg/mL. After 4-h incubation, cells were washed, trypsinized, centrifuged, re-suspended in 300 µl PBS, and finally analyzed on a FACScan flow cytometer (Becton Dickinson, SanJose, CA, USA). The experiment was repeated 3 times.
For confocal laser scanning microscopy (CLSM), PC3 cells were seeded into glass-bottom 24-well plates at a density of 1 × 10⁵cells per well and incubated for 24 h. After replacing the culture medium, the free DOX solution, DOX-MPs, Co-MPs were added to PC3 cells with a final FAM-1-si-Beclin1 concentration of 100 nM and a final DOX concentration of 0.5 µg/mL. After 4-h incubation, the medium was discarded, the cells were fixed using 4% paraformaldehyde and treated with 4,6-diamidino-2-pheylinole dihydrochoride to stain the nucleus. Then, the cells were washed, sealed with mounting medium, and imaged using a CLSM.
5.8 Autophagy observation
5.8.1 Flow cytometry
PC3 cells were seeded into glass-bottom 12-well plates at a density of 3 × 10⁵cells per well and incubated for 24 h. After replacing the culture medium, the si-Beclin1, free DOX solution, DOX-MPs, Co-MPs were added to PC3 cells with a final si-Beclin1 concentration of 100 nM and a final DOX concentration of 0.5 µg/mL and incubated for 24 h. After removal of the culture medium, cells were washed twice with PBS and trypsinized. Added 1 mL of the autophagosome detection reagent working solution to each well, and incubated the cells at 37℃ with 5% CO2 for 30 min. Then, washed the cells with the Wash Buffer 3 times, and re-suspended in 300 µl PBS, and finally analyzed on a FACScan flow cytometer (Becton Dickinson, SanJose, CA, USA). The autophagosome fluorescence intensity of measurement was λex = 360/λem = 520 nm. The experiment was repeated 3 times.
5.8.2 CLSM observation
PC3 cells were transiently transfected with mRFP-EGFP-LC3 plasmid using Lipofectamine 2000 (Invitrogen, USA). After 24-h incubation, PC3 cells were treated with si-Beclin1, DOX, DOX-MPs and CO-MPs for another 24 h. Then, the mRFP-EGFP-LC3 punctate structures were observed using a confocal laser scanning microscope (Olympus, Japan).The experiment was repeated for 3 times, and more than 50 cells were calculated. The number of mREF-EGFP -LC3 punctates per cell was counted.
5.8.3 TEM
PC3 cells were seeded into glass-bottom 6-well plates at a density of 5 × 10⁵cells per well and incubated for 24 h. After replacing the culture medium, the si-Beclin1, free DOX solution, DOX-MPs, Co-MPs were added to PC3 cells with a final si-Beclin1 concentration of 100 nM and a final DOX concentration of 0.5 µg/mL and incubated for 24 h. Then, cells were washed, trypsinized, centrifuged, and re-suspended in pro-cooling fixed liquid using a 1.5 mL tip centrifuge tubes, fixed 4–6 h at 4℃, dehydrated in increasing concentrations of ethanol and acetone, embedded in Araldite, sliced into (5–7 nanometers) sections, post-stained with uranyl acetate and lead citrate, and finally examined under a Hitachi H7650 transmission electron microscope.
5.8.4 Quantitative real-time PCR
The level of beclin1 mRNA was analyzed by reverse transcription-PCR (qRT-PCR). PC3 cells were seeded into glass-bottom 6-well plates at a density of 5 × 10⁵cells per well and incubated for 24 h. After replacing the culture medium, the si-Beclin1, free DOX solution, DOX-MPs, Co-MPs were added to PC3 cells with a final si-Beclin1 concentration of 100 nM and a final DOX concentration of 0.5 µg/mL and incubated for 24 h. Total RNA was extracted with Trizol (Invitrogen, USA) following the protocol of the manufacture. qRT-PCR analysis was performed using Applied Biosystems 7300(Thermo Fisher, USA). All data were analyzed using GAPDH as an internal standard. Primer sequences used were as follows: LC3 (forward: 5’-GTCCTGGACAAGACCAAGTTTT-3’, reverse: 5’-AGGCGTAGACCATATAGAGGAAG-3’). GAPDH (forward: 5’- ACTTTGGTATCGTGGAAGGACTCAT-3’, reverse: 5’-GTTTTTCTAGACGGCAGGTCAGG-3’.
5.8.5 Western Blot assay
PC3 cells were seeded in 6-well plates at a density of 5 × 10⁵ cells per well, and incubated for 24 h. The cells were treated with different groups for 24 h, and subsequently harvested and resuspended with RIPA lysis buffer, followed by 30-min incubation on ice. Then, the protein sample was collected. An equal amount of protein was denatured by boiling for 5 min, separated by SDS-PAGE, transferred onto PVDF membrane (Millipore, USA), and blocked using 5% nonfat dried milk at RT for 1 h, then probed with antibodies P62, Beclin1, LC3. Bands were quantified by Image J software.
5.9 Cytotoxicity assay
To evaluate the cytotoxicity of DOX and si-Beclin1, a CCK-8 assay was performed. Briefly, PC3 cells were seeded into 96-well plates at a density of 1 × 10⁴ cells per well, and incubated for 24 h. The medium was then replaced with fresh culture medium containing various concentrations of the polymer. Cells without treatment were used as a control. After 24-h and 48-h incubation, fresh medium containing a 10% CCK-8 solution was added. The absorbance of each well was measured at 450 nm using a microplate reader (Thermo Fisher Scientific, Waltham, MA, USA). The absorbance of the untreated cells was set at 100%, and cell viability was expressed as the percentage relative to the absorbance of the untreated cells. The experiment was repeated three times.
5.10 Cell apoptosis
To determine the effect of Co-MPs on cell apoptosis, PC3 cells were seeded into 12-well plates (3 × 10⁵ cells/well) and treated with si-Beclin1, DOX, DOX-MPs and Co-MPs (0.5 µ/mL DOX and 100 nM si-Beclin1) for 48 h. Cells without treatment were used as control. For the quantitative measurement of apoptosis, cells were harvested, washed twice with ice-cold PBS and then stained with Annexin V-FITC and PT for 15 min at room temperature in the dark. The apoptosis was analyzed by flow cytometry(FACSCalibur; BD Biosciences, UK)
5.11 Biodistribution and in vivo anti-tumor effect
The fluorescence of DOX was used to investigate the distribution of micelles in vivo. The absorbance of DOX was measured at 488 nm. A subcutaneous tumor model was generated by injection of 0.1 mL of PC3 cells suspension(1 × 10⁶) into the right axilla of nude mice. The tumors were allowed to grow to approximately 100 m3 before the experiment. To determine the tissue distribution of DOX, 18 female nude mice bearing PC3 prostatic cancer were equally randomized to three groups and injected with DOX and DOX-MPs (5 mg/kg). The mice were sacrificed 24 h later to excise the heart, liver, spleen, lung, kidney and the tumor. The excised organs and tumors were washed with cold saline and imaged using the FX Pro in vivo imaging system (Carestream Health, USA).
An in vivo anti-tumor effect assay was carried out as follows: 30 mice bearing visible PC3 tumors were equally randomized into saline, si-Beclin1, DOX, DOX-MPs and Co-MPs groups. The mice were intravenously administered with the respective formulation daily for three days at a dose of 5 mg/kg DOX and 2 mg/kg si-Beclin1. The body weight and tumor volumes ([major axis]×[minor axis]2/2, measured by calipers) were monitored and recorded twice per week for 21 days. Then, the mice were sacrificed, and their tumors were excised, weighed and photographed. Tumor volume(V) was calculated as: V = A × B2/2.
5. 12 Tunel And Immunohistochemical Analysis
Paraffin-embedded tumor tissue sections (5 µm) were subjected to TUNEL analysis, and immunohistochemistry according to standard protocols provided by the manufacturers. Apoptotic signals in tissue sections were visualized by microscopy. Immunohistochemical analyses of LC3II/I, Ki67 and Paxillin were performed. Briefly, sections were permeabilized with incubated with the LC3, Ki67 or Paxillin antibody(Cell Signaling Technology, Danvers, MA) overnight at 4℃. After washing with PBS, samples were incubated with HRP-conjugated secondary antibody (Cell Signaling Technology, Danvers, MA). LC3, Ki67 and TUNEL-postive cells were captured with a Nikon E-800 M microscope (Tokyo, Japan).
5. 13 Histologic Analysis
After the nude mice were sacrificed, hearts, livers, spleen, lung and kidney were collected and fixed in 4% paraformaldehyde for 24 h and subsequently embedded in paraffin. Tissue sections (5μm) were subjected to H&E staining.
5.14 in vivo TEM: the tumor tissues sections (2-3mm) were subjected to observe autophagy by transmission electron microscopy. Briefly, tissues were collected and fixed with 2% glutaraldenhyde solution immediately, and fixed overnight at 4℃, dehydrated in increasing concentrations of ethanol and acetone, embedded in Araldite, sliced into (5-7 nanometers) sections, post-stained with uranyl acetate and lead citrate, and finally examined under a Hitachi H7650 transmission electron microscope.
5.15 Statistical analysis
All values are presented as the mean±SD. Each value is the mean of at least three repetitive experiments in each group. The statistical significance was determined using Student’s t-test. The differences were considered significant for *p<0.05.