5.1. Plasmid preparation
Plasmids pcDNA3.1-PGRMC1-HA (wild type: WT), pcDNA3.1-PGRMC1-HA_Y180F (Y180F), pcDNA3.1-PGRMC1-HA_S57A/S181A (double mutant, DM) and pcDNA3.1-PGRMC1-HA_Y180F (Y180F) [24] have been described. The triple mutant S57A/Y180F/S181 (TM) was constructed by Genscript (Honk Kong) using the DM plasmid as the template and introducing codon TTC for F180. PGRMC1-HA open reading frames were reconfirmed by DNA sequencing at Monash Micromon DNA Sequencing Facility (Clayton, Vic., Australia) using the 5ꞌ T7 and 3ꞌ BGH sequencing primers specific for the parental vector. PGRMC1-HA plasmids were transformed into Escherichia coli Top10 strain, and cultured overnight at 37°C on 1% agar plates containing Luria broth (LB) media (Invitrogen) and 50 μg/mL ampicillin. A single colony was picked and bacteria were grown in 250 ml culture by aeration overnight at 37°C in LB media. Plasmid DNA was isolated by GeneJet Maxiprep Kit (ThermoScientific) following the manufacturer’s protocol. Plasmid DNA concentration was measured by using Nanodrop (Thermo Scientific).
5.2. Cell culture
MIA PaCa-2 (MP) cell identity was verified as MIA PaCa-2 (ATCC CRL-1420) by the MHTP Medical Genomics Facility (Monash University, Melbourne) following the ATCC Standards Development Organization document ASN-0002 for cell line identification via short tandem repeat profiling. MP cells were maintained in Dulbecco's Modified Eagle's medium (DMEM-high glucose, Sigma-Aldrich, D5796) supplemented with 10% Foetal bovine calf serum (Sigma-Aldrich, F9423) and 1% penicillin-streptomycin (Sigma-Aldrich, P4333) (complete DMEM) at 37°C and 5% CO2 in a 150i CO2 incubator (Heracell, Lane Cove NSW). Cell doubling times were estimated by 3-(4,5-dimethylthiazolyl-2)-2,5-diphenyltetrazolium bromide (MTT) assay or by IncuCyte, as described [79]. Mitochondrial respiratory capacity was measured using a Seahorse Extracellular Flux analyzer XF24 (Seahorse Biosciences).
5.3. Transfection and stable cell line generation:
Under our culture conditions, MP cells exist in culture as flattened adherent cells of mesenchymal shape, a minority of rounded adherent cells, and a small population of rounded suspension cells. Plating the suspension cells regenerates a similar population distribution (not shown). On the day before transfection, 2x10⁶ MP cells were seeded onto a 6-well plate. The cells were transfected at 70-80% confluency. Before transfection, cells were washed with Dulbecco's phosphate-buffered saline (PBS, Sigma-Aldrich, D8537) and maintained in antibiotic-free Dulbecco's Modified eagle Medium high glucose (DMEM, Sigma-Aldrich, D5796) containing 10% bovine calf serum (Sigma-Aldrich, 12133C) and 1% penicillin/streptomycin (Sigma-Aldrich, P4458) (complete DMEM). In separate transfections, 4μg each of respective PGRMC1-HA plasmids (WT, DM or TM) and Lipofectamine 2000 (Life Technologies, 11668-019) were mixed at 1:2 ratio and incubated for 25 min at room temperature. The mixture was then added drop-wise to the wells of the culture plate. After 6 hours of incubation, cells were washed with PBS and cultured at 37°C and 5% CO2 in complete DMEM for 48 hours, after which cells were harvested and plated in three fold limiting dilution in complete DMEM containing 50 μg/ml Hygromycin B (EMD Millipore, 400052) in 96 well plates. Cells were cultured at 37°C and 5% CO2 for 2 weeks, with regular media changes containing complete DMEM with Hygromycin B every 3 days to select for stable integration events. Typically 8 independent stably transfected cell lines were expanded for each of PGRMC1-HA WT, DM and TM and 3 lines with similar levels of PGRMC1-HA expression were selected by Western blot.
Cells were frozen 0.5 – 1.0 mL at -80°C in Bambanker (Novachem, #306-14684) at 2x10⁶ cells/mL. Frozen cells were introduced back into culture by thawing at 37°C for 20 seconds followed by addition to 5 ml of complete media and low speed centrifugation at 180 x g for 3 mins at 25°C. Pelleted cells were resuspended in 6mL fresh complete media and seeded in 25 cm2 flasks.
Because of the dramatic effects observed, MP cells are included in our experiments as a literature reference point. MP differ from WT cells by not having undergone hygromycin selection, and by lack of overexpression of PGRMC1-HA. Therefore we cannot ascribe differences between MP and WT cells to PGRMC1-HA expression. The effects of the DM and TM PGRMC1 mutations are assessed relative to WT control levels.
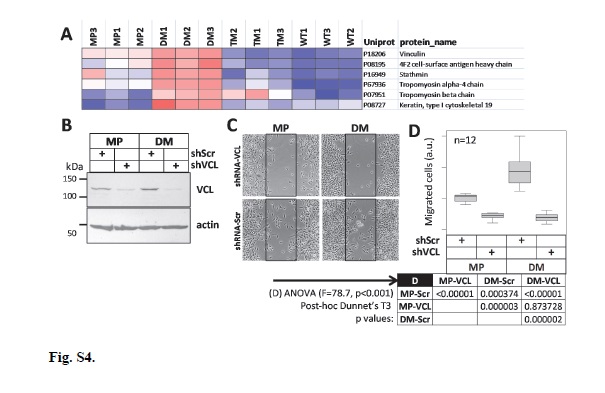
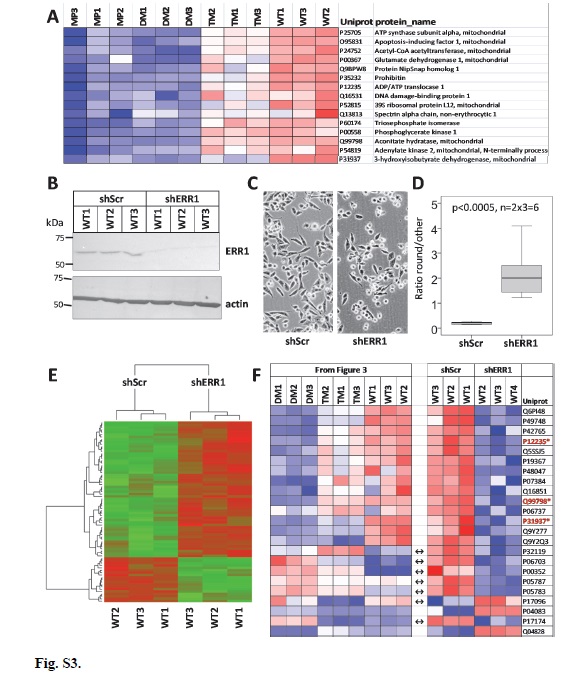
5.4. shRNA lentiviral production
Lentiviral-delivered shRNAs were constructed using Mission TRC2-pLKO-Puro series lentiplasmids (SHCLND, Sigma-Aldrich) targeting ERR1/ESRRA (TRCN0000330191, GAGAGGAGTATGTTCTACTAA), vinculin (shVCL) (TRCN0000290168, CGGTTGGTACTGCTAATAAAT) or non-target scrambled shRNA (shScr) (SHC202; CAACAAGATGAAGAGCACCAA). MP and DM shVCL cells were obtained at first attempt, however, despite three attempts, WT cells could not be established. To generate virus particles, we co-transfected HEK293 cells with the shRNA plasmids and helper plasmids using Lipofectamine 2000 (Invitrogen, 11668-027). Prior to transfection, 6 well plates were treated with 50µg/mL D-Lysine overnight. Next day, 1x10⁶ HEK293 cells were seeded per well and incubated overnight at 37°C in complete medium. Transfection mixture A contained 4 μg plasmid mixture consisting of 2.5 μg target or shScr shRNA lentiplasmid, 0.75 μg Pax, 0.3μg Rev and 0.45μg VSV-G helper plasmids [80] in 250 μL antibiotic-free medium. Transfection mixture B contained 8 μL Lipofectamine and 242 μL antibiotic-free medium. After 5 min incubation at 25°C, mixtures A and B were gently mixed and incubated for 25 min at 25°C. HEK293 culture medium was removed, cells were washed with PBS, and 2 mL fresh antibiotic-free medium was added followed by addition of combined transfection mixture to the cells, dropwise with gentle shaking, followed by incubation for 6 h at 37°C. After incubation, the medium was replaced with complete medium overnight at 37°C. Virus particles were harvested by collecting culture medium followed by the addition of new medium every 24 h for 72 h. Collected media for each culture were pooled, filtered through a 22 μM filter, aliquoted into 1 mL fractions, and frozen at -80°C.
5.5. shRNA lentiviral transduction
Briefly, 1x10⁵ MP, WT, or DM cells per 24 plate well were seeded in 1 mL complete DMEM medium and grown to 60% confluency. The medium was removed, and replaced by 1 mL of medium per well, containing 2-fold serially diluted virus particles in adjacent wells, plus 5µg/mL Polybrene (hexadimethrine bromide, Sigma-Aldrich 107689) to enhance viral transduction. After incubation for 24 hours, the medium was removed and the cells were washed twice with PBS after which fresh medium was added supplemented with 1.5 µg/mL Puromycin, which was replaced every 48 h for 1 week. Cells from wells transduced with the lowest dilutions of respective virus particles that survived selection were expanded, and stocks frozen at -80°C in Bambanker.
5.6. Scratch migration assay
MP cells or stable transfected monoclonal MP cell lines expressing PGRMC1-HA WT, DM or TM proteins (1x10⁴ cells) were seeded in a 24 well plate. The monolayer of cells at more than 90% confluency was subjected to serum starvation for 2 hours. A scratch was created in the middle of the monolayer by a sterile p200 tip and washed twice with PBS to remove floating cells. Complete media was then added. The cell monolayer was incubated for 36 hours to allow cell migration into the scratched area. Photographic images were taken at 0 and 36 hours using an inverted phase microscope (Nikon Eclipse Ti-U). Cells in the boxed areas of Fig. 2A were manually scored from printed images. Cell treatments included 125 nM Y-27632 dihydrochloride (Abcam, ab120129, Rho Kinase inhibitor: ROCKI) or vehicle control (DMSO). For video files the cells were incubated at 37°C and 5% CO2 for 36 hr in a stage top electrically heated chamber (Okolab H301-NIKON-NZ100/200/500-N) including transparent heated lid (H301-EC-HG-LID), with a 24-well Nunc/Greiner plate base adapter (24MW-NUNC) and a chamber riser, for a working distance of 28 mm. The chamber was regulated by a Control Unit (Okolab H301-TC1-HMTC) with Digital CO2 controller (Okolab DGT-CO2 BX) and Air Pump (Okolab, OKO-AP) and was inserted to a Nano-Z100-N Piezo stage (Mad City Labs) on a motorized XY stage (Nikon TI-S-ER). Images were taken every 10 minutes for 36 hours with a 10× (0.45 NA) Plan Apo objective using the transmitted light detector (TD) on a Nikon Ti Eclipse Confocal microscope controlled by NIS Elements V4.10 software (Nikon).
5.7. Proteomics sample preparation
Three independent stable transfected lines of each PGRMC1-HA-expressing cell type, as well as triplicates of the MP parental cell line, were measured in technical replicate data-dependent and independent data acquisition SWATH-MS modes on a 5600 TripleTof™ mass spectrometer (ABSciex). Global proteomics analysis was carried out at the Australian Proteome Analysis Facility (APAF). Cells were grown in Wagga Wagga to 80% confluency in 75 cm2 flasks. Three separate cultures of MP cells (passages 8, 9 & 11) and three lines of each PGRMC1-HA WT, DM and TM cells were used (independent biological triplicates). Cells were harvested and frozen cell pellets were shipped on dry ice to APAF for Mass spectrometric analysis. Cell pellets were lysed using 200 μL of sodium deoxycholate buffer (1% in 0.03M triethyl ammonium bicarbonate), and DNA digested using 0.5 μg of benzonase. Direct detect assay (EMD Millipore, DDAC00010-8P) was performed on the samples and 100 μg of each sample was taken for digestion. Samples were reduced with dithiothreitol (5 mM), alkylated with iodoacetamide (10 mM) and then digested with 4 μg trypsin for 16 hours at 37°C. The digested sample was acidified and centrifuged to remove the sodium deoxycholate. Samples were then dried and resuspended in 100 μL of loading buffer (2% acetonitrile 0.1% formic acid). Individual samples for SWATH analyses were diluted 1:4 into loading buffer and transferred to a vial. Each sample was measured in technical replicate. For IDA runs a pool was made for each group (MP, WT, DM, and TM) by taking equal portions from each biological replicate and diluting 1:4 in loading buffer.
5.8. Proteomic information dependent acquisition
Tryptic peptides were analyzed on a 5600 TripleTof™ mass spectrometer (ABSciex). Chromatographic separation of peptides was performed on a NanoLC-2Dplus HPLC system (Eksigent, Dublin, CA) coupled to a self-packed analytical column (Halo C18, 160Å, 2.7 μm, 75 μm x 10cm). Peptide samples (4 μg of total peptide amount) were loaded onto a peptide trap (Opti-trap Cap 0.5mm x 1.3mm, Optimize Technologies) for pre-concentration and desalted with 0.1% formic acid, 2% ACN, at 10 µL/min for 5 minutes. The peptide trap was then switched into line with the analytical column and peptides were eluted from the column using linear solvent gradients with steps, from 98% Buffer A (0.1% formic acid) and 2% Buffer B (99.9% acetonitrile, 0.1% formic acid) to 90% Buffer A and 10 % Buffer B for 10 minutes, then to 65% Buffer A and 35% Buffer B at 500 nL/min over a 78 min period. After peptide elution, the column was cleaned with 95% Buffer B for 15 minutes and then equilibrated with 98% Buffer A for 15 minutes before the next sample injection. The reverse phase nanoLC eluent was subject to positive ion nanoflow electrospray analysis in an IDA mode. Sample analysis order for LC/MS was DM1, DM2, DM2, DM3, DM3, MP2, MP2, MP3, MP3, TM2, TM2, TM3, TM3, WT1, WT1, WT2, WT2, WT3, WT3, DM1, MP1, MP1, TM1, TM1.
In the IDA mode a TOFMS survey scan was acquired (m/z 350 - 1500, 0.25 second), with the 10 most intense multiply charged ions (2+ - 5+; counts >150) in the survey scan sequentially subjected to MS/MS analysis. The selected precursors were then added to a dynamic exclusion list for 20s. MS/MS spectra were accumulated for 50 milliseconds in the mass range m/z 100 – 1500 with rolling collision energy.
5.9. Proteomic Data independent acquisition (SWATH)
Samples were analyzed by Sequential Window Acquisition of all Theoretical Mass Spectrometry (SWATH-MS) [81] proteomics profiling in duplicate, with the chromatographic conditions as for IDA analysis above. The reverse phase nanoLC eluent was subject to positive ion nanoflow electrospray analysis in a data independent acquisition mode (SWATH). For SWATH MS, m/z window sizes were determined based on precursor m/z frequencies (m/z 400 – 1250) in previous IDA data (SWATH variable window acquisition, 60 windows in total). In SWATH mode, first a TOFMS survey scan was acquired (m/z 350-1500, 0.05 sec) then the 60 predefined m/z ranges were sequentially subjected to MS/MS analysis. MS/MS spectra were accumulated for 96 milliseconds in the mass range m/z 350-1500 with rolling collision energy optimized for lower m/z in m/z window +10%. To minimize instrument condition caused bias, SWATH data were acquired in random order for the samples with one blank run between every sample.
5.10. SWATH library generation
The LC-MS/MS data of the IDA data were searched using ProteinPilot (version 4.2) (Sciex) and combined into a single search report file. The files were searched against Human entries in the Swissprot 2014_04 database (released 16/04/2015, containing 545,388 entries). The search parameters were selected as follows: iodoacetamide cysteine alkylation, trypsin digestion, Triple TOF 5600 instrumentation, biological modifications, thorough search and false discovery rate enabled.
5.11. SWATH data processing
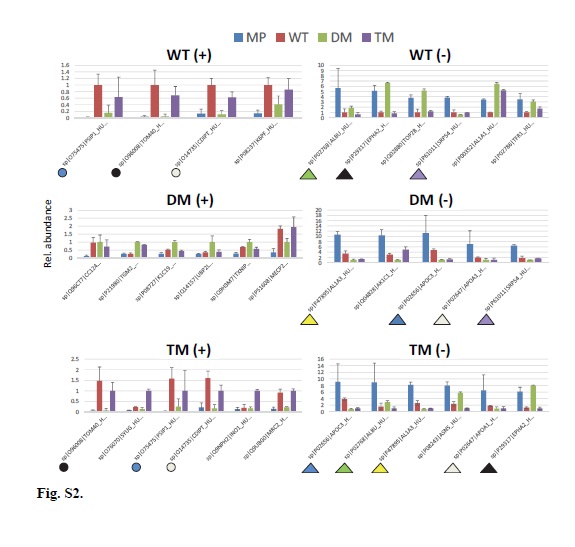
SWATH data were extracted using PeakView (version 2.1, Sciex) with the following parameters: Top 6 most intense fragments of each peptide were extracted from the SWATH data sets (75 ppm mass tolerance, 10 min retention time window). Shared peptides were excluded. After data processing, peptides (max 50 peptides per protein) with confidence ≥ 99% and FDR ≤1% (based on chromatographic feature after fragment extraction) were used for quantitation. The extracted SWATH protein peak areas were normalized to the total peak area for each run and subjected to t-test to compare relative protein peak area between the samples. Protein t-test with p-value smaller than 0.05 and fold change larger than 1.5 were highlighted as differentially expressed. The analysis of four different cell types was treated as six separate paired comparisons: 1) MP vs. WT, 2) MP vs. DM, 3) MP Vs. TM, 4) WT vs. DM, 5) WT vs. TM, and 6) DM vs. TM. Additionally, a similar method for determining differential expression was run at the peptide level, with the peptide level fold changes then averaged for each protein. The peptide level analysis is more conservative, as peptide level p-values are only generated when a protein was identified by at least two proteins. Peptide level data were used for this study.
5.12. WebGestalt enrichment analyses
Gene Ontology (GO) and pathway enrichment analysis were conducted on differentially abundant proteins from Figure S2D using the WEB-based GEne SeT AnaLysis Toolkit (WebGestalt) platform (http://bioinfo.vanderbilt.edu/webgestalt/) [82]. Figures or Supplementary Figures depicting or relying on WebGestalt results describe supplementary data files available online that contain the respective original WebGestalt analysis files. Attempting to identify the most important driving contributions to the phenotypic alterations observed, a complementary WebGestalt analysis was also performed at the adjP<0.001% level, but employing the subsets of proteins which were detected to be either significantly up- or down-regulated (“red” and “blue” lists of proteins for each comparison from File S1). The UniProt protein IDs from respective proteomics comparisons were uploaded as text files which accompany the respective WebGestalt supplementary data files. KEGG, Pathway Commons, and Wiki Pathways were analyzed at the 5% level. GO and transcription Factor analyses were also performed for comparisons of differentially up- or down-regulated proteins for each pair-wise comparison between cell types at the 0.1% and 10% levels. The following WebGestalt settings were employed: Organism: hsapiens; gene Id Type: entrezgene; Reference Set for Enrichment Analysis; entrezgene_protein-coding; Significance Level: (variable see individual analysis descriptions), Statistical Method: Hypergeometric, Multiple Test Adjustment: Benjamini-Hochberg (BH), Minimum Number of Genes for a Category: 3.
Pathway enrichment analyses can consider either a) all differential proteins together (including both up- and down-regulated proteins in the one analysis), or b) can examine the higher abundance and lower abundance proteins in separate analyses for each comparison (“red” or “blue” analyses for each comparison). Our WebGestalt pathway analysis strategy of Figure 3 pursued the second of these alternatives. In the first analysis, all proteins found to be differential (both up- and down-regulated) between two samples in any six of the analyses were entered as a protein list to WebGestalt, and pathway enrichment analysis was performed with multiple sample correction at the Benjamini and Hochberg (BH) adjusted p (adjP) significance level of 0.001 for KEGG, Pathway Commons, and Wikipathways for each of the six basic cell-type comparisons.
Twelve separate WebGestalt analyses were performed for Figure 3, with enrichment analyses including KEGG, PC, WikiPathways, as well as Transcription Factor and GO cellular component. The schematic representation of Figure 3 shows pathways identified as significantly enriched for at least one of 12 comparisons (6x more abundant “red” and 6x less abundant “blue”) between 1) MP vs. WT, 2) MP vs. DM, 3) MP vs. TM, 4) WT vs. DM, 5) WT vs. TM, and 6) DM vs. TM. The pathway mapping for all significantly detected features between all comparisons detected at adjP<0.001 is available as File S5A. Another WebGestalt analysis was performed at adjP<0.1 and the significances of each pathway identified in File S5A at the adjP<0.001 level were then recorded for all comparisons at the adjP<0.1 level in File S5B. The analysis results are presented for reference as File S4B. That information was used to assign statistical significance in the pathways map for all features that were identified at the adjP<0.001 level in any one comparison, across all 12 comparisons at the adjP<0.1 level. These data were then used to map all proteins from all pathways and all comparisons of File S5B to produce the original image of Figure 3 in Microsoft Excel, which is available as File S6 and contains all protein and pathway identities.
5.13. Mapping pathways to the expression heat map
The matrix of protein membership to pathway or functional group category is a resulting sparse matrix with 0/1 indicating that the respective protein is/is not present in the respective category. This matrix was clustered using the hclust implementation in the R Base Package (www.r-project.org/), using a binary distance and complete linkage, to reorder the columns (pathways in this case) according to the proportion of shared proteins. The resulting cladogram including overlapping features identified by all WebGestalt analyses appears to the right of pathways in Figure 3, and with complete accompanying protein and pathway identities in File S5.
5.14. Principal Components Analysis on Proteomics results
Principal component analysis was used to examine the largest contributions to variation in the protein measurements. Wilcoxon rank-sum tests were used to identify the pathways that were positively or negatively associated with the principal component scores.
5.15. Sample Preparation for Western blots
Approximately 70% confluent cells in a T75 flask were washed twice with chilled PBS buffer and incubated with 500 µL radio immunoprecipitation assay buffer (RIPA buffer) (Sigma-Aldrich, R0278) supplemented with protease and phosphatase inhibitor cocktail (Thermoscientific, 88668) following manufacturer’s recommendations. After scraping, the lysate was centrifuged at 8000g for 20 minutes (Hermle Centrifuge Z233 M-2) at 4°C. Protein concentration was determined using the Pierce BCA protein assay kit (ThermoFisher, 23225) following the manufacturer’s instructions. 20 µg cell lysates were each mixed with 2x Laemmli loading buffer (Sigma-Aldrich, S3401) at a 1:1 ratio to give final volume 20 μL, followed by denaturation at 95°C for 5 minutes in a digital dry bath heater. Lysates were loaded immediately to a 10% SDS-PAGE gel. For HA western we used 17 well gels (Life technologies, NW04127), for PGRMC1 Western blots we used 15 well gels (Bio Rad. 456-1069), for vinculin and ERR1 Western blots we used 10 well gels (Bio Rad 456-1096). Electrophoresis was at 150V for 45 min. Protein was transferred onto PVDF membranes (Bio-Rad, 1620174) with a Trans-Blot Turbo transfer system (Bio-Rad, Gladesville NSW) for 7 min by Trans-Blot® Turbo RTA Mini LF PVDF Transfer Kit (Bio-Rad, 1704274) or wet transferred in 25 mM Tris, 192 mM glycine, 20% (v/v) methanol (pH 8.3) (1x Towbin buffer) at 20V for 2.5 hours on mini trans-blot cell (Bio Rad, 1703930) cooled on ice.
5.16. Western blots
Membranes were blocked with TBS-T (0.1% Tween-20 in 1× Tris-buffered saline) containing 5% Woolworths Instant Skim Milk Powder (Woolworths, Wagga Wagga, NSW, Australia) for 1 hr and incubated overnight at 4ºC with primary (1°) antibody. After washing 3 times with TBS-T, blots were incubated with secondary (2°) antibody for 1 hr at room temperature. Proteins were detected by the following methods. For chemiluminescence detection the membranes were incubated with Clarity Max Western ECL Substrate (Bio-Rad, #1705062) for 5 min for detection by enhanced chemiluminescence using a Bio-Rad ChemiDoc MP imaging system (Bio-Rad, Gladesville NSW). Fluorescence detection was performed on the ChemiDoc (at the indicated wavelength). Molecular weight standard proteins for gels imaged for fluorescence or chemiluminescence were detected on the ChemiDoc using the IRDy680 channel. Colorimetric detection (Vinculin and ERR1 Western blots) was performed by incubation of membranes with 3 mL Tetramethylbenzidine (TMB) (Sigma-Aldrich, T0565) for 5 minutes. These images were captured by Molecular Imager Gel Doc XR+ System (Bio-Rad, Gladesville NSW). Multi-channel ChemiDoc images were generated with the Bio-Rad Image Lab Software. Some dual channels images were manipulated in Adobe Photoshop CC 2018 (Adobe Systems Inc.) by reducing intensity in either red or green channel to lower background in the published image. Adjustments were applied identically over all image pixels so as to not alter the relative intensities of any bands.
The following primary (1°) and secondary (2°) antibody pairs were used (at the specified dilutions) with the indicated detection methods. For PGRMC1 Western: 1° goat anti-PGRMC1 antibody (Abcam, ab48012) (1:1000) and 2° rabbit anti-goat secondary antibody (Abcam, ab6741) (1:4000) detected by chemiluminescence. After detection, membranes were blocked with TBS-T overnight and then incubated with 1° mouse anti-beta actin (Sigma-Aldrich, A5541) (1:2000) and 2° goat anti-mouse IgG H&L (IRDye 800CW) (1:5000) detected by fluorescence (IRDye 800CW). For HA epitope Western: 1° mouse anti-HA (Sigma-Aldrich, H3663) (1:2000) and 2° goat anti-mouse IgG H&L (IRDye 800CW) (dilution 1:5000) detected by fluorescence (IRDye 800CW), as well as 1° rabbit anti-beta-actin (Cell Signaling, 4967) (1:2000) and 2° donkey anti-rabbit IgG (Abcam, ab16284) (1:2000) detected by chemiluminescence. For vinculin Western: 1° anti-vinculin (E1E9V) XP (Cell Signaling Technology, 13901) (1:1000) and 2° donkey anti-rabbit IgG (Abcam, ab16284) (1:2000) detected colorimetrically. For ERR1 Western: 1° rabbit anti-ERRα (E1G1J) (Cell Signaling, 13826S) (1:1000) and 2° donkey anti-rabbit IgG (Abcam, ab16284) (1:2000) detected colorimetrically.
5.17. Reverse Phase Protein Array analysis
Reverse Phase Protein Arrays (RPPA) using Zeptosens technology (Bayer AG, Leverkusen, Germany) were used for analysis of signaling protein expression and activity profiling as described [83-86]. For the analysis, flash frozen cell pellets were lysed by incubation with 100 µl cell lysis buffer CLB1 (Bayer, Germany) for 30 minutes at room temperature. Total protein concentrations of the lysate supernatants were determined by Bradford Assay (Coomassie Plus, Thermo Scientific). Cell lysate samples were adjusted to uniform protein concentration in CLB1, diluted 10-fold in RPPA spotting buffer CSBL1 (Bayer) and subsequently printed as series of four dilutions (starting concentration at 0.3 µg/µl plus 1.6-fold dilutions) and in two replicates each. All samples were printed as replicate microarrays onto Zeptosens hydrophobic chips (Bayer) using a NanoPlotter 2 (GeSim, Grosserkmannsdorf, Germany) applying single droplet depositions (0.4 nL volume per spot). After printing, the microarrays were blocked with 3% w/v albumin, washed thoroughly with double distilled H2O, dried in a stream of nitrogen and stored in the dark at 4°C until further use.
Protein expression and activity levels were measured using a direct two-step sequential immunoassay and sensitive, quantitative fluorescence read-out. A single array was probed for each protein. Highly specific and upfront validated primary antibodies were incubated at the respective dilution in Zeptosens assay buffer overnight (15 hours) at room temperature. Arrays were washed once in assay buffer and incubated for 45 minutes with Alexa647-labeled anti-species secondary antibody (Invitrogen, Paisley, UK). Arrays were then washed as before and imaged using a ZeptoREADER instrument (Bayer) in the red laser channel. Typically, six fluorescence images were recorded for each array at exposure times of between 0.5 and 16 seconds. Negative control assays incubated in the absence of primary antibody (blank assays) were also performed to measure the non-specific signal contributions of the secondary antibody. In addition, one chip out of the print series was stained to measure the relative amount of immobilized protein per spot (protein stain assay). The following primary antibodies (provider and reagent number, dilution) were used: Bad (CST 9239, 1:200), Bad-P-Ser112 (CST 5284, 1:100), Bad-P-Ser136 (CST 4366, 1:100), FAK1-P-Tyr577 (Invitrogen 44-614ZG, 1:100), FAK1-P-Tyr861 (Epitomics 2153-1, 1:100), GSK3beta (CST 9315, 1:200), GSK3beta-P-Ser9 (CST 9336, 1:100), HSF1 (Epitomics 2043-1, 1:1000).
After assay measurements (one protein per array), array images and data were analyzed with the software ZeptoVIEW 3.1 (Bayer). For each array/antibody, the image taken at the longest exposure time without showing any saturation effect was analyzed with the spot diameters set to 160 µm. Mean fluorescence signal intensity (MFI) of each sample was calculated from referenced, background-corrected mean intensities of the single spots (eight spots per sample) applying a linear fit and interpolating to the mean of the four printed protein concentrations. Blank-corrected MFI signals of the samples were normalized for the relative protein concentration printed on the chip to obtain normalized fluorescence intensity signals (NFI). NFI values were used for all subsequent statistical analyses.
5.18. Glucose uptake & Lactate production assay
Glucose uptake and lactate production assays were performed by using commercially available kits from Cayman chemical (#600470, #700510) following manufacturer’s protocols. Glucose uptake was measured with a Fluostar Omega fluorescence microplate reader (BMG Labtech, Ortenberg, Germany) and lactate production was quantified with a Molecular Devices Spectra Max 190 microplate reader (Bio-Strategy P/L, Campbellfield, Vic., Australia).
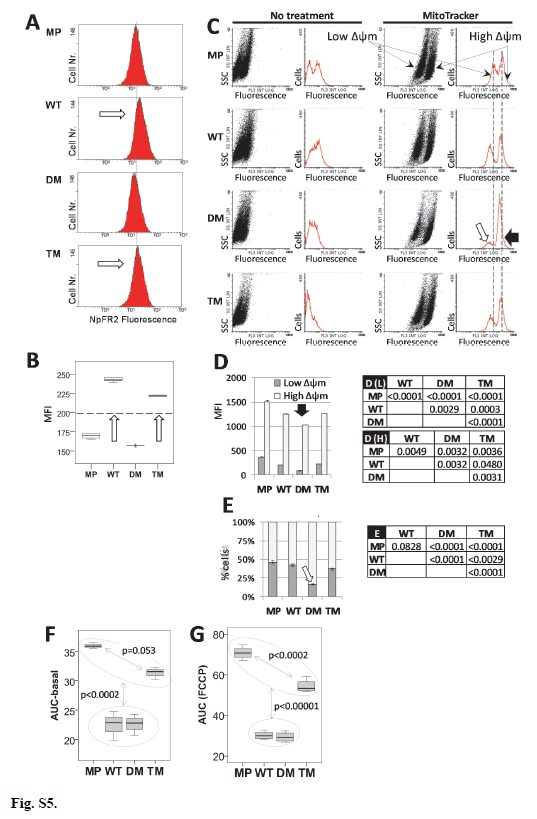
5.19. NpFR2 redox assay
Intramitochondrial redox status was measured by naphthalimide flavin redox sensor 2 (NpFR2) [48]. Mia PaCa-2 and PGRMC1-HA-expressing stable cells (1x 10⁶) were suspended in 2 mL complete media and seeded in six well plates and cultured for 24 hr at 37ºC and 5% CO2. Cells were washed with PBS, trypsinsed, harvested, and resuspended in 1 mL of fresh media containing 25μM NpFR2 in a 1.5 mL microcentrifuge tube, followed by incubation for 20 min at 37ºC. Cells were then centrifuged in a microcentrifuge at 180 x g, the pellet was resuspended once with 1 mL PBS followed by recentrifugation, and the washed pellet was again resuspended in 1 mL PBS. 500 μL cell suspension was loaded to a Gallios Flow Cytometer (Beckman Coulter) and fluorescence of 2x10⁴ cells was detected using FL1 (green) channel.
5.20. Immunofluorescence microscopy
To detect the expression of exogenous HA tagged PGRMC1 in Fig. 1E, cells were seeded on coverslips on a six well plate. The cells were washed with ice-cold PBS, mildly fixed with 3.7% formaldehyde for 5 minutes at 4ºC. The cells were then permeabilized with ice-cold 100% methanol for 10 minutes at -20ºC, followed by overnight incubation with anti-HA tag antibody (Sigma, H3663). The cells were washed extensively and incubated with FITC conjugated secondary antibody (Sigma, F8521) in dark for 1 hour at 4ºC. Cells were washed three times with PBS and counterstained with DAPI mounting solution. Images were captured using a Nikon Ti Eclipse Confocal microscope (Nikon Australia Pty Ltd).
5.21. Analysis of mitochondrial morphology
Mitochondria were quantified for cell shape (elongated/round), mitochondrial content (sum of mitochondrial area/cell), mitochondrial size (average perimeter/cell), and mitochondrial morphology or Formfactor (FF): a measure where higher values correspond to a greater level of filamentous mitochondria and lower values correspond to more highly fragmented mitochondria [52]. Formfactor (calculated as the P2/4πA) measures mitochondrial morphology based on the perimeter and area of shape. The calculation takes in to account not only changes in length, but also the degree of branching, making at an ideal form of measurement for the quantification of mitochondrial morphology.
To measure form factor, 1x10⁵ cells were seeded onto Nunc 176740 four well plates with a 22x22mm #1.5 glass coverslip on the bottom. Cells were fixed and permeabilized as above, then incubated with Abcam mouse anti-mitochondrial IgG1 antibody (Abcam ab3298) and then with FITC-conjugated goat anti-mouse secondary antibody (Sigma-Aldrich F4018) and DAPI, followed phalloidin red staining and imaged with 3D-Structured Illumination Microscopy (SIM) on a DeltaVisionOMX Blaze microscope as described [87]. Images were processed using Fiji/ImageJ software [88], and Area and Perimeter values were extracted to calculate form factor. Cell morphology was scored as either ‘round’ or ‘elongated’ by JCC as part of the mitochondrial quantification process.
5.22. Holo-tomographic imaging
Holo-tomographic video imaging was performed on a NanoLive (Switzerland) 3D Cell Explorer fluo (AXT Pty Ltd, Warriewood, NSW) equipped with a NanoLive live cell incubator (AXT Pty Ltd). 1x10⁴ cells were seeded into a FluoroDish cell culture dish 35mm, 23mm well (World Precision Instruments, FD35) and maintained in phenol red free DMEM medium (Sigma-Aldrich, D1145) supplemented with 10% fetal bovine calf serum (Sigma-Aldrich, F9423), 2 mM glutamine (Sigma-Aldrich, G7513) and 1% penicillin-streptomycin for 48 hours. Immediately prior to imaging the medium was removed and replaced with 400 μL of the same medium, followed by transfer to the live cell incubator chamber of the 3D Cell Explorer. Cells were incubated at 37°C, 5% CO2 and 100% humidity for the duration of the time-lapse. Three dimensional holo-tomographic images were captured every 20 seconds for the duration of the time-lapse using the Nanolive STEVE software. For File S7 the center plane of each 96 slice stack was exported after capture using the built in STEVE export wizard as an .avi movie file. These files were exported at 5 frames per second (100x actual speed) to visualize cellular dynamics.
5.23. Subcutaneous mouse xenograft tumors
Animal experiments and welfare conformed to the Australian National Health and Medical Research Council guidelines and institutional ethics approval from the Animal Ethics Committee at the Australian National University (E2017/16) and Charles Sturt University Animal Care and Ethics Committee (A17046). NOD/Shi-SCID/IL-2Rγnull (NSG) mice were bred and supplied by the Australian Phenomics Facility at the Australian National University (ANU), an Australian academic center funded by the Australian Government’s National Collaborative Research Infrastructure Strategy (NCRS) program, and contributions from ANU. Experiments were performed in the John Curtin School of Medical Research satellite animal facility. Animals were housed in individually ventilated cages with access to food and water ad libitum, enriched with corn cob bedding and a maximum of 5 mice per cage. Animals were injected in four cohorts randomized by weight, and the number of mice per cohort was based on availability. Mice were injected with independently generated cell lines MP, WT1-WT3, DM1-DM3, TM1-TM-3, and Y180F. Cells were expanded in culture for a maximum of 2 weeks before injection. Cells were trypsinized, pelleted, washed with PBS and stored on ice. Cell count was determined using a hemocytometer and trypan blue. Two million cells were resuspended in 100 µL 50:50 Matrigel:PBS for sub-cutaneous injection into the left flank of female NSG mice (8-12 weeks) via a 27-gauge needle. The total number of mice injected per cell line was based on the replicate coefficient of variation (CV) for solid tumour models evaluating disease burden = 10%, CV being the measure of spread that describes the amount of variability relative to the mean. A t-test-based statistical analysis of simulated differences in mean tumour progression shows that a minimal number of replicates of n = 10 is necessary to identify a greater than or equal to 20% change between replicate groups at a pre-determined statistical significance level of 5%. However this was refined in order to reduce animal usage where possible according to the NHMRC Australian code for the care and use of animals for scientific purposes. For cohort 1 four animals each were injected with MP, WT1, DM1, and TM1. For cohort 2 four animals each were injected with WT2, DM2 and TM2, and one animal with MP. For cohort 3 four animals each were injected with WT3, DM3 and TM3, one animal with MP. For cohort 4 five animals were injected with Y180F cells, and one animal with each of MP, WT1, DM1, and TM1. Injection of each cohort commenced mid-morning. Mice were monitored daily and once the tumor was palpable (~2.5 -4 weeks), tumor growth was measured 3 times a week using calipers until at least one tumor in the cohort reached 1 cm3 in volume. Once any animal in any group in the cohort reached the maximum size of tumor all animals were euthanized for tissue recovery by cervical dislocation and tumors were harvested, weighed, photographed, and fixed with formalin.
5.24. Statistical Analyses
Unless specified otherwise, statistical analysis was performed using the SPSS package (IBM). Results for WT, DM and TM cells represent equal numbers of three independently derived cell lines for each PGRMC1 condition (e.g. n=6 for WT includes 2x WT1, 2xWT2, and 2xWT3). For boxplot data depictions, whiskers represent quartiles 1 and 4 (with maximum and minimum values). Boxes represent quartiles 2 and 3, separated by the median, as generated by SPSS analyze data function. Datasets conforming with normal distribution were analyzed by ANOVA and post-hoc Bonferroni or Tukey HSD test (equal variance) or post-hoc Dunnett’s T3 Test (unequal variance). Statistical differences between divergent treatments of different cell lines were calculated using two way ANOVA and post-hoc pairwise comparisons. For non-parametric data sets Kruskal-Wallis or Kolmogorov-Smirnov tests were performed, as indicated in relevant figure legends.