Identification of PTR gene in cultivated rice
Among the 27 Oryza species, Asian cultivated rice (Oryza sativa L.) and African cultivated rice (Oryza glaberrima Steud.) are the two species that have been domesticated and utilized by humans [24]. Using the conserved region sequence of PTR gene family, 96 PTR genes were identified in Nipponbare (Oryza sativa L. ssp. japonica) (Table S2), 85 were identified in R498 (Oryza sativa L. ssp. indica) (Table S3), and 78 were identified in Oryza glaberrima (Table S4).
Phylogenetic analysis of PTR genes
Multi-sequence alignment and phylogenetic analysis were performed on the protein sequences of 96 rice PTR genes using MEGA. Based on the evolutionary relationship, the 96 PTR genes were classified into 5 groups, and groupⅠto V contained 20, 15, 26, 4 and 31 genes, respectively. The group V contained the most genes, which could be further classified into four subgroups, Va (3), Vb (4), Vc (8), and Vd (16) (Fig. 1).
To understand the evolutionary relationship of PTR genes between different Oryza species or subspecies, phylogenetic analysis was carried out using the PTR genes from Nipponbare, R498 and Oryza glaberrima. These PTR genes could be classified into 8 groups: group Ⅱ contained 73 genes, which was the most, whereas group Ⅶ had only 11 genes (Fig. 2a). The distribution of PTR genes in the 8 groups were similar among the three Oryza species (Table S5). Nipponbare genome was used for the further analysis as shown below.
Leguminous plants can form a symbiotic relationship with N-fixing bacteria, which can convert N2 in the air into NH3. Thus, we analyzed the leguminous plants peanuts and soybeans. We also analyzed the dicotyledonous plant Arabidopsis, and the important monocotyledonous plants maize, sorghum and rice. The plant genome sizes of these six species were 2.5 Gb [25], 1.1 Gb [26], 125 Mb [27], 2.3 Gb [28], 730 Mb [29] and 466 Mb [30], respectively. Although the maize genome was large, it only contained 66 PTR genes, whereas the legume genome contained many more PTR genes: 125 for peanuts and 117 for soybeans. This might be related to the need of N transport after N fixation in legumes.
The phylogenetic tree was constructed based on the protein sequences of 543 PTR genes from the six species (Table S6), and these genes could be classified into 4 groups, Ⅰ,Ⅱ,Ⅲ and Ⅳ (Fig. 2b). The PTR gene distribution in rice, maize and sorghum were similar, and group Ⅲ contained the most monocots PTR genes. Similarly, the PTR gene distribution in peanut, soybean and Arabidopsis were similar, and group Ⅳ had the most dicots PTR genes.
The chromosome location and segmental duplication events of rice PTR genes
The 96 PTR genes were unevenly distributed on 12 chromosomes in rice. Chromosome 1 had the most PTR genes and chromosome 9 contained the least. The details are shown in Fig. 3. 59 PTR genes, accounting for 60.4% of the total PTR genes, formed 17 gene clusters. Except chromosome 7, 8, and 9, all other chromosomes contained PTR gene clusters, and the cluster in 37.79-37.83 Mb region of chromosome 1 was the biggest, containing 9 PTR genes.
The segmental duplication events were analyzed using the 96 PTR genes. The results showed that there were 5 large genomic duplication regions, which contained 25 PTR gens: (i) 37.76 Mb -38.75 Mb on chromosome 1 corresponding to 20.31 Mb -21.21 Mb on chromosome 5; (ii) 27.74 Mb -28.95 Mb on chromosome 2 corresponding to 29.11 Mb -30.42 Mb on chromosome 4; (iii) 0.15 Mb -0.21 Mb on chromosome 3 corresponding to 21.76 Mb - 21.90 Mb on chromosome 10; (iv) 33.56 Mb -33.92 Mb on chromosome 3 corresponding to 5.31 Mb -6.14 Mb on chromosome 7; (v) 19.49 Mb -19.744 Mb on chromosome 8 corresponding to 12.13 Mb -12.45 Mb on chromosome 9 (Table 1).
Whole genome duplications were detected using the synonymous mutation rate Ks. The rice genome experienced three genome duplication events (Fig. 4). The whole genome duplicationevent shared by gramineous plants occurred at ~96 million years ago [31]. After that, another two independent genomic duplications events occurred in rice [32,33]. The Ka/Ks ratio reflects the extent to which all nucleotide sequences of a gene are positively selected during differentiation. If Ka/Ks is greater than 1, the gene is positively selected; if Ka/Ks is equal to 1, the gene is neutrally seleceted; if Ka/Ks is less than 1, the gene undergoes purify selection. The Ka/Ks ratios of paralogous PTR gene pairs were 0.08-1.83, and 693 gene pairs were greater than 1, indicating that many PTR genes underwent positive selection (Table S7, Fig. 5).
Gene structure and motif composition of rice PTR genes
The information related to the evolution of the gene family can be obtained from gene structure analysis. Thus, we performed a gene structural analysis on the 96 PTR genes (Fig. 6a). In terms of the intron-exon composition, the PTR genes had 0-11 introns and 1-12 exons, and 10 genes contained only 1 exon. Usually, the structurally similar genes have closer evolutionary relationship.
Previous studies have shown that there are three highly conserved domains in most PTR genes [34]. In this study, there were five types of conserved domains in rice PTR genes, which were MFS, RNase_H_like, zf-RV, RT_like superfamily, and PBD. MFS can be further classified into MFS superfamily, MFS_NPF, MFS_NPF1_2, MFS_spinster_like, MFS_NPF5, MFS_NPF7, and MFS_NPF4. By performing conserved gene analysis on PTR genes, we found 77 genes had MFS superfamily domain and 16 genes contained NPF domain (Fig. 6b).
The expression profiles of PTR genes in near isogenic lines
The expression profile of a gene is often related to its function. Previous studies have shown that the proteins encoded by PTR genes can transport nitrate, playing an important role in plant growth and development. Therefore, we used RNA-Seq to analyze the expression profiles of 96 PTR genes in the near-isogenic rice lines NIL15 and NIL19 under HN and LN conditions.
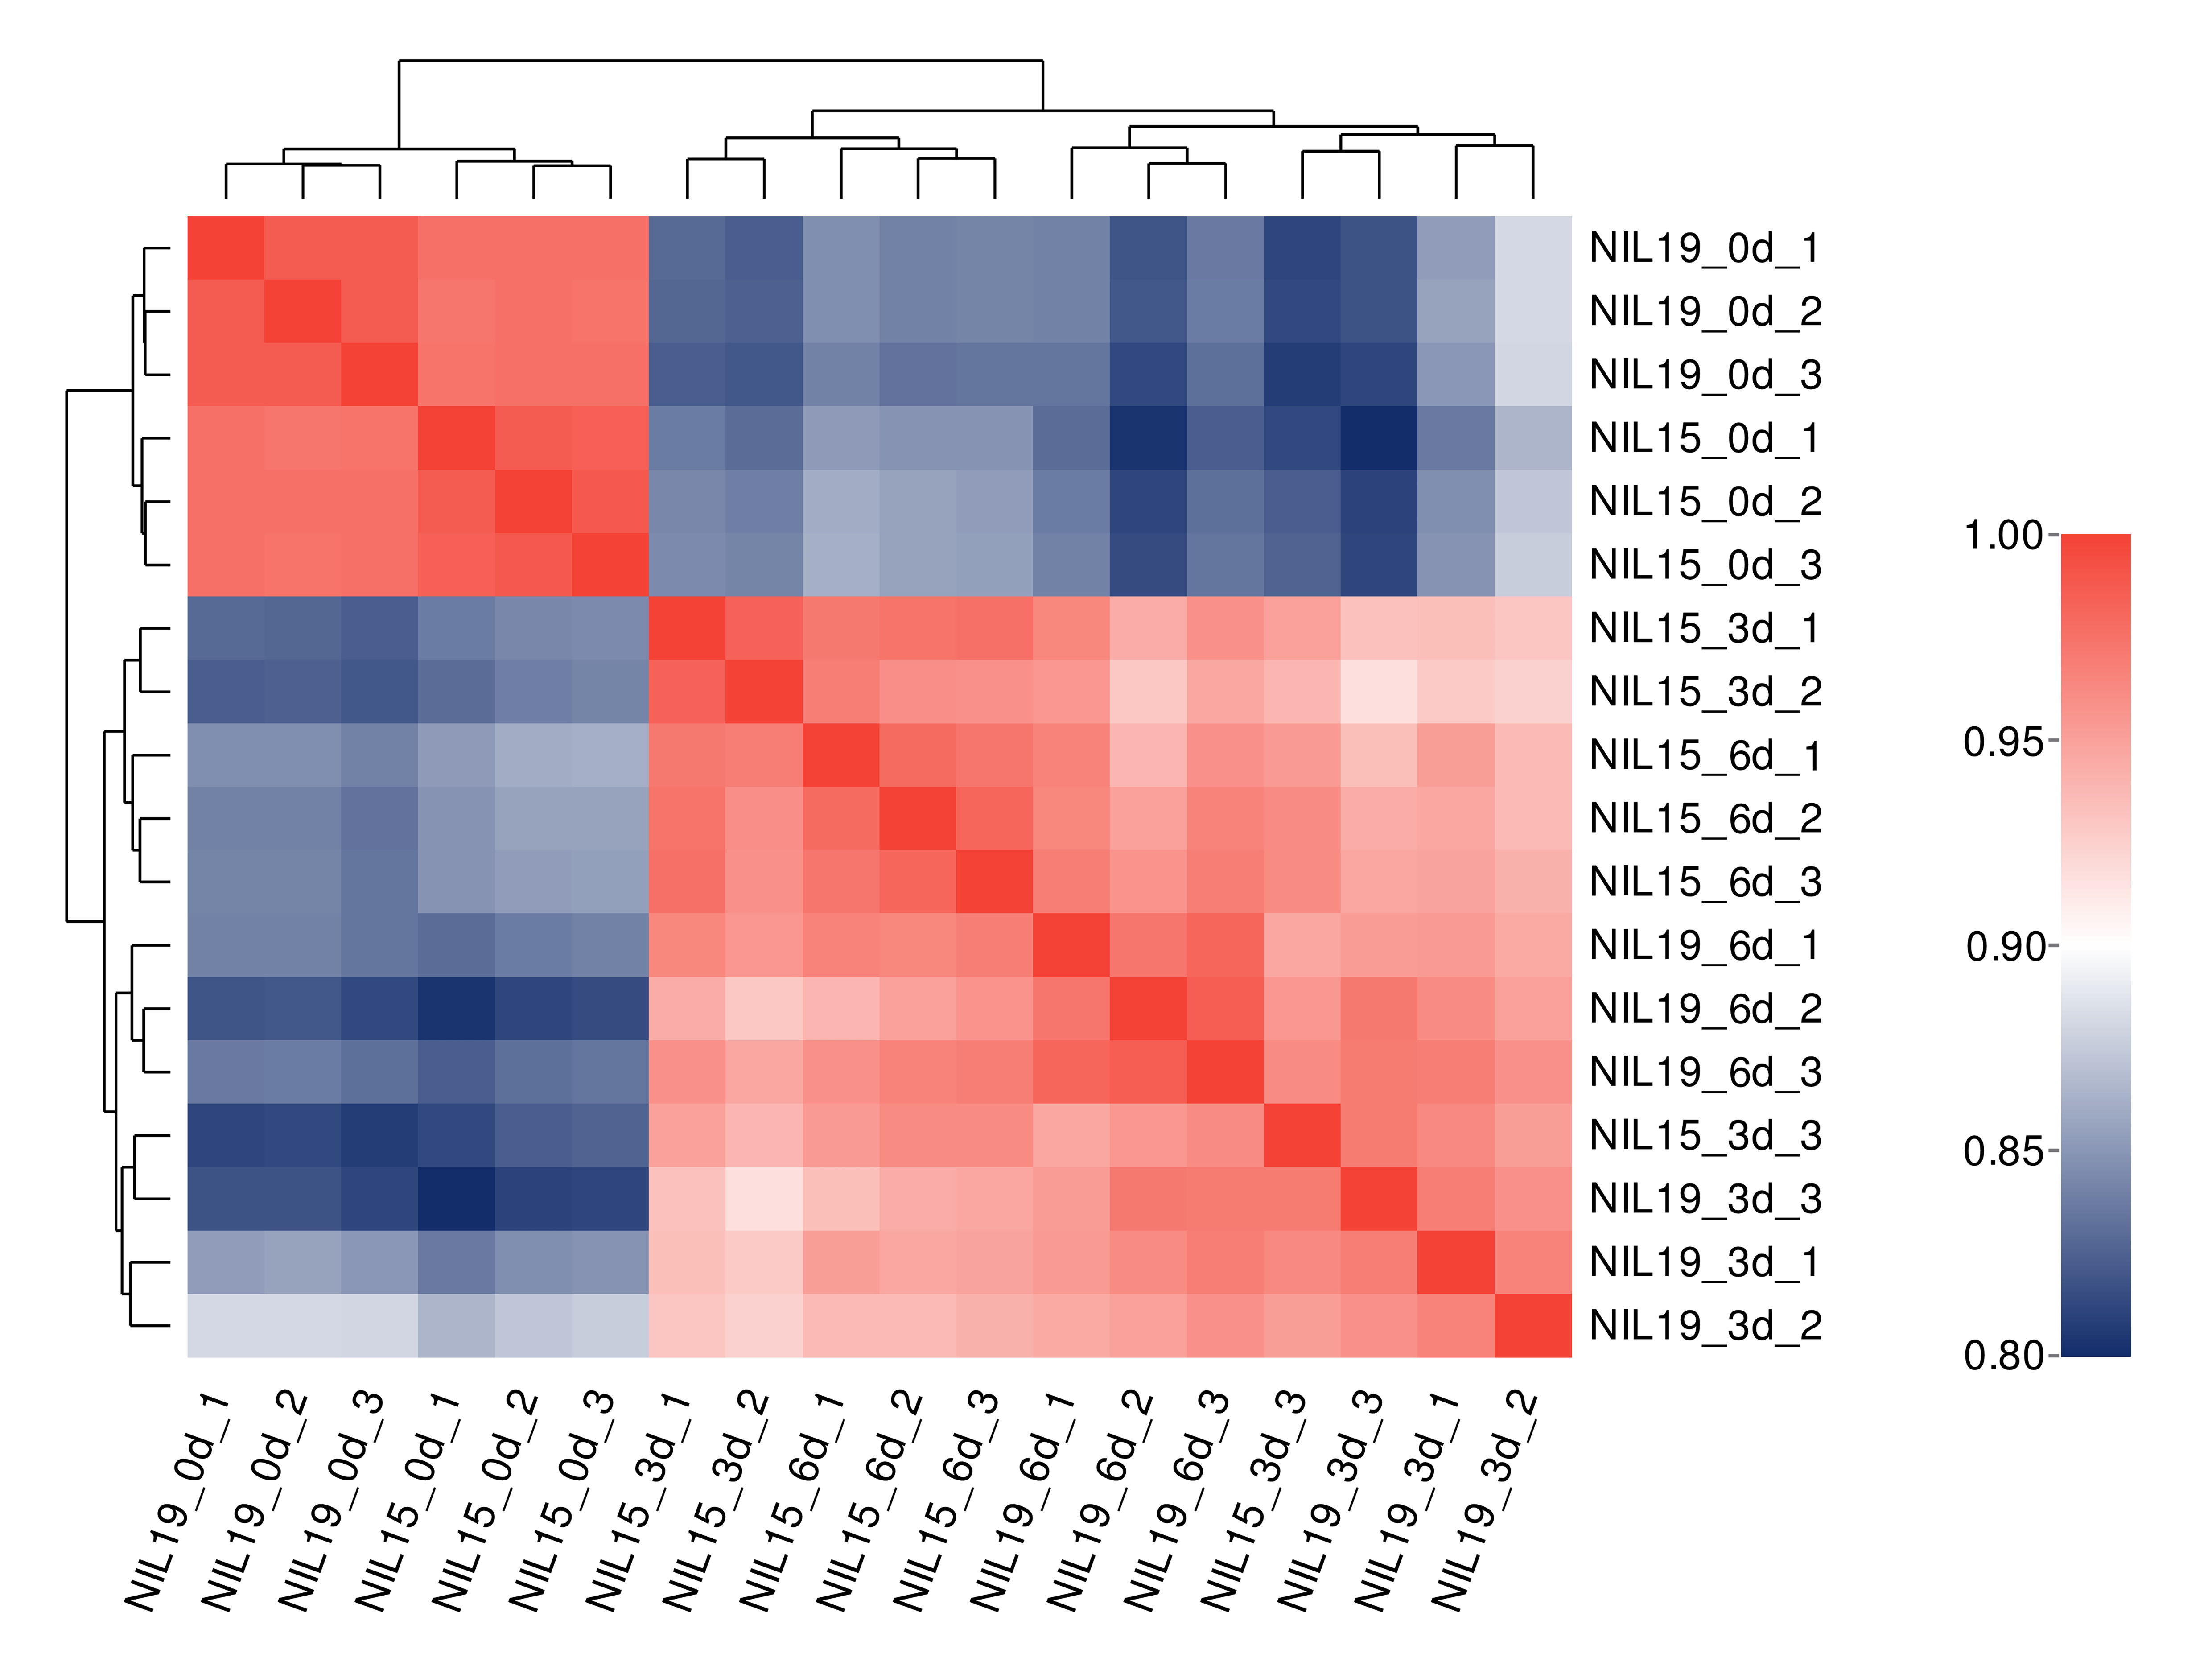
The qualities of transcriptome sequencing and sequence alignment results are shown in Table S8. The cDNA library of 18 samples had high sequencing quality and good genome coverage, which was suitable for further analysis. Based on the gene expression levels in different samples, we performed correlation analysis on commonly expressed genes and differentially expressed genes (DEG). The averaged correlation coefficient between biological replicates of the same sample was r = 0.9357 (Fig. S1), indicating good reproducibility and reliable experimental results.
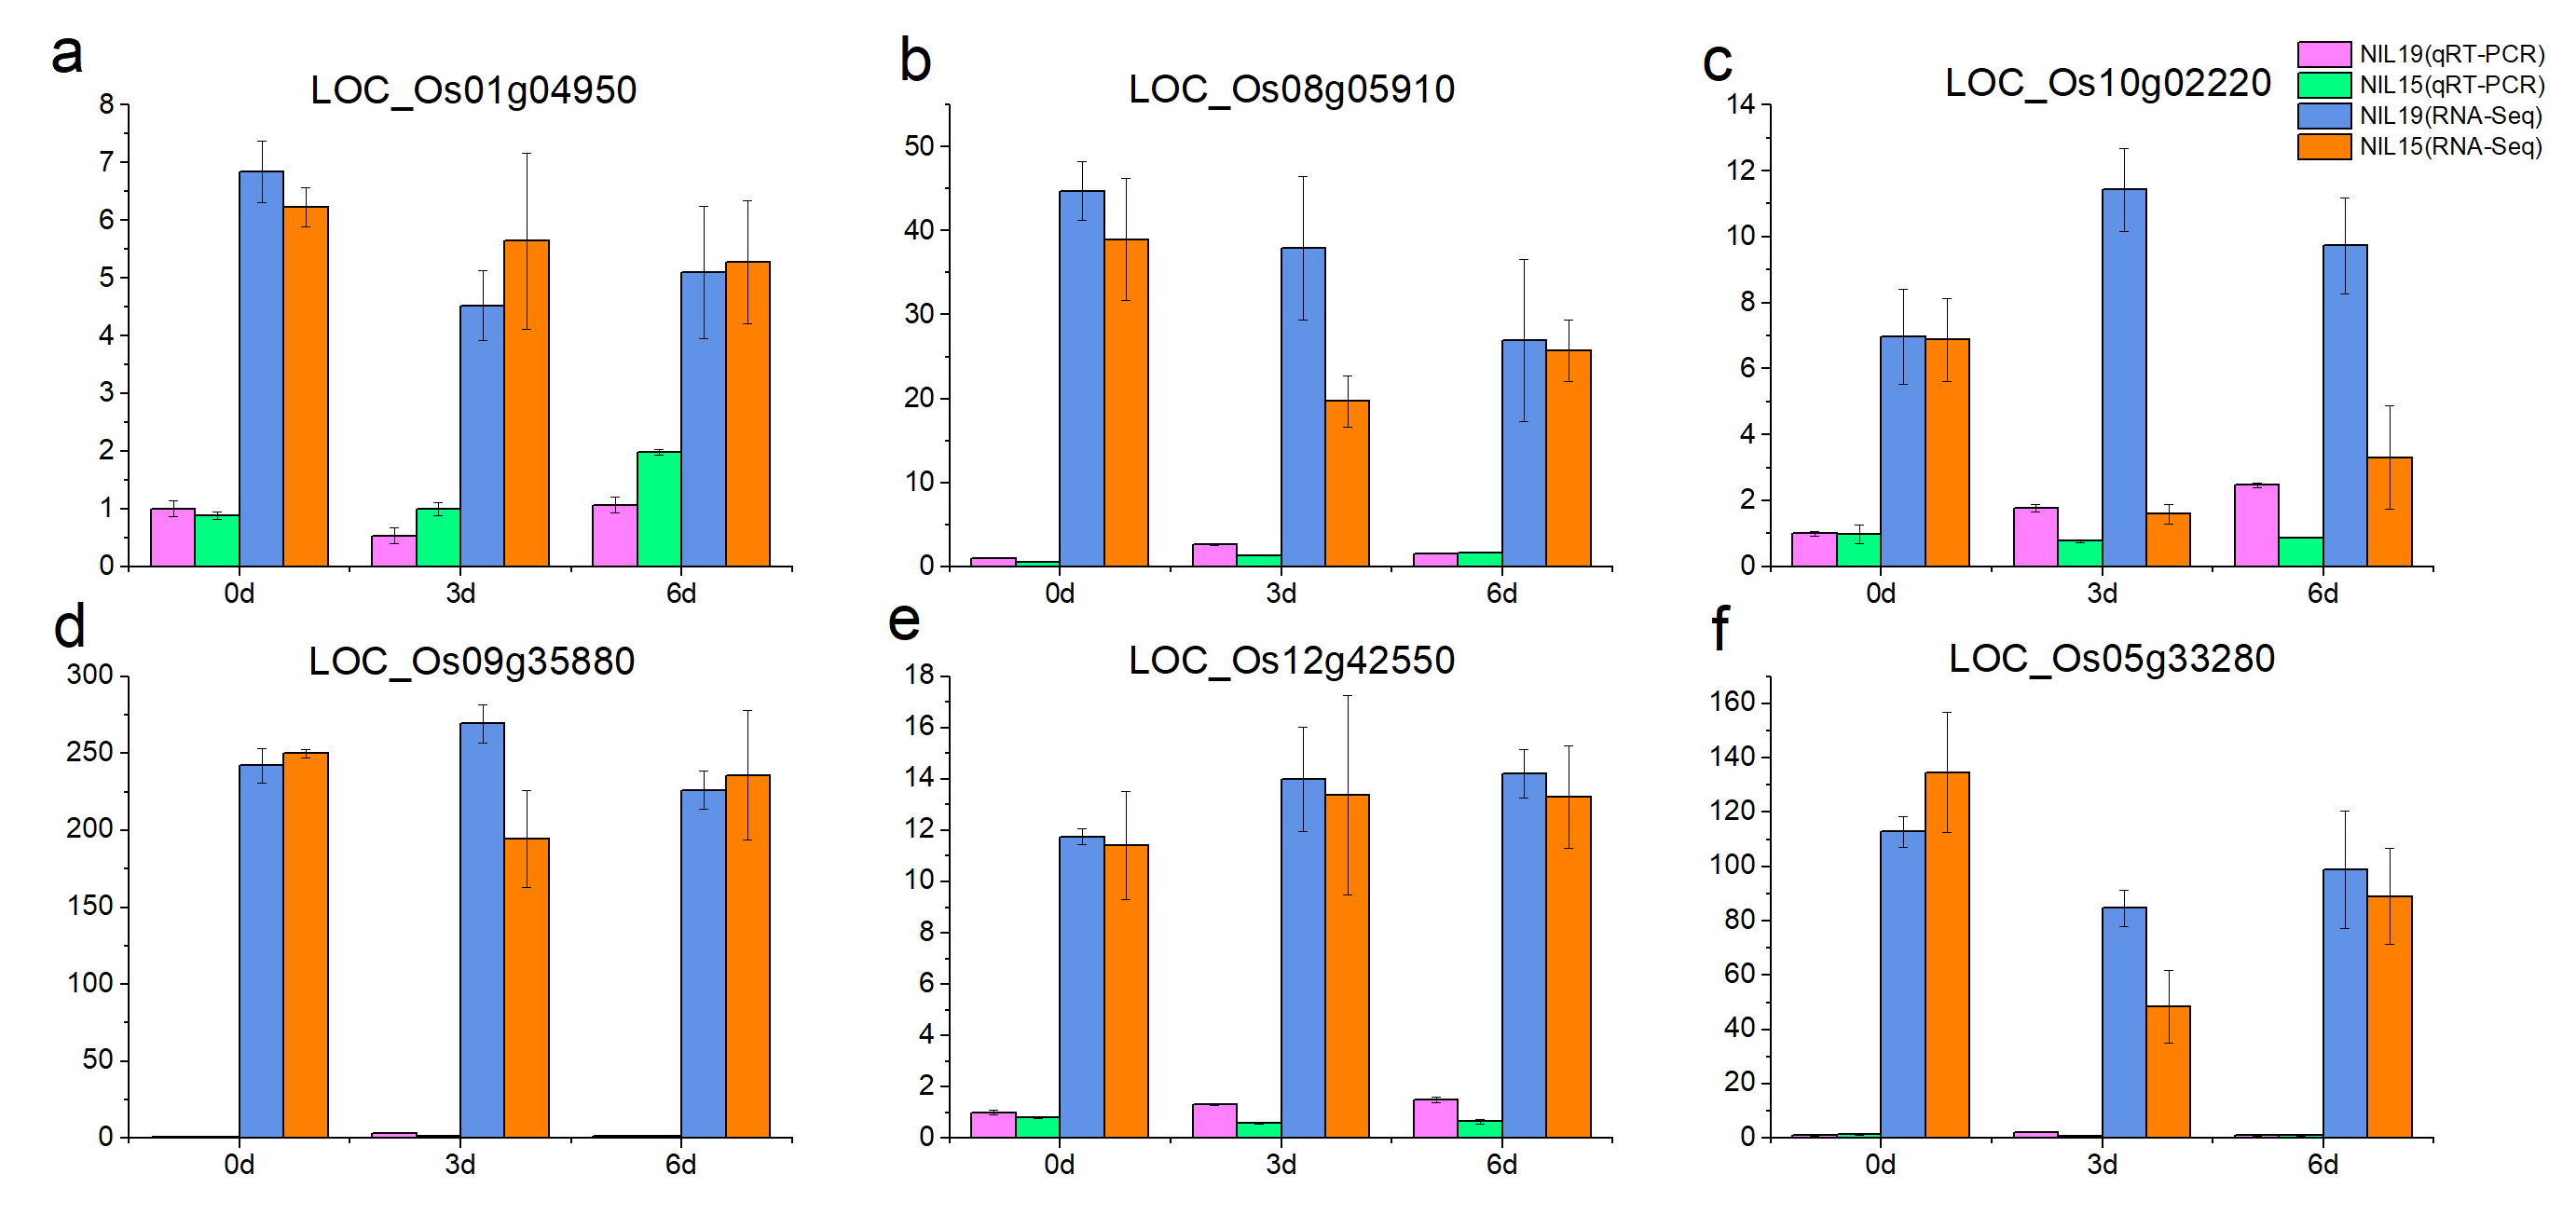
We used the qRT-PCR method to validate the 18 expression genes identified from RNA-Seq. The results showed that the qRT-PCR expression patterns of the 18 DEGs were consistent with RNA-Seq analysis (Fig. S2), suggesting that the RNA-Seq results were reliable for further analysis.
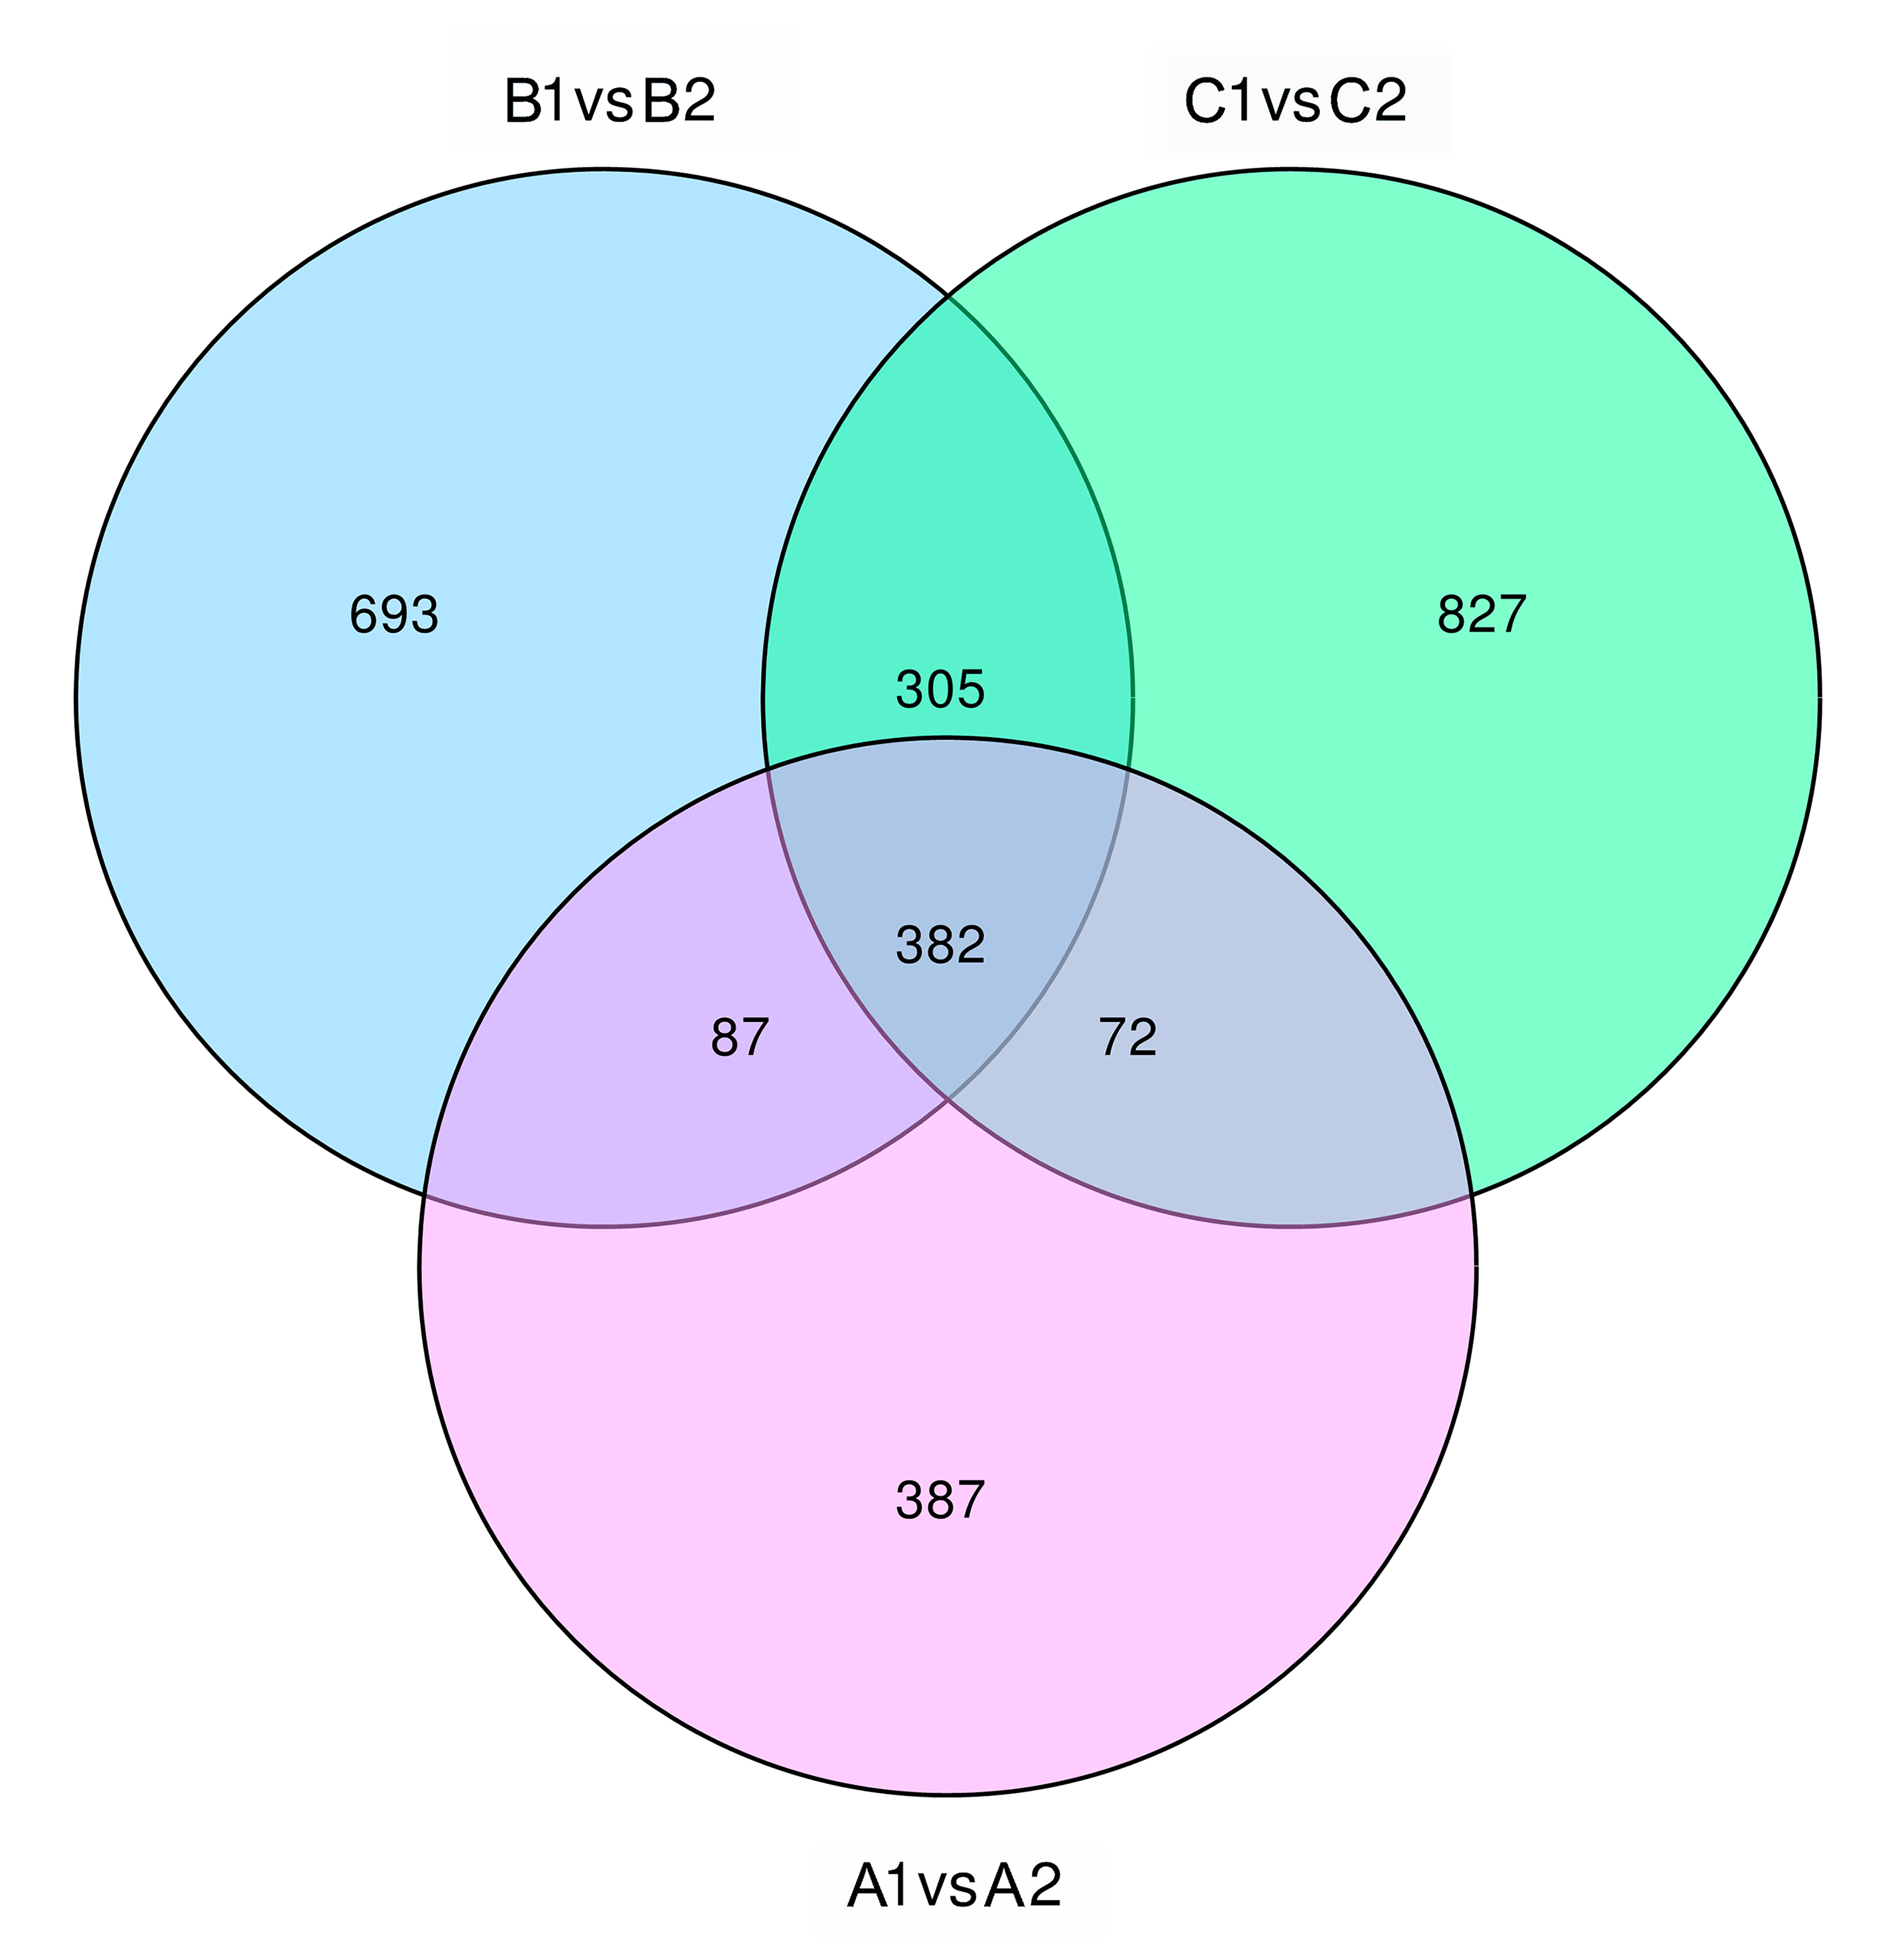
Previous studies have shown that the differences between NIL15 and NIL19 are on chromosomes 6, 8, 9, and 10[5]. These regions contain 6 PTR genes, which were LOC_Os06g13200, LOC_Os06g13210, LOC_Os06g15370, LOC_Os06g21900, LOC_Os06g38294, and LOC_Os10g22560. The transcriptome sequencing results showed that the number of DEGs between the two lines at three stages were 928, 1,467 and 1,586 (Fig. S3), respectively. After shifted to LN condition, the number of DEGs significantly increased first, and then stabilized. We also performed functional annotation on DEGs using the GO database (http://geneontology.org/), and the classification results are shown in Fig. 7. In the biological process category, metabolic process contained the most genes; in the cellular component category, there were more genes related to membraneor membrane components; in the molecular function category, transporter activity related genes showed up.
In living organisms, different genes cooperate together to perform biological functions, and the same action across different genes forms a pathway. We classified and annotated the DEGs using KEGG database (https://www.kegg.jp/), and the classification results are shown in Fig. 8. The main involved pathways were: metabolism, genetic information processing, environmental information processing, cellular processes, organismal systems and human diseases, in which the metabolism pathway contained the most genes. Also, N metabolism-related genes were included in energy metabolism group.
The expression profiles of 96 PTR genes showed in Fig. 9. There were only two differentially expressed PTR genes between the two rice lines at 0 d, which were LOC_Os06g13210 and LOC_Os10g02100. However, at 3 d and 6 d, the number of differentially expressed PTR genes increased to 12 and 7 (Table S9), in which the LOC_Os04g50950(OsPTR6) [18], LOC_Os06g49250 (OsPTR9) [19] and LOC_Os11g12740 (SP1) [21] have been reported to participate in N uptake and transport in rice.
The gene regulation network of NUE in rice
The expression profile data was analyzed using weighted gene co-expression network analysis (WGCNA) to predict the potential interaction between genes. The correlation coefficient of the gene expression levels was calculated and taken n-degree power, so that the numerical distribution of the correlation coefficient gradually followed scale-free distribution. 58,176 genes were screened, and the criteria were: (i) at least 50% of the samples are expressed the gene; (ii) remove the genes with the least variance change >= 25%. Finally, 20,282 genes were left for further analysis.
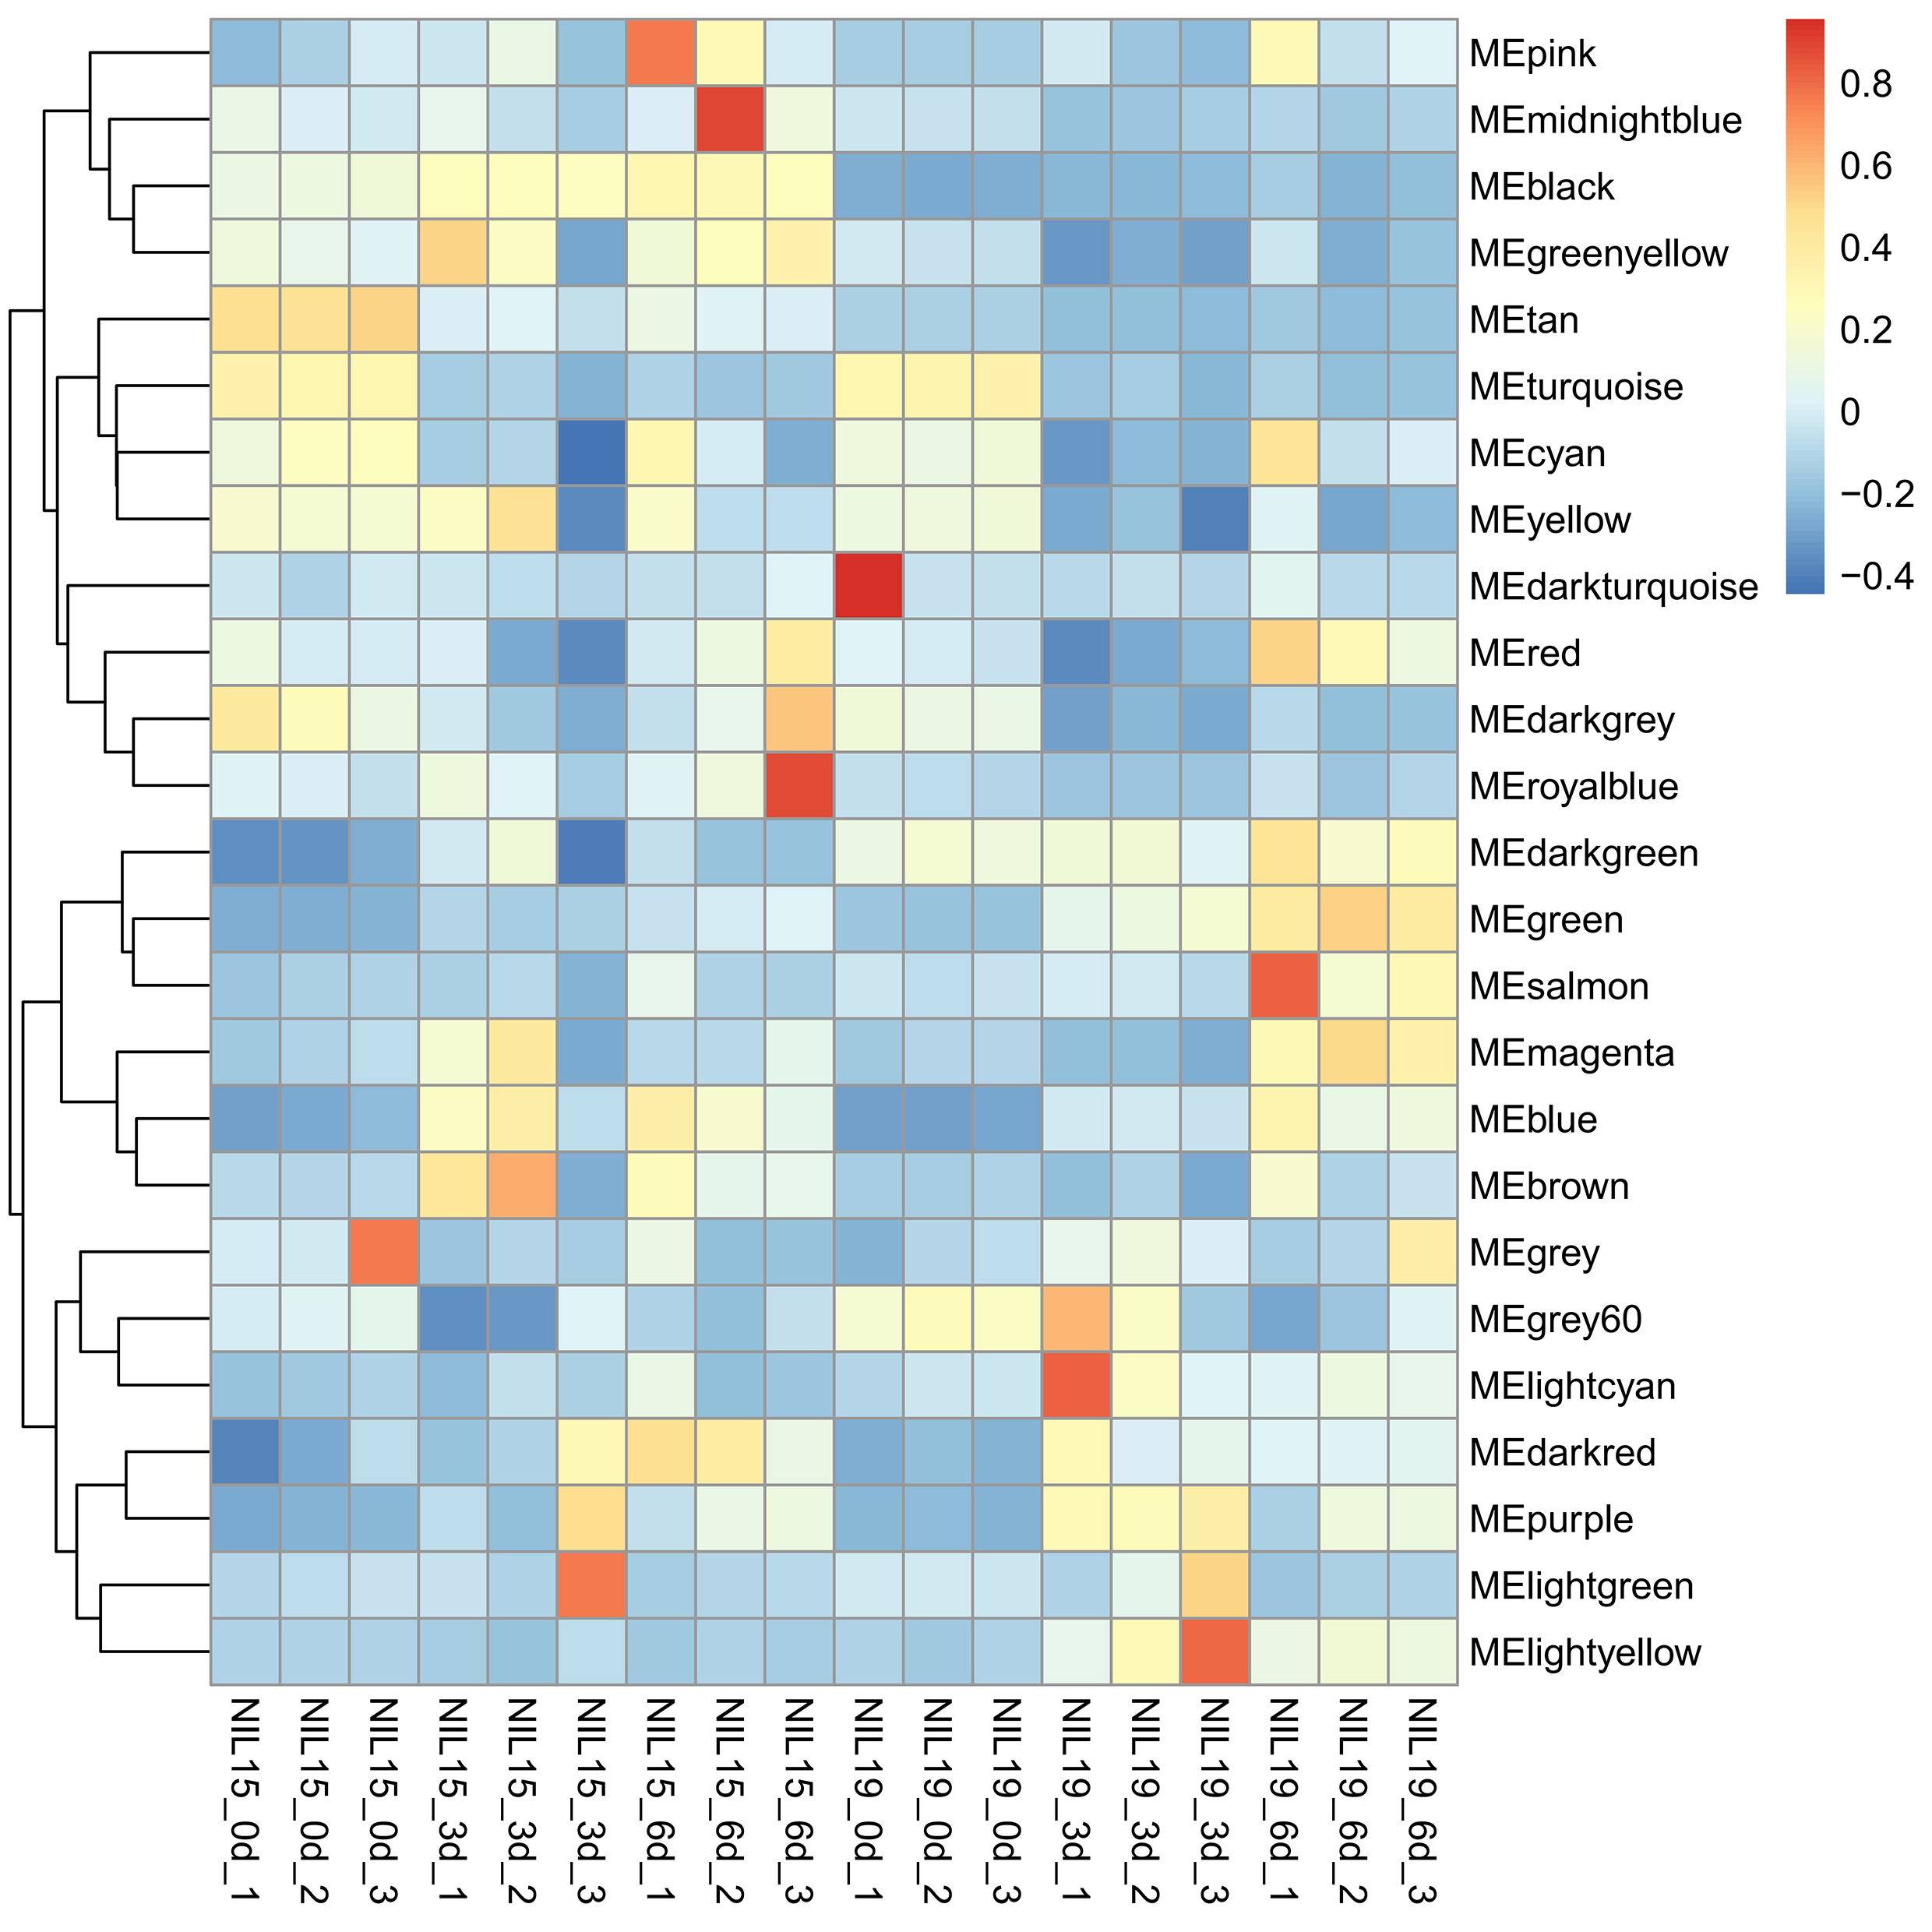
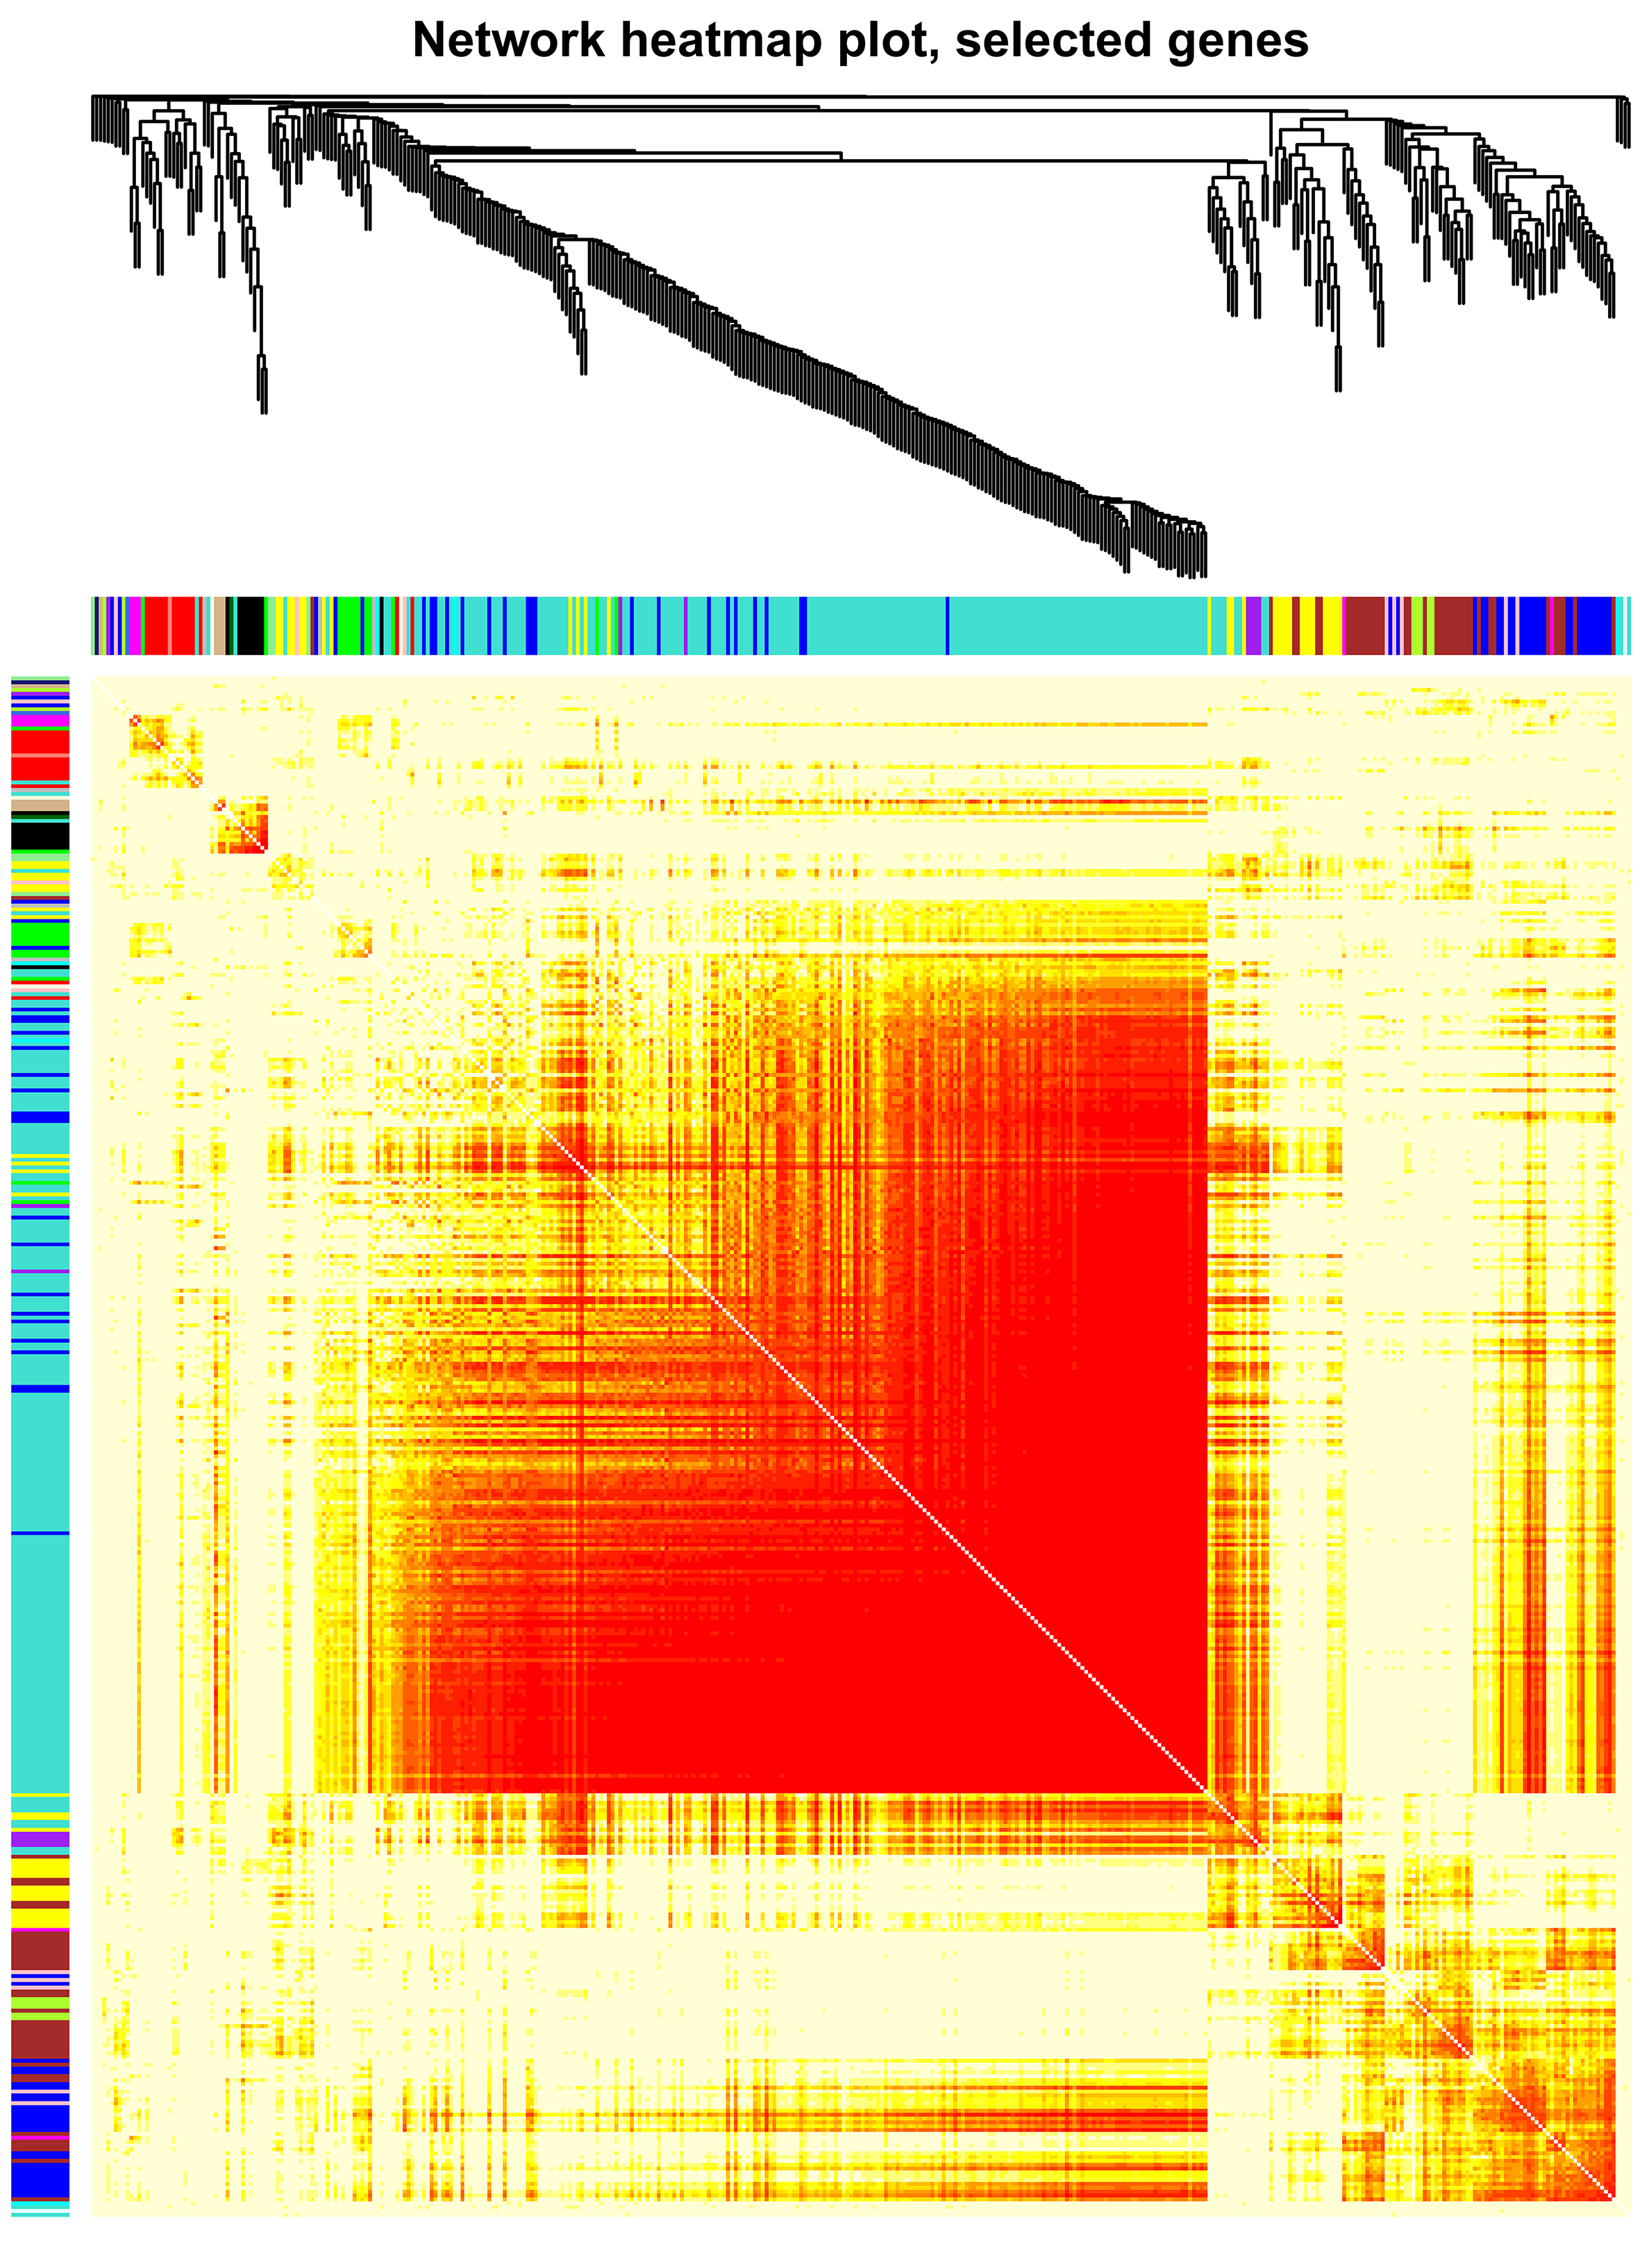
Then, we clustered the samples and found that the samples from 0 d, 3 d and 9 d could be well separated (Fig. S4a), indicating that the data quality was reliable enough for subsequent analysis. Then, a soft threshold was chosen to construct gene coexpression network (Fig. S4b,c). 20,282 genes were used for WGCNA analysis, and 400 genes were randomly selected from the gene set to draw the expression cluster heatmap (Fig. S5). We classified the genes with similar expression pattern into one module, and identified 25 modules. We analyze the gene features in each module and found the modules with biological significance (Fig. S6). Subsequently, GO and KEGG databases were used for functional enrichment analysis, and the blue, browen and turquoise modules were found to participate in N metabolism. The blue module contained six NUE-related genes: LOC_Os01g36720 [35], LOC_Os03g62200 [36], LOC_Os04g40410 [37], LOC_Os04g43070 [38], LOC_Os05g39240 [39] and LOC_Os06g49250 [19]. The brown module contained LOC_Os01g61510 [36], LOC_Os01g65000 [36], LOC_Os02g47090 [40] and LOC_Os04g50950 [18]. The turquoise module contained LOC_Os02g02190 [41], LOC_Os02g40710 [42], LOC_Os02g40730 [43], LOC_Os03g13274 [10], LOC_Os03g48180 [44], LOC_Os10g40600 [16,45], LOC_Os11g12740 [21] and LOC_Os12g44100 [17].
We performed WGCNA on these three modular genes. There were 59 DEGs in the brown module, and LOC_Os03g29410, LOC_Os02g14480, LOC_Os04g24220, LOC_Os11g39370, LOC_Os09g30120 were hub genes in the regulatory network (Table S10, Fig. 10a). The functions of the most connected genes LOC_Os03g29410, LOC_Os04g24220, LOC_Os02g14480, and LOC_Os11g39370 are related to protein kinase. Based on GO annotation, the functions of these genes were related to activity (GO: 0016301), stress (GO:0006950), biotic stimulus (GO: 0009607), signal transduction (GO: 0007165), and metabolic process (GO: 0008152). There were 129 DEGs in the turquoise module, and LOC_Os06g11990, LOC_Os10g22590, LOC_Os08g44360, LOC_Os07g45060, LOC_Os07g06680, LOC_Os05g08370, LOC_Os04g59330 and LOC_Os02g51710 were hub gene (Table S11, Fig. 10b). Due to the small number of DEGs in the blue module, we were not able to identify the hub genes.