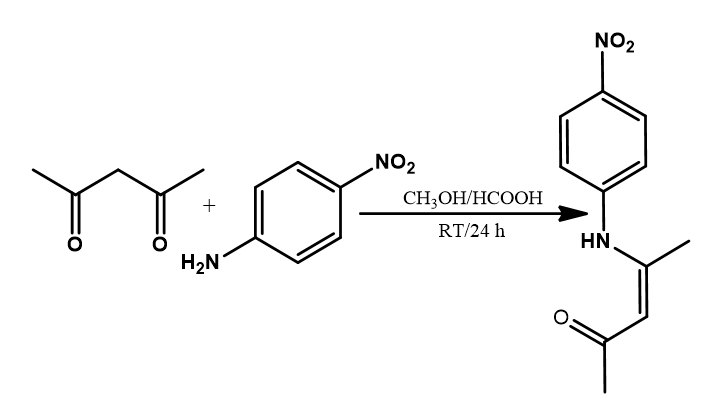
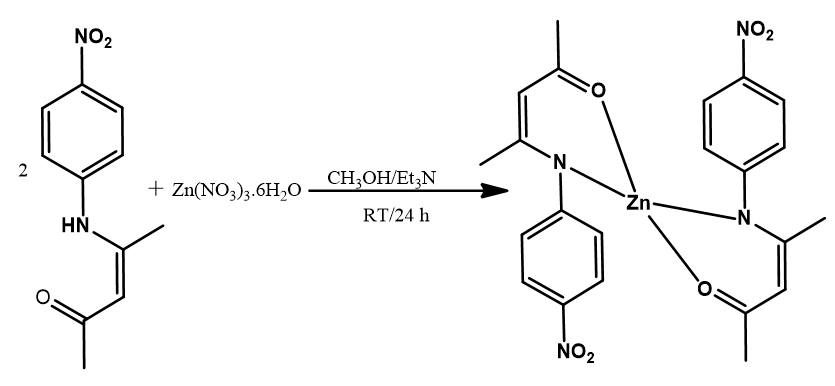
The Schiff base (HL) was synthesized by the condensation of 4-nitroaniline and acetylacetone in methanolic solution at room temperature in a 1:1 mole ratio. The corresponding Zn (II) complex was obtained after the reaction of the ligand with zinc nitrate hexahydrate in a 1:2 mole ratio of metal to the ligand. Both the ligand and the complex gave moderate yield and are stable at room temperature. The ligand and the complex were obtained as yellow and light-yellow compounds, respectively. The ligand is soluble in methanol, ethanol, acetonitrile, DCM, DMF, DMSO while the complex is only soluble in acetonitrile, DMF, and DMSO. Spectroscopic and analytical data obtained are in good agreement with the proposed structures and molecular formula (MF) (Table 2). The positions of the molecular ion peaks in the mass spectra of the ligand and the complex are consistent with their molecular weights (MWt) and formula. The molar conductivity (К) value of 15.3 Ω−1cm2mol−1 obtained for the complex in DMF (Table 2) suggests that the complex is less electrolytic in this solvent [51].
Table 2
The analytical and physical data of the ligand and its Zn (II) complex
|
Compound
|
MF
(MWt)
|
Colour
|
Yield %
(g)
|
m.p/d.p
˚C
|
Elemental analysis (Calc.) found
|
К(Ω−1cm2 mol−1
|
|
C
|
H
|
N
|
|
HL
|
C11H11N2O3
(220.0848)
|
Yellow
|
62.7 (1.36)
|
140–142
|
59.92 (59.99)
|
5.47 (5.49)
|
12.70 (12.72)
|
–
|
|
[ZnL2]
|
C22H22N4O6Zn
(502.0831)
|
Pale yellow
|
68.2 (0.16)
|
238
|
52.33 (52.45)
|
4.37 (4.40)
|
11.06 (11.12)
|
15.3
|
3.1 1H and 13C{H} NMR
The 1H NMR and 13C{H}NMR data obtained for HL and its Zn (II) complex in DMSO-d6 are presented in Table 3 while the corresponding spectra are provided as Fig. S1-S4 in the Supporting information. The 1H NMR spectrum of the ligand shows a single broad peak downfield 12.66 ppm, corresponding to the proton of the amine group (N-H). The protons of the methyl substituent in the ligand appear upfield between 2.06 and 2.22 ppm as singlet due to differences in chemical environments as a result of the involvement of the carbonyl group in the formation of β-ketoamine. The vinylic proton appeared as a singlet at 5.44 ppm.
The 13C{H}NMR spectrum of the ligand presents a signal for the sp2 carbon of the ketone functional group at 196.98 ppm, the sp3 carbon of the amine function at 157.31 ppm, the vinylic carbon at 100.99 ppm and the aromatic carbons of the phenyl ring at 121.84-145.18 ppm. Upon complexation with Zn (II) ion, significant changes in the 1H NMR spectrum were observed. The methyl protons which initially appeared as singlet at 2.06 and 2.22 ppm shifted to 1.76 and 1.94 ppm, respectively in the complex, and integrating to three protons, each in a different chemical environment. The appearance of these protons upfield as compared to their position in the free ligand suggests that the coordination to the metal ion occurred through the oxygen and nitrogen atoms of the carbonyl and amine. The vinylic proton also shifted upfield at 5.09 ppm due to complexation. The complete disappearance of the amine proton signal from the spectrum of the complex indicates that the ligand is deprotonated before coordination to the metal ion. The aromatic protons appeared upfield as duplets with each integrating into two protons. These changes in the positions of the proton signals confirm the formation of the complex.
Similarly, the 13C{H}NMR spectrum of the complex shows substantial changes in the positions of the carbon signals upon complex formation. The carbon atoms of methyl groups appear at 22.8 and 27.7 ppm, the vinyl carbon at 98.0 ppm and the aromatic carbon at 124.6-154.1 ppm. In addition, the sp3 carbon of the imine function shifted downfield to appear at 171.8 ppm against the 157.3 ppm observed for free ligand while the sp2 carbon of the ketone functional group shifted upfield to appear at 187.1 ppm as opposed to the 196.9 ppm obtained for the ligand (Table 3). The changes in the positions of these two carbons confirm the involvement of the amine nitrogen and the carbonyl oxygen in coordination.
Table 3
The1H and 13C{H}NMR data of the ligand and its Zn (II) complex
|
1H NMR data
|
|
HL
|
aCH3
|
bCH3
|
CH
|
2H–Ar
|
2H–Ar
|
1H–NH
|
|
Chemical shift (ppm)
|
2.06
|
2.22
|
5.44
|
7.39
|
8.18
|
12.66
|
|
[ZnL2]
|
aCH3
|
bCH3
|
CH
|
2H–Ar
|
2H–Ar
|
–
|
|
Chemical shift (ppm)
|
1.76
|
1.94
|
5.09
|
6.89
|
8.14
|
–
|
|
13C{H}NMR
|
|
HL
|
20.1
|
29.4
|
100.9
|
121.8, 125.1, 142.6, 145.1
|
157.3
|
196.9
|
|
Chemical shift (ppm)
|
aCH3
|
bCH3
|
CH
|
Aromatic
|
C-N
|
C=O
|
|
[ZnL2]
|
22.8
|
27.7
|
98.1
|
124.6, 124.8, 143.9, 154.1
|
171.8
|
187.1
|
|
Chemical shift (ppm)
|
aCH3
|
bCH3
|
CH
|
Aromatic
|
C-N
|
C=O
|
3.2 Infrared spectral studies
The most significant IR absorption bands of HL and its Zn (II) complex are listed in Table 4 while the IR spectra of the compounds are depicted in Fig. 2.The presence of a free –NH2 group in a molecule is signalled by the appearance of an absorption band at 3400 cm−1 [52, 53]. However, the absence of this band from the spectra of the ligand and the presence of a new broad band around 3100 cm−1 which is assignable to N–H stretching vibration confirm the successful formation of β-ketoamine, not β-ketoimine [54]. Other supporting evidence include the appearance of v(C=O) band at 1620 cm−1, the v(C-N) band at 1526 cm−1and the absence of a v(C=N) band around 1690-1640 cm−1.
The IR spectrum of the complex differs significantly from that of the free ligand (Fig. 2). The v(N-H) band initially observed at 3100 cm−1 for the free ligand is completely absent in the complex due to deprotonation of the amine group and subsequent coordination to the metal ion through the nitrogen. The shift of v(C-N) and v(C=O) bands from 1526 cm−1to 1334 cm−1 and from 1620 cm−1 to 1504 cm−1, respectively confirm the involvement of the carbonyl oxygen and the amine nitrogen atom in the coordination. The presence of two new bands at 428 cm−1and 563 cm−1, assignable to v[M-N] [55–57] and v[M-O] [12, 58–62], respectively, further confirms the involvement of the amine and the carbonyl groups in the formation of the complex. The result of the theoretical IR data correlates well with this experimental data.
Table 4
IR spectral bands (cm−1) of ligand and its Zn (II) complex
|
Compound
|
(N-H)
|
(C=O)
|
(C-N)
|
(Zn-O)
|
(Zn-N)
|
|
HL
|
3101
|
1620
|
1526
|
–
|
–
|
|
[ZnL2]
|
–
|
1504
|
1334
|
563
|
428
|
3.3 Electronic absorption spectra
The electronic absorption spectra of the free ligand and the complex are shown as Fig. 3 while the spectral data are presented in Table 5. The ligand displayed two bands at 280 and 320 nm, due to π→π* and n→π* transitions. The Zn (II) complex showed two distinct bands at 310 and 380 nm which are assignable to charge transfer from ligand to metal ion (LMCT) in a tetrahedral geometry [63–65]. Zinc complexes are generally diamagnetic due to the filled d-orbital. Hence, a d–d transition possibility is ruled out. The molar extinction coefficients (ԑ) of the ligand and complex were found to be 4000 and 2000 cm−1mol−1, respectively which correlate well with the observed colours (Table 2).
Table 5
Electronic absorption spectral data of the ligand and its Zn (II) complex
|
Compound
|
Wavelength (nm)
|
Wave number (cm−1)
|
ԑ
(cm−1mol−1)
|
Band assignment
|
Geometry
|
|
HL
|
280
320
|
35714
31250
|
4000
|
π→π*
n→π*
|
–
|
|
[ZnL2]
|
310
380
|
32258
26316
|
2000
|
|
Tetrahedral
|
3.4 Thermal Analysis
Thermal analysis is a useful technique for the determination of the crystal water content of complexes as well as their thermal stability/decomposition pattern under controlled heating. The thermal behaviours of the ligand and its complex as a function of temperature were studied by thermogravimetric analysis (TGA) over a temperature range of 20–800 ˚C. The profiles obtained which are depicted in Fig. 4 show the weight losses recorded over the studied temperature range. The decomposition profile of the ligand shows a two-step process: loss of -C11H12NO* radical at 0–280˚C and loss of the inorganic residue containing NO2 at 300–700 ˚C. On the other hand, the thermogravimetric profile of the complex shows a three-step process beginning with loss of the moisture content of the complex at 0–100 ˚C, followed by loss of two ligand molecules at 240–330 ˚C and finally, the loss of inorganic residue containing NO2 coupled with the formation of ZnO at 330–700 ˚C. It can thus be inferred from these results that both the ligand and the complex possess good thermal stability with the latter being more stable.
3.5 X-ray powder diffraction studies
An X-ray powder diffraction study was carried out on the synthesized compounds. The compounds were scanned in the range 2Ѳ = 0-80 ˚C at a wavelength of 15406 Å, and the resulting diffraction patterns are shown in Fig. 5 which suggests that both the ligand and complex are crystalline. However, the peaks of the complex are more clearly resolved compared to the ligand’s which might be due to the relatively smaller crystallite size of the complex. Generally in smaller crystallites, there are no enough planes to produce destructive interference hence, broad space exists between their spectral peaks [66].
3.6 Mass Spectra
To further confirm the formation of the Schiff base (HL) and its Zn (II) complex, the compounds were studied using ESI-MS. The proposed molecular formula of the ligand and its complex were ascertained by comparing them with m/z values. In the spectrum of the ligand, the molecular ion peak: m/z [M+H]+ was found to be 224.1103 (Fig. S5) while the spectrum of the complex showed molecular ion peak: m/z [M-H]− at 501.0876 (Fig. S6). These data are in good agreement with the proposed molecular formula of the compounds. In addition, the mass spectrum of the ligand shows a single peak, suggesting that the compound is highly stable, while the spectral peaks of the complex confirm its decomposition profile as revealed by thermal analysis.
3.7 Electrochemical studies
To investigate the electrochemical properties of the synthesized compounds and hence predict their bioactivity, the redox behaviors of both the ligand and the complex were studied by cyclic voltammetry (CV) in a 0.01 M PBS electrolyte at scan rates 20, 40, 60, 80 mV/s. The results obtained are displayed as Fig. 7C and 7D for the ligand and the complex, respectively. The single reductive wave observed for the ligand between -0.5 V and 2.0 V potentials (Fig. 7C) is indicative of a one-electron transfer reduction process involving the amine proton (NH). The reductive wave produced by the complex can be attributed to the reduction of Zn2+ to Zn+, which is an irreversible one-electron transfer process [66, 67]. The dependence of the peak potential on scan rates indicates that only one electron is transferred, while the linearity of the plots of reduction peak current, Ipc against scan rate, v for both the ligand and complex suggests that the electrode process was controlled by adsorption [68]. These results generally revealed that both the ligand and the complex are electrochemically active and will hence show appreciable biological activity.
3.8: In vitro antibacterial activity
The results of antibacterial screening of the ligand, the complex and the reference drug (streptomycin) obtained at concentrations of 10–30 µg/mL using the Agar diffusion method [69] are presented in Fig. 8 while the images of the culture plate are shown in Fig. S7 of the SI file. It is evident from the figures that the complex is more active against the tested organisms than the ligand and the reference drug. The complex appears to be more sensitive to the Gram-positive strains than the Gram-negative ones probably due to the variations in the complexities of the cell walls of the organisms. The zones of inhibition obtained shows that the antibacterial effect of the complex follows the order S. aureus > S .pyogene > K. pneumoniae > E. coli. A similar trend is observed for the ligand with reduced zone of inhibition compared to the complex. This suggests that the complexation of the ligand with Zn (II) ion leads to enhanced bioactivity. Finally, the variation in the activity of the complex as a function of microbial strain could be attributed to varying degrees of cell permeability or difference in ribosome [70].
3.8 Minimum inhibitory concentration (MIC)
To further evaluate the antimicrobial potentials of the synthesized compounds, the minimum inhibitory concentrations (MIC) of the compounds were determined and compared with that of streptomycin. The images of the study plates are presented as Fig. S8 in the SI file. The data obtained (Table 6) reveal that the ligand exhibit moderate activity on the tested organisms. The ligand gave MIC of 64 µg/mL for S. aureus (Sa) and S.pyogene (Sp), and 128 and 256 µg/mL for K. Pneumoniae (Kp) and E. coli (Ec), respectively. The reference drug yielded MIC values of 8 and 16 µg/mL for Sa and Sp, and 32 and 128 µg/mL for Kp and Ec, respectively. However, the best MIC values were obtained with the complex. This result indicates that complexation increases the activity of the compound.
Table 6
Minimum inhibitory concentrations (MIC) (µg/mL) of the compounds
|
Compound
|
Sa
|
Sp
|
Kp
|
Ec
|
|
HL
|
64
|
64
|
128
|
256
|
|
[ZnL2]
|
4
|
4
|
16
|
64
|
|
Streptomycin
|
8
|
16
|
32
|
128
|
3.9 DFT Calculations
3.9.1 Geometry optimization
The optimized geometries of ZnL2 obtained with B3LYP, WB97XD and M06-2X functional are shown in Fig. 9. From this figure, the values of a set of equivalent bond angles are listed in Table 7 to compare the relative performances of the functional in predicting the geometry of the complex as proposed experimentally. These include N2–Zn–O4 and N3–Zn–O5, N2–Zn–O5 and N3–Zn–O4, and O4–Zn–O5 and N2–Zn–N3. Comparison of these pairs of bond angles in Table 7 shows that the B3LYP is the best performing functional as it yielded the most perfect geometry with the tetrahedral characteristics of a typical zinc (II) complex. The prediction strengths of the functional follow the order B3LYP > WB97XD > M06-2X.
Table 7
Selected bond angles in ZnL2
|
Bond angle(°)
|
| |
B3LYP
|
WB97XD
|
M06-2X
|
|
\(\angle\)N2–Zn–O4
|
93.68
|
92.92
|
93.14
|
|
\(\angle\)N3–Zn–O5
|
93.71
|
92.93
|
93.15
|
|
\(\angle\)N2–Zn–O5
|
113.96
|
122.88
|
117.12
|
|
\(\angle\)N3–Zn–O4
|
113.84
|
122.94
|
115.52
|
|
\(\angle\)O4–Zn–O5
|
121.28
|
117.00
|
122.88
|
|
\(\angle\)N2–Zn–N3
|
122.78
|
110.68
|
117.18
|
3.9.2 Predicted IR spectra
The IR spectra and absorption frequencies obtained from DFT calculations in methanol for both the ligand and the complex are given as Fig. S9 and Table S1, respectively in the Supporting Information file. The absolute deviations from the experimental values given in Table 4 are listed Table 8. On the average, this table clearly shows that the B3LYP model produced the least deviations and the performance strength of the functional follows the order M06-2X< WB97XD < B3LYP.
Table 8
Absolute deviations of predicted frequencies from experimental values in methanol.
|
Model
|
N-H
|
C=O
|
C-N
|
Zn-O
|
Zn-N
|
|
HL
|
|
B3LYP/6-31+G(d,p)
|
138
|
12
|
24
|
–
|
–
|
|
WB97XD/6-31+G(d,p)
|
264
|
22
|
51
|
–
|
–
|
|
M06-2X/6-31+G(d,p)
|
279
|
94
|
48
|
–
|
–
|
|
[ZnL2]
|
|
B3LYP/6-31+G(d,p)
|
–
|
65
|
13
|
18
|
2
|
|
WB97XD/6-31+G(d,p)
|
–
|
52
|
14
|
29
|
10
|
|
M06-2X/6-31+G(d,p)
|
–
|
54
|
18
|
32
|
24
|
3.9.3 Reactivity properties of the studied compounds
Based on the outcome of geometry optimization and IR spectra prediction, the best performing functional (i.e. B3LYP) was selected for the reactivity and thermodynamic studies, and the results obtained are presented in Table 9. The HOMO and LUMO charge density graphics are shown in Fig. 10 for both the ligand and the complex. HOMO (i.e. highest occupied molecular orbital) is the orbital through which a molecule gives electron to an acceptor while LUMO is the one used for accepting an incoming electron. The higher the HOMO energy (EHOMO), the greater the ease of giving electron, and the lower the LUMO energy, the higher the likelihood of accepting an incoming electron. Thus, the EHOMO and ELUMO data in Table 9 suggest that the complex will be a better electron donor and a better electron acceptor than the free ligand.
The energy of the LUMO relative to the HOMO gives the overall reactivity/stability of the molecule. The higher the HOMO-LUMO energy gap (ΔEHL), the lower the reactivity and the higher the stability, and vice versa. The ΔEHL values in Table 9, therefore suggest that the complex is relatively more reactive than the ligand. However, both of them are predicted to have similar degrees of polarity hence, solubility as informed by their dipole moment (µ) values (Table 9).
Table 9
Reactivity and thermodynamic parameters obtained for the ligand and the complex
|
Compound
|
Reactivity indices
|
Thermodynamic properties
|
| |
EHOMO(eV)
|
ELUMO(eV)
|
ΔEHL(eV)
|
µ (Debye)
|
ΔH
(kJmol−1)
|
ΔS
(kJmol−1)
|
ΔG
(kJmol−1)
|
|
HL
|
-6.385
|
-2.875
|
3.510
|
6.96
|
-
|
-
|
-
|
|
ZnL2
|
-6.204
|
-2.903
|
3.301
|
6.95
|
-1083.3
|
-348.72
|
-979.33
|
The HOMO and LUMO electron density isosurfaces reveal the parts of a molecule which are involved in donation and acceptance of electrons, respectively. The HOMO isosurfaces of the ligand (Fig. 10A) therefore indicates that donating molecular orbital is distributed over the entire ligand structure with the exception of the methyl substituent, while the LUMO isosurfaces shows that the accepting orbital is mainly concentrated around the nitro phenyl portion of the molecule (Fig. 10B). On the other hand, the HOMO isosurfaces of the complex is centered on the delocalized pi network between the carbonyl and the pseudo imine group of the attached ligand while the LUMO isosurfaces is spread over the nitro phenyl portions of the complex.
3.9.4 Predicted thermodynamic properties of the complex at 298.15 K
Inspection of the thermodynamic parameters in Table 9 shows that the formation of ZnL2 is exothermic since it involves the formation of new bonds between Zn (II) ion and two molecules of HL as indicated by the negative change in the enthalpy of formation (ΔH). The negative change in entropy (ΔS) implies that the complex formation is an associative process that resulted in a decrease in disorderliness in the system. The negative change in Gibb’s free energy suggests that the formation of ZnL2 from Zn (II) ion and HL is highly spontaneous as it leads to increased stability.
3.10 Molecular docking
The combination of in silico and in vitro/in vivo experimental processes has been described as an interesting strategy in the design and development of drug candidates [71]. In this study, the newly synthesized compounds were docked against key representative proteins in all the studied bacteria to predict their therapeutic potentials. Their free binding energies and conformations were determined and compared with that of the known antibacterial drug, streptomycin. The result presented in Table 10 shows that ZnL2 might be a promising therapeutic candidate as revealed by its highest negative binding energy (ranging from -6.3 to -7.5 kcal/mol) for the different proteins. The compound, HL showed docking scores ranging from −5.4 to −7.1 kcal/mol, which was better than the interaction of streptomycin particularly in 6CN7.
|
Table10: The binding affinities of the compounds with the studied proteins.
|
| |
HL
|
ZnL2
|
Streptomycin
|
|
PDB ID
|
BE
(kcal/mol)
|
H-bond forming residue
|
BE (kcal/mol)
|
H-bond forming residue
|
BE (kcal/mol)
|
H-bond forming residue
|
|
1ESF
|
-5.4
|
Thr145, Asn146, Thr88
|
-6.3
|
Asn195
|
-5.6
|
Asn195, Gly200, Asp197
|
|
6OG4
|
-5.3
|
Lys223, Ala105, Ser112
|
-7.0
|
Val78
|
-5.9
|
Asn207, Lys208,
Glu172, Glu103
|
|
6CN7
|
-7.1
|
Gln356, Arg145
|
-7.5
|
Gln424
|
-6.6
|
His422, Trp550, Asn425, Ser257, Arg259
|
|
1R4P
|
-6.7
|
Trp202, Gly203, Thr114
|
-7.3
|
Lys233
|
-6.6
|
Glu259, Asp94, Tyr77, Leu200, Asp111, Try114
|
The result for the binding interaction as displayed in Figure 11 shows that the oxygen atoms of the nitro group of the HL shared at least one hydrogen bond with the residues of the various proteins.
Similarly, Figure 12 also shows that the oxygen atoms of both nitro and carbonyl groups of the ZnL2 participated in the sharing of at least two hydrogen bonds with the amino acids of the various studied proteins. There was no comparable interaction observed between the standard drug molecule (Fig. 13) and the synthesized compounds except for ASN195 residue of 1ESF which participated in the complex formed with both ZnL2 and streptomycin. Overall, the binding mode and interactions of the synthesized compounds across the proteins were different and stronger than the standard drug molecule (Fig. 13). The involvement of different residues in the interactions could also suggest that the synthesized compounds might have a different mechanism of action from the known drug, streptomycin.
3.11 Drug-likeness and pharmacokinetic properties of the compounds
The calculated physicochemical properties and drug-likeness parameters of the synthesized compounds are enlisted in Table 11. Lipinski’s requirements that an orally active molecule should not violate any two of the physicochemical parameter range of MW≤ 500, cLog P≤ 5, HBDs ≤ 5, and HBAs ≤ 10. Veber also described that TPSA and nRTBs values not more than 140 Å2 and10 respectively as efficient and selective criteria for oral bioavailability [48].
Table 11
Selected molecular and physicochemical properties of the synthesized compounds
|
Ligands
|
MW
(≤500)
|
cLogP
(≤ 5)
|
HBAs
(≤ 10)
|
HBDs
(≤ 5)
|
TPSA
(≤ 140 Ų)
|
nRTBs
(≤ 10)
|
LogS
|
SA
|
RO5 rule
|
Veber rule
|
|
HL
|
220.22
|
1.6093
|
3
|
1
|
74.92 Ų
|
4
|
-2.78
|
2.40
|
Yes
|
Yes
|
|
ZnL2
|
503.81
|
2.5486
|
6
|
0
|
132.26 Ų
|
4
|
-5.67
|
5.38
|
Yes
|
Yes
|
| MW: Molecular weight, cLogP: calculated log of octanol/water partition coefficient, HBAs: Hydrogen bond acceptors, HBDs: Hydrogen bond donors, TPSA: Total polar surface area nRTBs: Number of rotatable bonds, Log S: log of solubility. RO5; Rule of five. |
Furthermore, LogS has been described as one of the key parameters that facilitate the developmental activities of orally administered drugs [72, 73]. In this study, both HL and ZnL2 complied with the RO5 and Veber’s rule. The LogS values also showed that both compounds might be soluble in water. The results, therefore, imply that they have the prospect for good absorption and permeability across the membrane. Furthermore, the synthetic accessibility scores, 2.40 and 5.38 for HL and ZnL2, respectively revealed that their molecular fragment might be easily obtainable.
The pharmacokinetic properties of the compounds are described in Table 12. The results suggest that HL might be well absorbed while both compounds were predicted as non-P-substrates and they both showed the potential to penetrate the BBB. The compound, ZnL2 showed inhibition of most of the CYP450 isozymes including CYP1A2, 2C19, and CYP3A4 while only CYP1A2, and CYP2C19 isozymes were inhibited by HL. Toxicity profiling showed that HL and ZnL2 possess the risk of reproductive effects. This result implies the need for a more in-vitro assessment of the safety of these compounds.
Table 12
Selected pharmacokinetic properties of the synthesized compounds
|
Compounds
|
GI absorption
|
P-gp substrate
|
BBB permeant
|
CYP1A2 inhibitor
|
CYP2C19 inhibitor
|
CYP2C9 inhibitor
|
CYP2D6 inhibitor
|
CYP3A4 inhibitor
|
Mutage-nic
|
Tumorigen-ic
|
Reproducti-ve effects
|
Irritants
|
|
HL
|
High
|
No
|
Yes
|
Yes
|
Yes
|
No
|
No
|
No
|
No
|
High
|
No
|
No
|
|
ZnL2
|
Low
|
No
|
Yes
|
No
|
Yes
|
Yes
|
No
|
Yes
|
No
|
High
|
No
|
No
|
| GI: Gastrointestinal, P-gp: p-glycoproteins, BBB: Blood-brain barrier, CYP: Cytochrome P450 |