Clinical specimens
The GC tissues and their paired normal adjacent tissues were collected from patients (N = 45) diagnosed as GC in the First Affiliated Hospital of Harbin Medical University from 2012 to 2014. These GC patients did not receive any treatment before surgical resection. The clinicopathological features of the above patients were summarized in Table 1. All the clinical experiments were approved by the Institutional Ethics Committee of the First Affiliated Hospital of Harbin Medical University, and all the participants involved in this study signed the informed consent form.
Cell culture
The human gastric epithelial cell line GES-1, cisplatin-sensitive GC (CS-GC) cell lines (SGC7901, MKN74, NUGC-4, HGC-27 and BGC-823) and cisplatin-resistant GC (CR-GC) cell line (SGC7901/DDP and BGC-823/DDP) were purchased from Cancer Research Institute of Beijing (China). All the cells were cultured in DMEM (Gibco, USA) containg 10% fetal bovine serum (FBS) under standard conditions (37 ℃ with 5% CO2). The GC cells were then treated with continuous low-dose cisplatin in a stepwise manner to generate acquired cisplatin-resistant GC (ACR-GC) cells in this study.
Vectors transfection
The vectors for LncRNA ADAMTS9-AS2 overexpression and silencing were obtained from YRBIO (Changsha, China). The miR-223-3p mimic and inhibitor were designed and synthesized by Sangon Biotech (Shanghai, China). The above vectors were delivered into GC cells by using the Lipofectamine 3000 reagent purchased from Invitrogen (CA, USA) according to the manufacturer’s instruction.
Real-Time qPCR
The TRIzol reagent (Invitrogen, CA, USA) was used to extract total RNA from cancer tissues and cells, the expression levels of LncRNA ADAMTS9-AS2 and miR-223-3p were determined by using the THUNDERBIRD SYBR qPCR reagent (Toyobo, Hapan) according to the manufacturer’s protocol. The perimer sequences were listed as follows: U6 (Forward: 5’-GACTATCATATGCTTACCGT-3’, Reverse: 5’-GGGCAGGAAGAGGGCCTAT-3’), LncRNA ADAMTS9-AS2 (Forward: 5’-AGGCTGAAGTTACAGGTC-3’, Reverse: 5’- TTGGCTCCCAGTGTCTTA-3’) and miR-223-3p (Forward: 5’-GAAGCTGTACCTAACATACCGTG-3’, Reverse: 5’- GATTGGTCGTGGACGTGTCG-3’).
Western Blot
The RIPA lysis buffer (Beyotime, Shanghai, China) was used to extract the total protein from cancer tissues and cells. Western Blot was conducted to determine the expression levels of proteins involved in this study according to the previous study [17]. The primary antibodies against NLRP3 (1:1000), β-actin (1:1000) and ASC (1:1500) were purchased from Abcam (UK). The protein bands were visualized by using the ECL Western Blot detection kit (GE Healthcare Bio-science, USA) in keeping with the manufacturer’s instruction and quantified by Image J software.
Cell counting kit-8 (CCK-8) assay
The cell proliferation abilities of GC cells were measured by using the commercial CCK-8 kit (AbMole, USA) according to the manufacturer’s instruction. Briefly, the cells were incubated with CCK-8 reaction solution for 4 h and the Gemini EM microplate reader (Molecular Devices, USA) was used to measure optical density (OD) values at the wavelength of 450 nm to evaluate cell proliferation.
Cell counting assay by Trypan blue staining
The GC cells were harvested and stained with Trypan blue (Sigma, USA) according to the protocol. After that, the cells were counted under optical microscope, the cells stained with blue were regarded as dead cells. The cell viability was calculated by using the following formula: cell viability (%) = live cells/total cells * 100 %.
Transwell assay
The GC cells were seeded into the upper floor of Transwell chambers (BD Biosciences, USA) with serum-free medium at the density of 5 × 10⁴ cells per well, and the lower chambers were added with culture medium containing 20 % fetal bovine serum (FBS). After 24 h incubation under the standard conditions, the invasive cells were fixed in methanol and stained with 0.1 % crystal violet to visualize the cells. The cells were observed and photographed under optical microscope.
Colony formation assay
The GC cells were harvested and cultured in 6-well plates at the density of 500 cells per well for 14 days. After that, the cells were stained with crystal violet (Beyotime, China) based on the protocol provided by the manufacturer. The cells were photographed under optical microscope (ThermoFisher Scientific, USA) and the colonies containing at least 10 cells were counted.
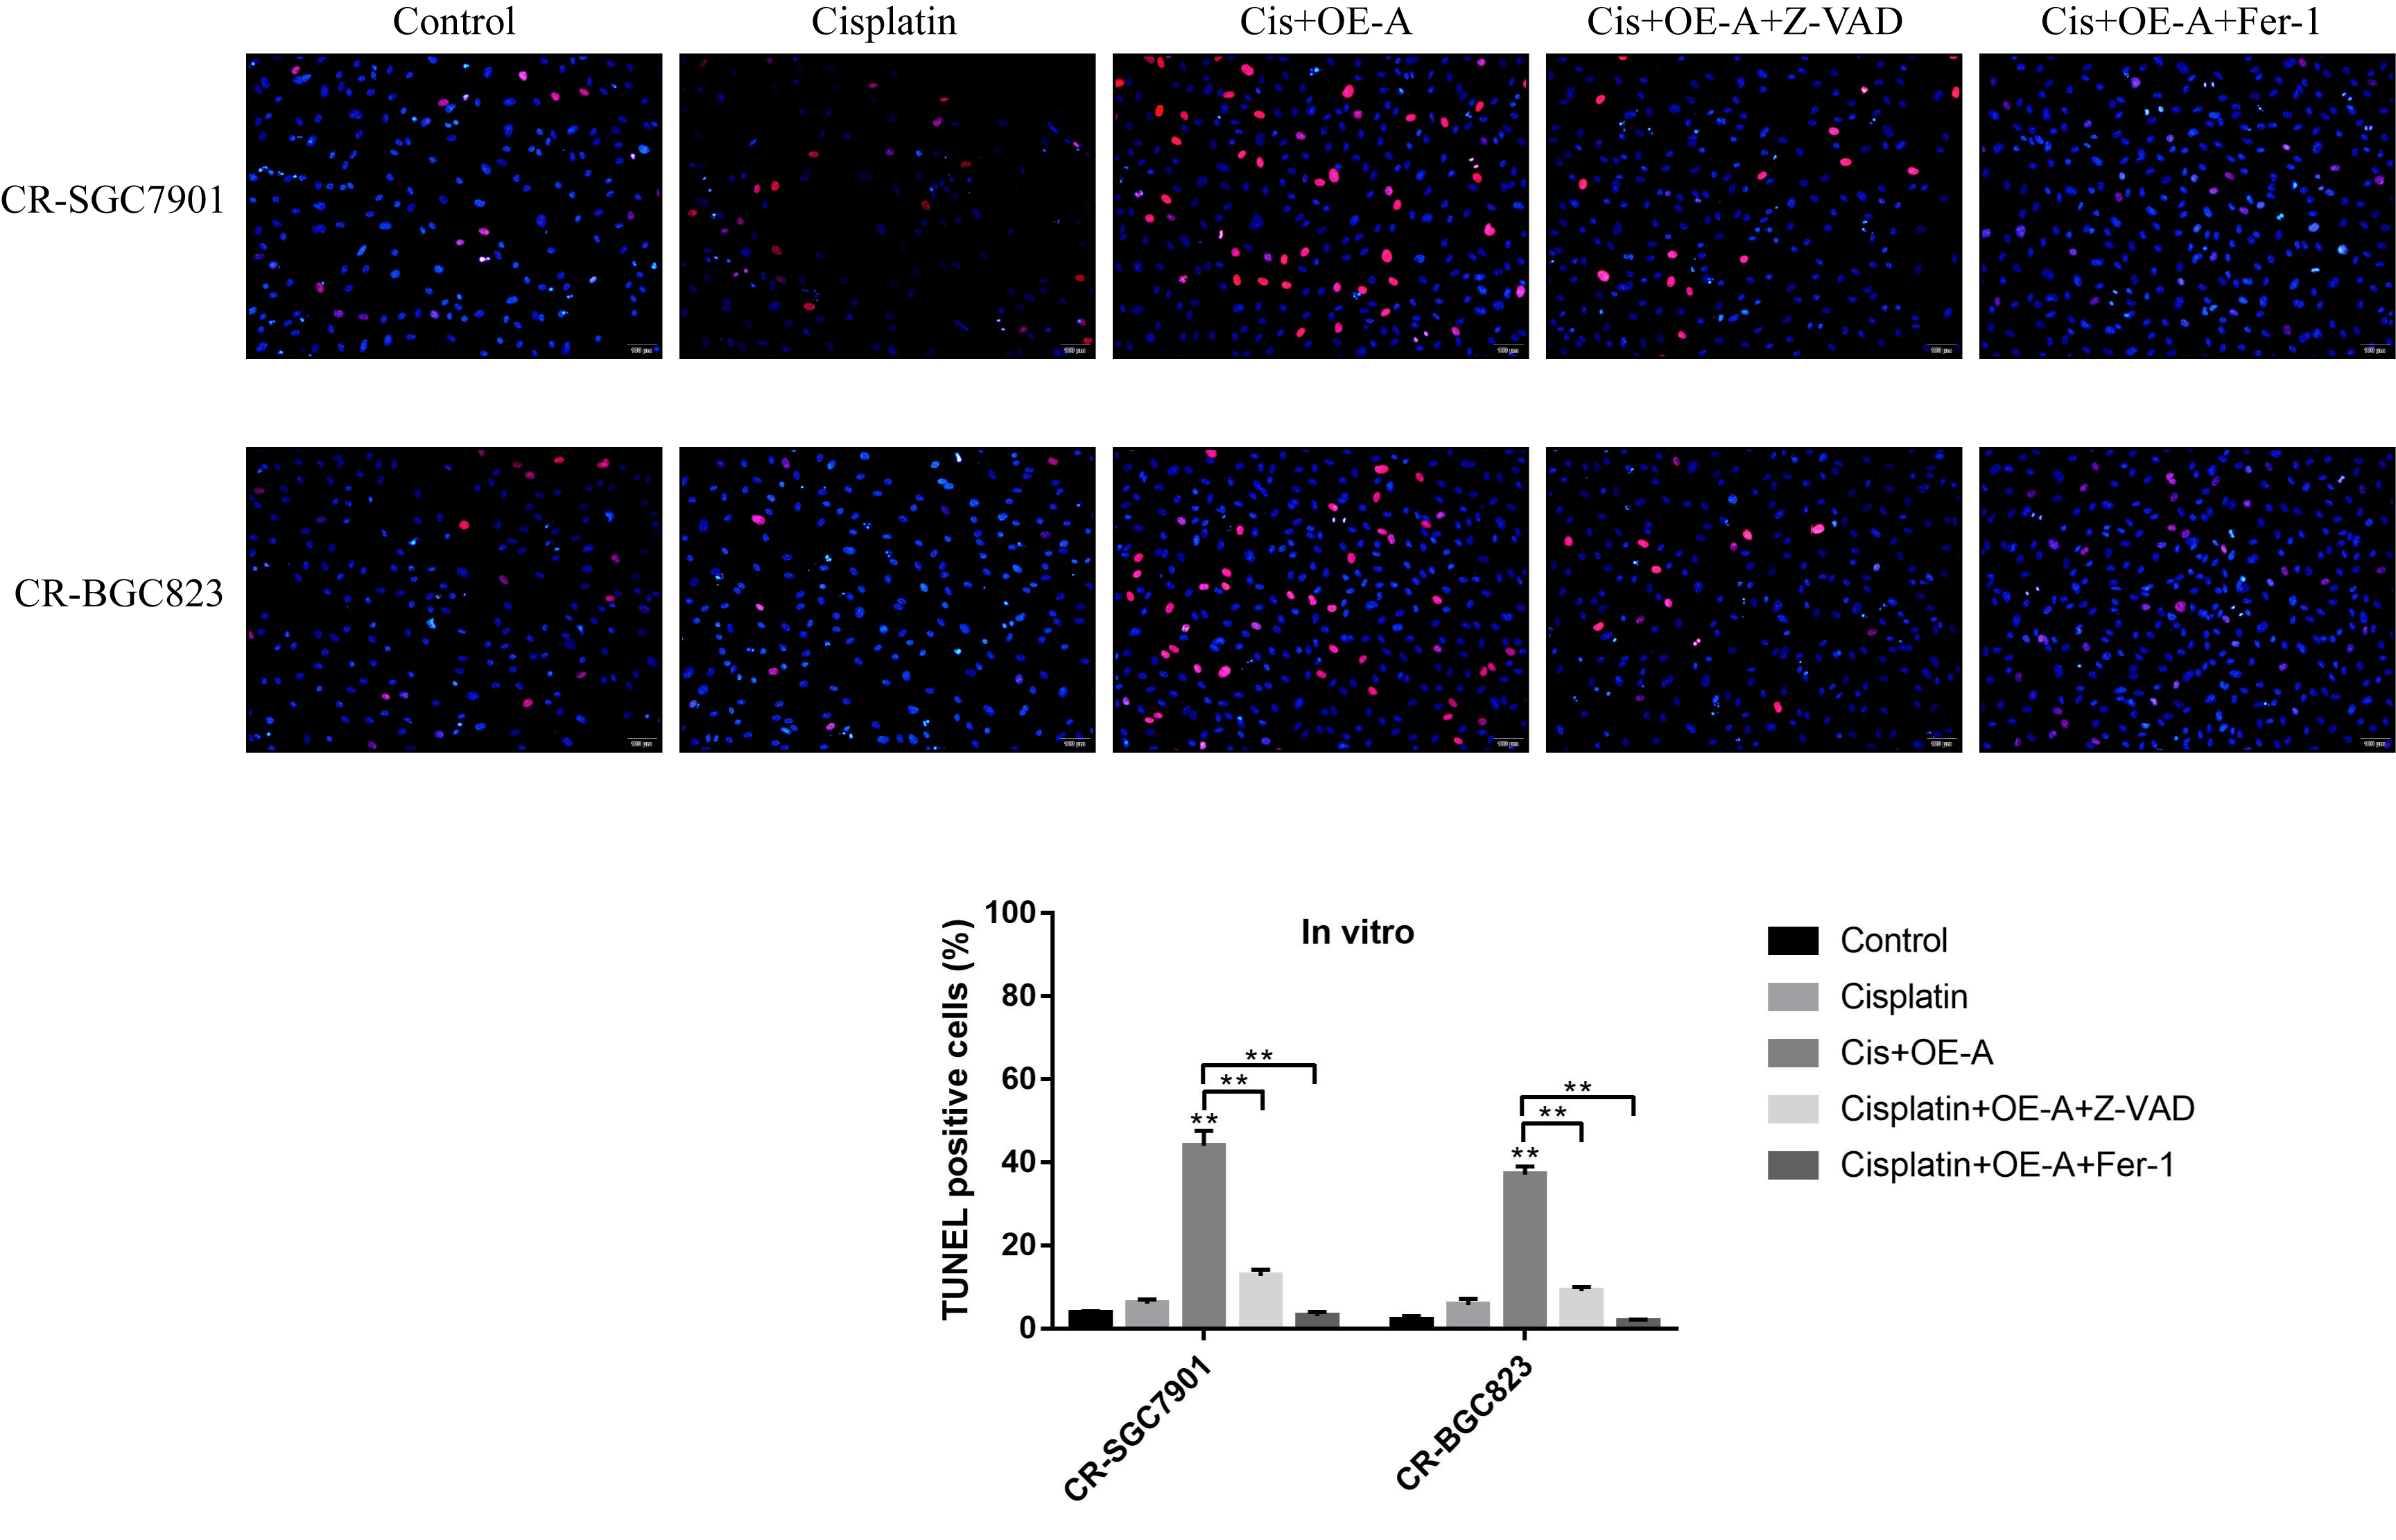
Terminal deoxynucleotidyl transferase (TdT)-mediated dUTP nick-end labeling (TUNEL) assay
The GC cells were fixed with 4 % paraformaldehyde and permeabilized with 0.1 % Triton X-100. After that, the cells were incubated with terminal deoxynucleotidyl transferase dUTP nick end labeling (TUNEL) reaction solution for 1 h at 37 ℃ without light exposure. Subsequently, the cells were co-stained with DAPI for nucleus and photographed under fluorescence microscope. The nucleus were stained in blue by DAPI, and the TUNEL positive cells were shown as red.
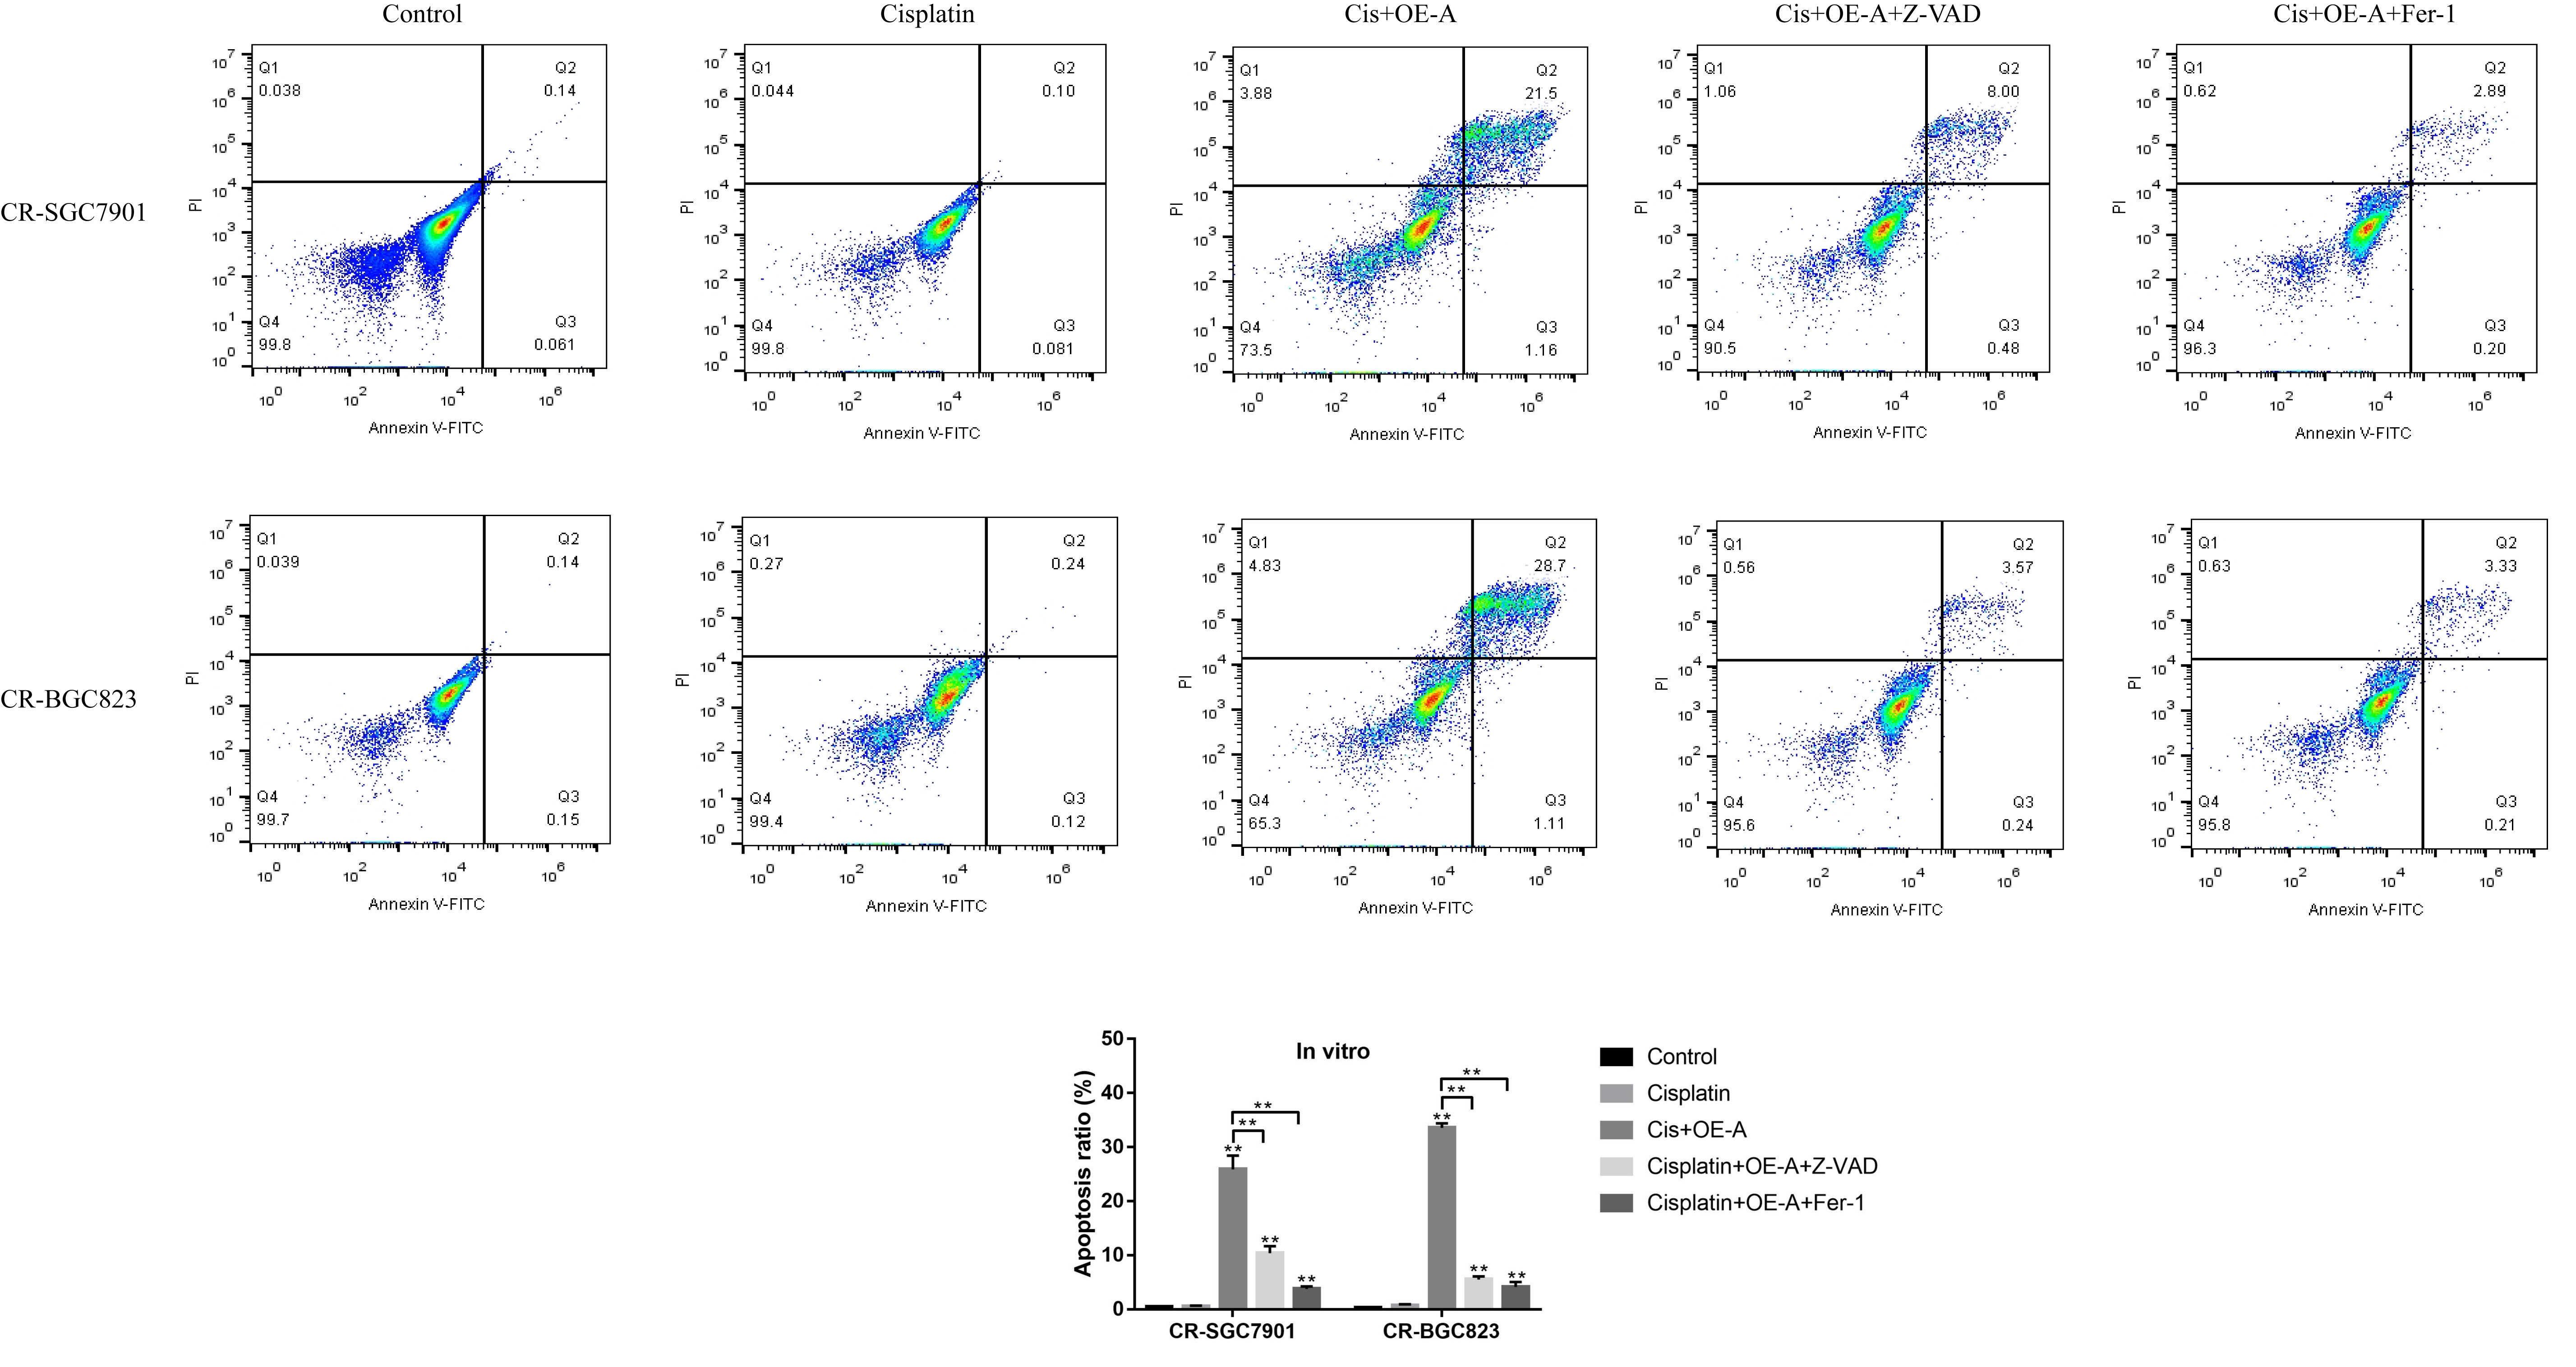
Flow cytometry (FCM)
The Annexin V-FITC/Propidium Iodide (PI) double-stain kit (BD Bioscience, USA) was employed to detect cell apoptosis ratio according to the manufacturer’s instruction. After that, the Flow Cytometry (FCM) (ThermoFisher Scientific, USA) was employed to measure cell apoptosis ratio.
Fluorescence in situ hybridization (FISH)
The RiboTM LncRNA FISH Probe Mix (RiboBio Co., Ltd., China) was employed to conduct the FISH assay to investigate the expressions and localization of LncRNA ADAMTS9-AS2 in mice cancer tissues based on the instructions provided by the manufacturer. Briefly, the mice tissues were collected and fixed with 4 % paraformaldehyde at room temperature, and susequently treated with protease K, glycine and acetylation reagent and pre-hybridization solution for 1 h at 42 ℃. After that, the LncRNA ADAMTS9-AS2 probes were incubated with the tissues at 42 ℃ overnight. Then, the tissues were stained with DAPI for nucleus. Finally, the tissues were observed and photographed under fluorescence microscope (Olympus, Japan).
Enzyme linked immunosorbent assay (ELISA)
The supernatants for GC cells and mice serum were collected, the ELISA kit was used to measure the expression levels of IL-1β and IL-18 according to the protocal provided by the producer. The HRP-labeled goat anti-rabbit IgG antibodies were used as secondary antibody. The absorbance values were detected by using the microplate reader (Molecular Devices, USA) at the wavelength of 450 nm.
Caspase-1 activity detection
The activity of caspase-1 was measured by using the Caspase-1 Activity Assay Kit (Solarbio, China) in keeping with the manufacturer’s instruction. The specimens from tissues and cells were lysed by the lysis buffer. The contents of total proteins were evaluated by Bradford method and a microplate reader was employed to examine the optical density (OD) values at the wavelength of 405 nm, which was utilized to represent caspase-1 activity according to the previous study [38].
Lactate dehydrogenase (LDH) release assay
The LDH cytotoxicity assay kit (Beyotime, China) was purchased to measure LDH release based on the protocol provided by the manufacturer. Briefly, the GC cells were administered with different treatments, and the supernants were harvested. The LDH reagent was used to detect LDH release at the wavelength of 490 nm according to the previous study [38].
Dual-luciferase reporter gene system
The wild-type (Wt) and mutant (Mut) LncRNA ADAMTS9-AS2 and 3’UTR regions of NLRP3 mRNA were synthesized and cloned into the psiCHECK-2 vectors (Promega, USA). The above vectors were co-transfected with miR-223-3p mimic and miR-NC (Sangon Biotech, China) into SGC7901 and BGC-823 cells, respectively. After 48 h incubation, the dual-luciferase reporter gene system (Promega, USA) was employed to measure relative luciferase activity based on the manufacturer’s protocol.
Pull-down assay
The biotin-labeled probes for LncRNA ADAMTS9-AS2 and 3’ UTR regions of NLRP3 mRNA were designed and synthesized by Sangon Biotech (Shanghai, China). The cells were fixed, lysed and sonicated. After centrifugation, the supernatants were used as input, and the rest part of SGC7901 and BGC-823 cells were incubated with the streptavidin Dynabeads (Invitrogen, USA) mixture containing the above probes at 30 ℃ overnight. After that, the lysis buffer and Proteinase K were employed to reverse crosslinking and release miR-223-3p, which were quantified by Real-Time qPCR.
Xenograft models
The nude mice (N = 18, age 6-8 weeks) were purchased from the Experimental Animal Center of the First Affiliated Hospital of Harbin Medical University. The CR-GC cell line (SGC7901/DDP) were subcutaneously injected into the back flank of each mouse, the LncRNA ADAMTS9-AS2 overexpression vectors were also injected into the tumor formation sites. The above mice were equally divided into 3 groups, including control group, cisplatin alone group and cisplatin plus overexpressed LncRNA ADAMTS9-AS2 group, respectively. Until tumor volume reached 1 mm3, the high-dose cisplatin (10 μg/ml) were administered for 2 weeks, the cancer tissues and serum were collected from the mice for further investigation. All the animal experiments were approved by the Animal Management Center of the First Affiliated Hospital of Harbin Medical University.
Statistical analysis
All the data involved in this study were collected and represented as Mean ± Standard Deviation (SD). The SPSS 18.0 software was used to analyse the data. Specifically, student’s t-test method was used to compare the differences between two groups. The one-way Analysis of Variance (ANOVA) method was employed to compare the differences among multiple groups. The Pearson correlation analysis was used to analyse the correlation of LncRNA ADAMTS9-AS2 and miR-223-3p in GC tissues. The prognosis for GC patients was analysed by Kaplan-Meier survival analysis. Each experiments in this study were repeated at least 3 times. The analysis results were visualized by using the Graphpad Prism 5 software. “NS” indicated “No statistical significance”, *P < 0.05 and **P < 0.01.