PCR success rate and DNA sequencing
The amplification and sequence success rate of the ITS2 sequences from sampled specimens of Musa sp., was found to be 100%. The lengths of the ITS2 sequences used for the analyses were in the range of 325-375 bp, with an average of 345 bp. The mean GC content was 60.3%, with a range of 58.3-69%.
Genetic diversity
Genetic divergences were estimated using six metrics like average inter-specific distance, the minimum inter-specific distance, theta prime, average intra-specific distance, coalescent depth and theta. The region ITS2 exhibits significant divergences at the inter-species level (Table 2) at the level of cultivars and varieties level. At the intra-specific level, relatively lower divergences were observed for all the corresponding metrics.
Assessment of barcoding gap
Interspecific versus intraspecific divergence were analysed by examining the distribution of genetic distance at a scale of 0.008 distance units. Only a slight overlap in inter and intraspecific variation was observed (Fig 1). The interspecific distance was in the range of 0.002 – 0.184 equaled 0.002 for only 0.26% and the proportion of inter-specific genetic distance < 0.135 was about 8.33%. The intraspecific distance ranged from 0.000 to 0.135, and most Musa species with more than two samples in our study had a unique sequence (58.93%) in the ITS2 region. The results indicate that evident barcoding gap between inter and intra specific divergence, thusITS2 provides a useful region to authenticate different Musa species.
Efficacy of ITS2 for authentication
ITS2 showed 97.7% and 95.8% identification success rates at the species level for 345 samples of Musa using BLAST1 and nearest genetic distance respectively. Nearly 15 cultivar and wild species were identified that are shown in the Table 3. Thus, ITS2 region exhibited high identification efficiency.
Sequence analysis and species discrimination
ITS2 sequences were collected and evaluated using MEGA (Fig 2). As a result, over 95.6% of species had larger inter-than intra-specific diversity; therefore, there were relatively clear species boundaries for ITS2 sequences. Only two species were exceptions M.schizocarpa and M. acuminata x M.textilis had very less variability of about 0.035%. ITS2 region shows higherpolymorphic sites representing higher genetic diversity in between sup species and cultivars of Musa. Unique haplotypes of Musa species and sub species were identified by using restriction enzymes like MSeI, pstI and AvaII respectively shown in the Table 5.
Nucleotide polymorphism and neutrality tests
DNA polymorphism analyses shows rich genomic variations in Musa accessions, with the total number of polymorphic sites being 112 in cultivated bananas in A genome and 33 in B genome. Nucleotide diversity (π and θ) for all cultivated and wild Musa accessions were estimated for silent, non-synonymous and total sites independently. Summaries of nucleotide diversity data for two ITS2 regions are given in Table 4. Reduced levels of polymorphism emerged as a general property of cultivated bananas relative to their wild progenitors. It represents that subspecies has slightly higher nucleotide diversity than wild and cultivated species. Thus, these findings suggest that the cultivars would not have undergone any severe genetic bottleneck during the initial domestication process. The triploid genome AAA and AAB groups also hold high levels of nucleotide diversity, representing the historical population sizes are large. The ABB genome of cultivated banana shows higher nucleotide diversity than that ofM. balbisiana (Table 4). We found that nucleotide diversity at non-synonymous sites ITS2 region was reduced in the Agenome of wild species represented as ps shown in Table 4. No polymorphic sites were observed within the cultivar and subspecies. However, it was found that the genetic diversity of AAA genome was 4-6folds higher than A genome cultivars. Additionally, the patterns of nucleotide variations in ITS2 region were examined for deviation from neutral equilibrium evolution using the Tajima’s neutrality (D) test. Thus no significant departure from the neutral model was observed.
Phylogenetic analysis
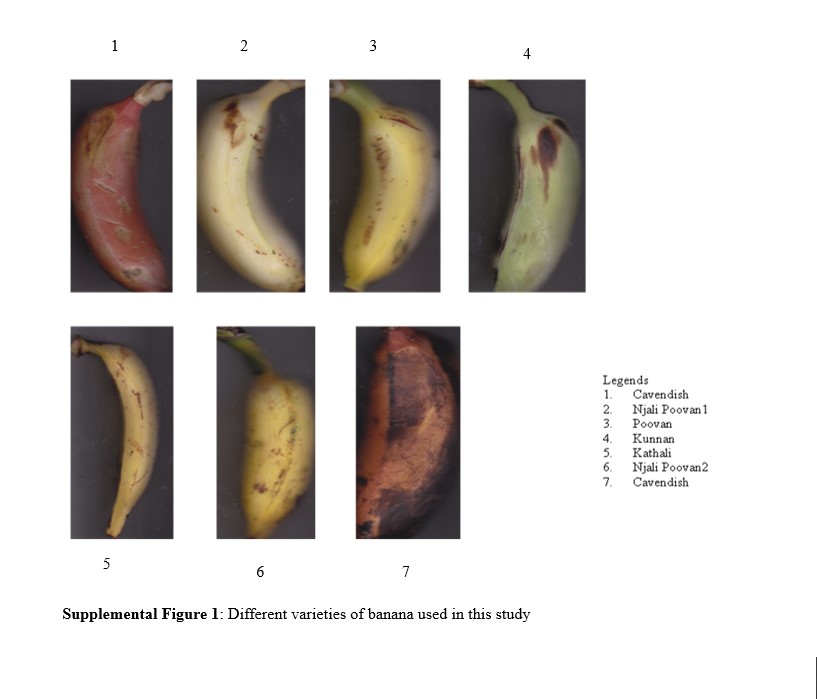
The morphological classification of Musa species is based on [11] and [41]. To analyse the phylogenetic relationship of Musa cultivar with wild species nearly 103 species were studied using Neighbour Joining (NJ) method shown in Sup Fig 1. Musa species for this study includes 60 cultivars, 5 wild species and 9 subspecies shown in the Table 3. Among 103 sequences, 31 species where taken as representative for the comparative analysis for cultivar and wild samples from the laboratory source with subspecies and hybrids from the GenBank (Fig 3). The phylogenetic tree (Fig 3) consists of three main clades A, B and C. In clade A, cultivars red banana and robusta found to be evolutionary related with wild species of M.balbisiana, M. textilis and M. schizocarpa respectively and it is highly closer with subspecies M acuminata subsp. truncata. The clade B consists of 5 cultivars Pisang linin, M. acuminata var. flava isolate,Chemmatti, Grand naine, Nadan found to be closer related with subspecies M. acuminata subsp. microcarpa and M. Banksii respectively and clade C consist of 4 cultivars Njalipoovan, Matti and Kunnan are closely related with samples wild species of M. acuminata, M. balbisiana and M. accuminatavar. Burmanicoides respectively.
From (Fig 4), the Clade I was the most complex with 50 cultivars belonging to the wild species Musa balbisiana. Six cultivar species (M.violascens, M. splendida, M. hirta, M. campestris, M. gracilis, M.salaccensis) were grouped on same taxon I. The cultivar M. beccarii and its variety were lying on taxon II. The cultivars M.peekeii and M. ingens are distinct from the cultivarM.maclayii, which shares equal taxon III. The variety M.monticola and M. barioensis lie on the same taxon IV. The four cultivar varieties, M. textilis, M. jackeyi, M. peekeli, M. troglodytanum were grouped under taxon V and the varieties M. coccinea and M.lutea found to be at the neighbouring section of taxon V. The cultivar/varieties M. rosea, M. serpentine, M.rubra, M.lateritia, M.textilis shares same allelic profiles with the wild varieties of M. balbisianaandM. accuminata. The cultivar/varieties like M. zaifei, M.siamensis and also varieties obtained by us, like Robusta, Red banana, cultivar Pisang linin, Nadan, Chemmatii, Grandnine shares allelic profile with wild species M.accuminata. The seven cultivars M.manii, M.ornata, M.yunnanensis, M. tonkinensis, M. itinerans, M. formosana, M. Viridisgrouped under the same section and shared the closer relationship with the wild species M.balbisana. The single cultivar species M.nagensium separated from the wild species of M.balbisana. Clade II consist of 5 taxon representing the four cultivar varieties like Njalipoovan, Matti, Kannan, Wild M.accuminata Var burmanicoides AA, which shares genetic relationship with wild species of M.accuminata. Clade III consist single taxon M.basjoo, which is distinct from wild species of M.accuminata and M. balbisiana as shown in Fig 4.
Data analysis using restriction enzymes
The restriction enzymes MSeI and AvaII provide the best discriminatory power to differentiate the haploids of Musa species using ITS2 sequences. MSeI shows single restriction sites for 11 genome of wild and cultivar species and 3 shows two restriction sites at different sites and AvaII one, two and three restrictions respectively.