The overuse of the herbicide nicosulfuron (NS) has become a global environmental concern. As a potential bioremediation technology, the microbial degradation of NS shows much promise; however, the detailed mechanisms of microbial taxa responding to NS exposure require further study. An isolated soil-borne bacteria Pseudomonas nicosulfuronedens LAM1902 displaying NS degradabilities was used to characterize the molecular responses to NS exposure, and LAM1902 can degrade exceed 95% of 50 mg/L nicosulfuron under the optimal conditions. Using transcriptomic sequencing, RNA-Seq results indicated that 1102 differentially expressed genes (DEGs) were up-regulated and 702 down-regulated in response to NS. Among them, “ABC transporters,” “sulfur metabolism,” and “ribosome” gene pathways were significantly enriched (p ≤ 0.05). Several gene pathways involved in the glycolysis and pentose phosphate pathways, a two-component regulation system, as well as in bacterial chemotaxis metabolisms were up-regulated under NS exposure. Surprisingly, NS exposure showed positive effects on the production of oxalic acid that is synthesized by genes encoding glycolate oxidase through the glyoxylate cycle pathway. The results suggest that P. nicosulfuronedens LAM1902 adopt acid metabolites production strategies in response to NS, with concomitant NS degradation. Meanwhile, strain LAM1902 likely grows and survives amid NS stress by increased energy production. The present studies provide a glimpse at the molecular response of microorganisms to sulfonylurea pesticide toxicity and a potential framework for future mechanistic studies.
Research Article
Molecular Response Mechanism of Pseudomonas Nicosulfuronedens LAM1902 to A Typical Sulfonylurea Herbicide Nicosulfuron
https://doi.org/10.21203/rs.3.rs-1411906/v1
This work is licensed under a CC BY 4.0 License
You are reading this latest preprint version
Pseudomonas
Nicosulfuron
Biodegradation
Transcriptome sequencing
Molecular response
China is a large agricultural country that annually produces and consumes hundreds of different pesticides 1. Nicosulfuron (NS), a typical sulfonylurea herbicide, has been widely used to eradicate different types of broadleaf grasses and weeds in agriculture 2–4. NS inhibits plant acetolactate synthase, a key feedback enzyme associated with the synthesis of branched chain amino acids such as leucine, valine, and isoleucine 5–7. Inhibited synthesis of these amino acids can lead to a rapid decrease of cell division and plant growth. Due to the extensive use of NS in agriculture and the persistence of residuals in farmland soil, NS has caused acute phytotoxicity to susceptible crops and a decrease in biodiversity 8–12. Preliminary studies showed that NS decreased wheat seed germination and emergence as low as 2 mg/kg (Li, pers. communication). Residual herbicides or their intermediates can pose severe (eco)toxicological risks, such as altering the soil microbial community, and lethality to some aquatic organisms (e.g., fish and crayfish) 13–19. Therefore, it is important to understand and evaluate the potential environmental risks of NS exposure and gain greater insight on its degradation mechanisms.
The degradation of NS by chemical hydrolysis, photolysis, and microbial activity has been reported 20, 21. Microbial degradation is considered as an environmentally friendly technology to mitigate hazardous residual concentrations of sulfonylurea herbicides in the environment 22–24. There are many bacteria and fungi harboring NS degradation ability, including Alcaligenes faecalis ZWS11 25, Bacillus subtilis YB1 26, Klebsiella sp. Y1 27, Oceanisphaera psychrotolerans LAM-WHM-ZC 28, Aspergillus niger YF1 29, Talaromyces flavus LZM1 30 and others 31, 32. Pseudomonas nicosulfuronedens LAM1902 (JCM33860, KCTC72830) (hereafter referred to as strain LAM1902) is a recently identified NS-degrading aerobic gram-negative bacterium having motile short rods with a cell size of 0.5 − 0.7 mm width and 0.8 − 1.1 mm length 33. Many studies have used these microbial strains to determine the 2-(aminosulfonyl)-N,N-dimethyl-3-pyridinecarboxamide (ASDM)) of NS degradation 32. Li et al. 33 proposed a self-protection mechanism in strain LAM1902 under NS stress using a non-targeted metabolomics approach; however, the molecular mechanism(s) underlying microbial NS degradation requires further elucidation.
The development of advanced sequencing technology allows the investigation of molecular mechanisms involved in the detoxification and adaptation of microbial strains to environmental pollutant exposure 34–36. For example, transcriptomic analysis using differentially expressed genes (DEGs) has been used to examine the gene responses to various environmental stimuli, particularly for the elucidation of genes involved in degradation 37–39. Transcriptome sequencing can provide strong support for identifying genes involved in pollutant degradation by microorganisms 40. This technique has been used to investigate the degradation mechanism(s) of sulfonylurea herbicides. For example, RNA-Seq analysis showed that chlorimuron-ethyl (a pro-herbicide for chlorimuron) degradation by Rhodococcus erythropolis D310-1 was associated with increased cytochrome P-450, carboxylesterase, and monooxygenase 41. To the best of our knowledge, there are few published reports describing the use of transcriptomic analyses for identifying the molecular mechanism(s) of NS-degrading bacterial strains.
In the present study, we hypothesize that strain LAM1902 survives NS stress by developing adaptive mechanism(s) favoring NS degradation. The specific aims of this study were to: (1) investigate the degradation conditions of NS by strain LAM1902; (2) use the transcriptome sequencing approach to identify the key metabolic pathways involved in the transcription process of strain LAM1902 following NS exposure; and (3) elucidate the adaptive mechanisms of strain LAM1902 to NS exposure.
2.1 Chemicals, reagents, and culture media
Analytical HPLC-grade nicosulfuron (NS; CAS 111991-09-4; 1-(4,6-dimethoxypyrimidin-2-yl)-3-(3-dimethylcarbamoyl-2-pyridylsulfonyl)urea), chlorimuron-ethyl (CAS 90982-32-4; ethyl 2-(4-chloro-6-methoxy-2-pyrimidinylcarbamoylsulfamoyl)benzoate), and cinosulfuron (CAS 94593-91-6; 1-(4,6-dimethoxy-1,3,5-triazin-2-yl)-3-(2-(2-methoxyethoxy)phenylsulfonyl)urea) were purchased from the Aladdin Industrial Shanghai Co., Ltd. (China). Chlorimuron-ethyl is a selective post-emergence herbicide for controlling actively growing weeds in peanut, soybeans, and non-crop areas. Cinosulfuron is a broad spectrum triazinylsulfonylurea herbicide used for post-emergence control of many weeds, including European water plantain, annual sedge, aquatic ferns, and pod weeds. These herbicides are highly water soluble and can leach from soil to groundwater and to surface water.
The Luria Bertani (LB) medium containing (in g/L) 10.0 peptone and 5.0 yeast extract (both obtained from Beijing Aoboxing Bio-tech Ltd), 10.0 NaCl and pH 7.0 was used for culturing strain LAM1902. The sulfonylurea herbicide degradation studies using strain LAM1902 were carried out according to Li et al. 33 using glucose supplemented medium (GSM) containing (in g/L) 1.0 NH4Cl, 1.0 NaH2PO4·12H2O, 0.5 KH2PO4, 0.2 MgSO4·12H2O, and 20 µL trace element solution, pH 7.0), 5 g glucose /L, and 50 mg/L of NS, chlorimuron-ethyl or cinosulfuron in distilled water 24. The trace element solution (g/L; pH 7.0) contained: 5.5 CaCl2, 50.0 EDTA, 1.1 (NH4)6MoO2 4H2O, 5.0 FeSO4 7H2O, 2.2 ZnSO4, 5.1 MnCl2 4H2O, 1.6 CuSO4 5H2O, and 1.6 CoCl 6H2O. All the chemicals and reagents (at least analytical grade) were obtained from commercial sources, as listed in Supplementary Information (Table S1).
2.2 Optimization of the nicosulfuron degradation conditions for P. nicosulfuronedens LAM1902
The degradation of NS by strain LAM1902 was determined after 6 d incubation, according to Li et al. 33. Different incubation conditions included: different sources of carbon (1.0 g/L: sodium acetate, glycerol, glucose, sodium succinate, peptone, yeast extract, sucrose, and starch) and nitrogen (1.0 g/L: NH4Cl, (NH4)2SO4, NH4H2PO4, yeast extract, and peptone), increasing from pH 5 to pH 9, increasing temperatures from 15 to 45°C, and using different volumes (0, 1, 3, 5, 7, and 10%, v/v). Different initial NS concentrations (10, 25, 50, 100, 200, or 500 mg/L GSM) were used at 30°C on a rotary shaker at 150 rpm. Based on these NS degradation optimization studies, the strain LAM1902 was incubated in 50 mg NS/L in GSM at pH 6, at 30°C, and with an incubation volume of 5%, unless otherwise specified. The residual NS concentrations (determined using HPLC analysis) were determined daily. All treatments were performed in triplicate.
2.3 Sulfonylurea herbicide degradation studies using P. nicosulfuronedens LAM1902
Chemical analysis of NS concentrations was determined according to others 28, 33 using a high-performance liquid chromatography (HPLC) system (Agilent 1200, Waldbronn city, Germany) with a 10 µL injection volume, a C18 column (50 mm ⊆ 2.1 mm), a mobile phase of acetonitrile/water/acetic acid (30/68/2, v/v/v), and a flow rate of 1.0 mL/min. The photodiode array detector had a wavelength of 245 nm and the column temperature was 30°C. Peak identification was based on our earlier paper and the HPLC peak retention time (Rt of NS was 5.6 min) of the authentic NS sample 33. The photodiode array detector had a wavelength of 210 nm and the column temperature was 30°C. The NS concentrations were determined by the standard curve. The NS degradation efficiency (%) of strain LAM1902 was calculated using Eq. 1.

where, [NS]i is the initial (i) nicosulfuron (NS) concentration (mg/L) at time (t) = 0
(d), [NS]f is the final (f) NS concentration at t = 6 d. This equation was used for the chlorimuron-ethyl and cinosulfuron degradation studies (described below).
The degradation of NS by strain LAM1902 was compared with chlorimuron-ethyl and cinosulfuron (50 mg/L) after 6 d incubation at pH 6, 30°C, using a 5% incubation volume. The negative control group was incubated with autoclaved sterilized LAM1902 cells (abiotic control). The residual concentrations (determined using HPLC analysis) and cell growth (OD600) were determined daily for six days. The chlorimuron-ethyl and cinosulfuron concentrations were determined HPLC using an injection volume of 10 µL and a C18 column (50 mm ⊆ 2.1 mm). For chlorimuron analysis, the mobile phase was mixture of methanol/water/acetic acid (67/32/1, v/v/v, flow rate of 1.0 mL/min) and a photodiode array detector set at 236 nm, and a column temperature of 30°C. For the cinosulfuron studies, the HPLC used a photodiode array detector at 240 nm, with a column temperature at 28°C; the mobile phase was a mixture of acetonitrile/methanol/water/acetic acid (45/15/40/0.1, v/v/v, flow rate of 1.0 mL/min). The respective Rt of chlorimuron-ethyl and cinosulfuron were respectively 10 min and 6 min, using authentic reference samples. The % efficiency of strain LAM1902 to degrade chlorimuron-ethyl and cinosulfuron was calculated using Eq. 1.
2.4 Identification of oxalic acid production and the degradation effect on nicosulfuron.
The oxalic acid produced by strain LAM1902 in GSM medium were identified by HPLC with an injection volume of 10 µL. The mobile phase was mixture of ammonium dihydrogen phosphate (0.02 mM, pH 2, adjusted with H3PO4) and methanol (85:15 by volume, flow rate of 1.0 mL/min). The photodiode array detector had a wavelength of 210 nm and the column temperature was 30°C. And the degradation effect on nicosulfuron oxalic acid (200 mg/L) were compared with strain LAM1902. All treatments were performed in triplicate.
2.5 Total RNA isolation and sequencing
P. nicosulfuronedens LAM1902 was incubated in the GSM medium at 3% (v/v) (i.e., 3 mL strain LAM1902 plus 97 mL GSM) in presence of 50 mg NS/L, which served as the experimental group (YG). In parallel, the culture was grown at absence of NS and was considered as a control group (NG) 42. After culturing for 3 d (the logarithmic growth phase of strain LAM1902) at 30°C and at 160 rpm in the dark, the samples were centrifuged at 8000 rpm (Sigma, Germany) for 10 min. The pellet was washed three times with 130 mM phosphate buffer (pH 7.2), then quickly frozen in liquid nitrogen, and stored at -80°C. All experiments were conducted in triplicate.
Total RNA was extracted using commercial kits following the manufacturer’s instructions (Ambion, Foster City, CA). RNA degradation and contamination were monitored on 1% agarose gels. RNA quantity was measured using Qubit 2.0 (Thermo Fisher Scientific, MA, USA) and Nanodrop One (Thermo Fisher Scientific, MA, USA). RNA integrity was detected using the Agilent 2100 system (Agilent Technologies, Waldbronn, Germany).
Whole mRNAseq libraries were generated by Guangdong Magigene Biotechnology (Guangzhou, China) using the NEB Next Ultra Directional RNA Library Prep Kit for Illumina (New England Biolabs, MA, USA) following the manufacturer’s recommendations. Briefly, the 16S ribosomal RNA (rRNA) transcripts in total RNA samples were reduced by the Ribo-Zero rRNA removal kit. Fragmentation was carried out using the NEBNext RNA First Strand Synthesis reaction buffer. The first strand cDNA was synthesized using a random hexamer primer and M-MuLV Reverse Transcriptase (RNase H). For synthesizing the second strand of cDNA, a chain-specific library was constructed by replacing dTTP with dUTP to improve the accuracy of results. The remaining overhangs were converted into blunt ends via exonuclease/polymerase activities. After adenylation of 3’ ends of DNA fragments, NEBNext Adaptor with its hairpin loop structures were ligated in preparation for hybridization. To choose cDNA fragments of preferentially 150 ~ 200 bp in length, the fragments were selected using AMPure XP beads (Beckman Coulter, Beverly, USA). PCR was then performed with Phusion High-Fidelity DNA polymerase, Universal PCR primers and Index (X) Primer (Premier Biosoft International, Palo Alto, USA). PCR products were purified with AMPure XP beads and the library insert size was assessed on the Agilent 2100 system (Agilent Technologies, Waldbronn, Germany). The clustering of the index-coded samples was performed on a cBot Cluster Generation System. The sequencing library was operated and sequenced on the Illumina Hiseq Xten platform by Guangdong Magigene Biotechnology (Guangzhou, China). Libraries for transcriptome analysis were established by using RNA collected from the YG and NG groups.
2.6 Analysis of RNA-Seq data
The fastq format raw data were treated with Trimmomatic (v.0.36) to obtain the clean reads 43, with mapping to NCBI Rfam databases for removing the rRNA sequences by Bowtie2 (v2.33). The residual mRNA sequences were compared with the reference genome using Hisat2 (2.1.0) 44. The read count and function of each gene was obtained using HTSeq-count (v0.9.1). The reads per kilobase per million for each gene was used to compare the expression level of genes among the experimental and control groups. The read count of each gene (acquired from HTSeq-count) was mainly used for analyzing the differential expression. The DEGs between two groups were identified using the edgeR (v3.16.5) 45–47. The GO and KEGG enrichment analyses of DEGs were performed by the cluster Profiler software (v3.4.4) to analyze their potential biological pathways 48.
2.7 Statistical analyses
Data was analyzed using one-way analysis of variance (ANOVA) and SPSS software (ver.18.0, SPSS Inc., Chicago, IL, United States). The resulting p-value was adjusted for judging the false discovery rate. Genes with the false discovery rate correction, p ≤ 0.05, and |log2 (fold change)| ≥ 1 were taken as the candidates of DEGs. The GO terms and KEGG pathways with p ≤ 0.05 were identified as significantly enriched by DEGs.
2.8 Data availability
All the RNA-seq data have been deposited in the NCBI Sequence Read Archive (SRA) database (accession number: PRJNA785098).
3.1 Optimization of the nicosulfuron degradation conditions for LAM1902
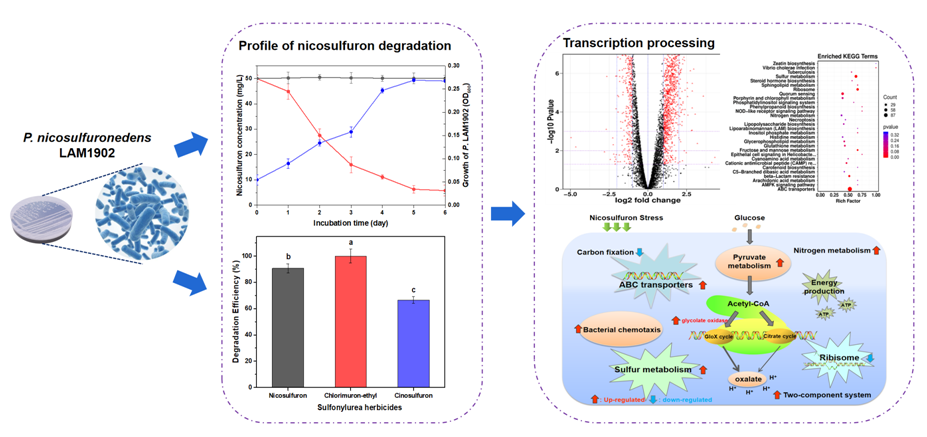
The effects of various factors (including the different C- and N- sources, pH, temperature, and the initial incubation volume) on NS degradation by LAM1902 were determined. Figure 1 summarizes the effects of different C- and N- sources, temperature (30–45°C), pH 5 to pH 9, and substrate concentration on NS degradation after 6 d incubation. Concentration – response studies showed that the NS degradation efficiency of strain LAM1902 was 99% after 6 d incubation with 25 mg NS/L, whereas incubation at 500 mg/L (the highest concentration tested) was toxic to the microbes as evidenced by a significant inhibition of cell growth (p ≤ 0.05) and a decrease (47%) in the NS degradation efficiency (Fig. 1f). Data indicates that the 6 d-NS degradation efficiency of strain LAM1902 was 95%, with a cell density OD600 was 0.27 (Fig. 2, left panel). Strain LAM1902 showed similar efficiencies to degrade other sulfonylurea herbicides, such as chlorimuron-ethyl and cinosulfuron (Fig. 2, right panel). These data suggest that the strain LAM1902 can also degrade NS as well as other sulfonylurea herbicides (chlorimuron-ethyl and cinosulfuron), indicating that this strain has metabolic capabilities. Its broad-spectrum of sulfonylurea herbicide degradation can be used to develop microbial strategies or mechanisms mitigating the toxic effects of sulfonylurea herbicides on the environment. As a first approach to investigate these mechanisms, studies were undertaken to characterize the transcriptomic response of strain LAM1902 to NS exposure.
3.2 RNA-Seq analysis of the strain LAM1902 transcriptome during NS degradation
The Illumina Hiseq Xten sequencing provided a total of 10277078 and 10166956 clean reads for the YG experimental (using NS) and NG control (without NS) groups, respectively. More than 98% of transcripts had a size above 20 bp in both groups. The YG and NG groups showed ≥ 94% and ≥ 96% of specific sequences, respectively (Table S2). Principal component analysis (PCA) confirmed the differences between the YG and NG groups (Fig. S1). The analysis of these transcripts were used to identify genes involved in NS biodegradation and better understand the mechanisms underlying the microbial response(s) to NS.
3.3 Differential gene expression of strain LAM1902 in response to the presence of NS
A total of 6021 expressed genes were identified. Among them, 1804 genes were considered as DEGs (p ≤ 0.05 and |log2(fold change)| ≥ 1) in the YG and NG groups, including 1102 up-regulated DEGs (61%) and 702 down-regulated DEGs (39%) (Fig. 3). The up-regulated expression genes promoted the metabolism of NS, while the down-regulated DEGs probably correspond to the toxic effects of NS on strain LAM1902 49. The distribution of the top 30 most expressed genes in both groups is shown Fig. S2.
3.4 GO and KEGG enrichment analyses of DEGs
To determine the metabolism processes of LAM1902 induced in response to NS, the DEGs were annotated and classified according to the GO and KEGG databases. The DEGs were distributed to “cell part,” “catalytic activity,” “cellular process,” “metabolic process,” and “binding” categories based on the GO database (Fig. S3). According to the KEGG database, a total of 757 DEGs were dispatched within 200 pathways, including “environmental information processing,” “cellular processes,” “genetic information processing,” “human diseases,” “metabolism,” and “organismal systems.” Among these, “metabolism” was the main (57%) metabolic pathways (in KEGG A class), whereas a total of 159 and 89 DEGs were related to the “carbohydrate metabolism” and “xenobiotics biodegradation and metabolism,” respectively.
According to the KEGG enrichment analyses, DEGs were significantly enriched in “ABC transporters,” “sulfur metabolism,” and “ribosome” pathways (p ≤ 0.05) (Fig. 4 and Table S3), belonged to the categories including “membrane transport,” “translation,” and “energy metabolism.” A total of 115, 49, and 36 DEGs respectively were associated with these pathways. All DEGs involved in “ribosome” pathway indicated that the “ribosome” pathway might play a negative role in response to NS. In contrast, DEGs involved in “ABC transporters” (94 up-regulated and 21 down-regulated genes) and “sulfur metabolism” (44 genes up-regulated and five down-regulated genes) pathway were generally up-regulated after NS exposure. The “ABC transporters” can transform and transport toxic substances through cell membrane to support cellular defense systems 50−52. This pathway also plays an important function in the drug resistance, metabolism, and toxicity 53. Furthermore, sulfur is an important nutrient for the growth of microorganisms and participates in electron transport and cell regulation. The above results reveal that the up-regulated genes involved in “ABC transporters” and “sulfur metabolism” pathways may play positive roles in response to the NS exposure.
3.5 Metabolic pathway analysis of the response of strain LAM1902 to NS stress
Use of NS as a microbial energy source of C- and N- is limited because of the molecular structure of NS and its high toxicity 31. Earlier studies have suggested that NS degradation could be accomplished using co-supplementation with C- and N- sources 40, to provide energy for microorganisms to survive in the NS-containing culture/incubation medium. In the present study, many DEGs in strain LAM1902 were involved in energy production (based on KEGG database annotation), and included glycolysis, gluconeogenesis, pentose phosphate pathway, glyoxylate and dicarboxylate metabolism, tricarboxylic acid (TCA) cycle, and other major metabolism pathways (Table 1). These pathways can produce and store abundant energy and would be important in cellular adaptation to NS stress 39. Therefore, the expression of the genes involved in these pathways requires further study.
Twelve up-regulated DEGs were involved in pyruvate metabolism in the YG groups (ko00620), which can catalyze the ADP to ATP and enhance the glycolysis activity 54. During the metabolism of glycolysis, one mole of glucose can be broken down into two moles of pyruvate, which could be metabolized to acetyl-CoA under aerobic conditions. The acetyl-CoA can enter the TCA cycle, in which organisms can obtain energy in response to the NS stress 55. Ten DEGs involved in glycolysis or gluconeogenesis pathway were identified (Table 1). Under the exposure to NS, strain LAM1902 can alter its activities during glycolysis and the TCA cycle as an adaptation to environmental stress. Similar changes of glycolysis have been found in other microorganisms exposed to environmental stress 56.
The pentose phosphate pathway involves the oxidative decomposition of glucose, which can be directly oxidatively dehydrogenated and decarboxylated 57. It is a common carbohydrate catabolic pathway in microbes, animals, and plants 58. In addition to the energy provided by the pentose phosphate pathway, some intermediate products are generated from this pathway that can provide substrates for the biosynthesis of many substances, such as 5-P-ribose, nucleotides, 4-P-erythrose, and aromatic amino acids. On the other hand, this pathway also produces a large amount of NADPH for the synthesis of fatty acids and sterols 40. In the present study, five up-regulated DEGs of the pentose phosphate pathway (ko00030) were identified, which may be responsible for providing NADPH for amino acid and fatty acid metabolism in strain LAM1902. An interesting result was that the total genes related to fatty acid degradation was higher than the fatty acid synthesis. The degradation of fatty acids provides energy for microbial growth and survival. The result may be related to the increased energy demand to ensure the growth of strain LAM1902 under the exposure of NS.
|
KEGG annotation |
A_Class |
B_Class |
Up-related genes |
Down-related genes |
ko_ID |
|---|---|---|---|---|---|
|
ABC transporters |
Environmental Information Processing |
Membrane transport |
94 |
21 |
ko02010 |
|
Sulfur metabolism |
Metabolism |
Energy metabolism |
44 |
5 |
ko00920 |
|
Ribosome |
Genetic Information Processing |
Translation |
0 |
36 |
ko03010 |
|
Carbon fixation in photosynthetic organisms |
Metabolism |
Energy metabolism |
1 |
2 |
ko00710 |
|
Carbon fixation pathways in prokaryotes |
Metabolism |
Energy metabolism |
3 |
7 |
ko00720 |
|
Central carbon metabolism in cancer |
Human Diseases |
Cancers: Overview |
2 |
0 |
ko05230 |
|
One carbon pool by folate |
Metabolism |
Metabolism of cofactors and vitamins |
1 |
1 |
ko00670 |
|
Nitrogen metabolism |
Metabolism |
Energy metabolism |
13 |
3 |
ko00910 |
|
Citrate cycle (TCA cycle) |
Metabolism |
Carbohydrate metabolism |
0 |
10 |
ko00020 |
|
Pyruvate metabolism |
Metabolism |
Carbohydrate metabolism |
12 |
3 |
ko00620 |
|
Glycolysis/Gluconeogenesis |
Metabolism |
Carbohydrate metabolism |
5 |
5 |
ko00010 |
|
Pentose phosphate pathway |
Metabolism |
Carbohydrate metabolism |
5 |
3 |
ko00030 |
|
Fatty acid biosynthesis |
Metabolism |
Lipid metabolism |
7 |
6 |
ko00061 |
|
Fatty acid degradation |
Metabolism |
Lipid metabolism |
12 |
8 |
ko00071 |
|
Two-component system |
Environmental Information Processing |
Signal transduction |
54 |
40 |
ko02020 |
|
Bacterial chemotaxis |
Cellular Processes |
Cell motility |
8 |
1 |
ko02030 |
Furthermore, a prominent finding of the present study was the enhanced expression of a two-component regulation metabolism involving a total 94 DEGs, based on the KEGG database (Table 1). The two-component signal transduction system enables microorganisms to sense, respond, and adapt to the changes in many different environmental conditions, and thereby allowing strains to make a corresponding stress response to maintain their health under harsh conditions. Ganesh et al. reported that the abundance of genes associated with the two-component regulation system was important for microorganisms to survive in the harsh environment 59. Overall, the enhancement of the two-component regulation process in strain LAM1902 likely underlies (at least in part) the adaptation process to NS exposure.
In addition, nine DEGs related to “bacterial chemotaxis” were revealed with KEGG annotation, including eight up-regulated genes and one down-regulated gene in response to NS (Table 1). The up-regulation genes involved in “bacterial chemotaxis” may have an important effect on the NS degradation of strain LAM1902. The genes of “bacterial chemotaxis” were the main part of bacterial adjustment system. Microbes express these genes to induce their migration towards the pollutants as part of their resistance mechanism to exposure to contaminated environments. Microbes would therefore become stronger by promoting these adaptive and degrading abilities 41. Zhao also found that the genes related to “bacterial chemotaxis” play a pivotal role in chemical resistance of strain Stenotrophomonas maltophilia 60. It is possible that “bacterial chemotaxis” genes may provide strain LAM1902 with a stronger adaptability to the exposure of NS stress. Furthermore, 20 up-regulated genes associated with flagella assembly were determined in strain LAM1902, which suggests that this strain can target and degrade NS and/or adapt to the contaminated environment. Data revealed several up-regulated genes associated with C- and N- metabolism, glycolysis, TCA cycle, and bacterial chemotaxis, which would benefit microbial survival in harsh environments by metabolic adaptation (Fig. 5).
The involvement of genes and enzymes during the degradation of sulfonylurea herbicides have been discussed elsewhere 13, 61, 62. However, the genes involved in the degradation of NS were rarely studied 28. The strain LAM1902 transcriptome results were used here to investigate the possible NS degradation genes. It was interesting that the involvement of hydrolase and monooxygenase in sulfonylurea herbicide degradation 41 was not observed in the transcription process of strain LAM1902 of our study. The genes associated with cytochromes P-450 were down-regulated (YG) compared to the control groups (NG), and only one gene encoding carboxylesterase was detected, whereas there was no significant difference between YG and NG groups (p > 0.05) (Table 2). On the other hand, the top 10 genes with significant differences between YG and NG groups (Table S4) were generally related to cellular energy metabolism, suggesting that NS stimulation had a strong effect on the energy metabolism of strain LAM1902 and a weak effect on the corresponding expression of genes involved in NS degradation.
3.6 Organic acid metabolism analysis of the response of strain LAM1902 to NS stress
Strain LAM1902 produces oxalic acid (< 200 mg/L) during the NS degradation after 7 days (Fig. 6a). In order to verify the degradation effect of oxalic acid, we compared the nicosulfuron degradation by oxalic acid (200 mg/L) with strain LAM1902 (Fig. 6b). The results showed oxalic acid had the degradability of NS. Two synthetic pathways for oxalic acid in LAM1902 cells were proposed: the glyoxylate cycle and oxaloacetate synthesis pathways. Among them, glycolate oxidase and oxaloacetate lyase are the key enzymes in the synthesis pathway of oxalate. The expression of genes encoding glycolate oxidase and oxaloacetate lyase under NS condition (YG group) with those in the control condition (NG group) were compared and analyzed. Under the NS condition, glycolate oxidase was encoded by two up-regulated gene (LAM1902_ctg003_orf00224 and LAM1902_ctg003_orf00221, p ≤ 0.05), whereas DEGs encoding oxaloacetate lyase were not detected (Table 2). These results indicated that NS exposure showed a positive effect on the synthesis of glycolate oxidase, which would then promote the production of oxalic acid. The present results indicate that the synthesis of oxalic acid by strain LAM1902 under NS stress was mainly performed by the glyoxylate cycle pathway.
|
Gene_ID |
count_YG |
count_NG |
p-value |
Annotation |
|---|---|---|---|---|
|
LAM1902_ctg043_orf00049 |
82 |
20 |
0.19579705 |
carboxylesterase |
|
LAM1902_ctg048_orf00055 |
140 |
505 |
3.59E-25 |
cytochrome P450 |
|
LAM1902_ctg003_orf00224 |
118 |
46 |
0.000204088 |
glycolate oxidase subunit GlcE |
|
LAM1902_ctg003_orf00221 |
145 |
66 |
0.000681792 |
glycolate oxidase subunit GlcF |
It should be noted that the concentration of the sulfonylurea herbicide residuals in soil is relatively low in the real environment and the use of multiple herbicides is a common practice 18. In the present study, strain P. nicosulfuronedens LAM1902 can degrade multiple sulfonylurea herbicides (NS, chlorimuron-ethyl, and cinosulfuron, 50 mg/L) in the incubation medium. In addition, the strain LAM1902 can tolerate and degrade NS under 500 mg NS/L exposure 33, 24. This strain could be used as a mechanistic tool to extrapolate results from laboratory bioassays (liquid condition) to the field (soil condition) to better understand the bioremediation of sulfonylurea herbicide residues in the real environment. However, before application, it is necessary to investigate the degradation and response mechanisms of strain LAM1902 under NS stress. The present study addresses this need by using transcriptomic analysis and fills the current knowledge gap of the environmental impact of NS on microbes. We provide here an invaluable theoretical basis for the development of future NS biodegradation strategies for the treatment of NS-contaminated soil.
Zhang et al. studied the NS remediation ability of Bacillus subtilis YB1 in the indoor soil and reported that this strain has little effect on the composition of indigenous rhizosphere microbial community (i.e., microbial biodiversity) 64. It is challenging to compare the Zhang et al. 64 results to the present study, due to differences in scale (from laboratory cultures to growth in soil field studies) and the possible involvement of biogeochemical processes governing bioavailability, sorption, microbial competition, etc. Further study into the NS degradation ability of strain LAM1902 in soil is warranted. It should also be noted that ADMP (a common metabolite of nicosulfuron) is 20 times more toxic than the parent NS 65, so greater attention should be paid to the molecular mechanisms of NS toxicity and environmental risk assessment of the transformation products during NS degradation under actual conditions.
The ability of strain P. nicosulfuronedens LAM1902 to degrade sulfonylurea herbicides NS, chlorimuron-ethyl, and cinosulfuron was evaluated. Data showed that strain LAM1902 had a broad-spectrum effect on sulfonylurea herbicide degradation. Transcriptomic analysis was performed to assess the response and adaptation of P. nicosulfuronedens LAM1902 strain to NS exposure. Transcriptomic analyses of NS-adapted strain LAM1902 indicated that several DEGs were enriched in the “ABC transporters,” “sulfur metabolism,” and “ribosome” pathways, implying their participation in the survival of LAM1902 under the NS stress. Several up-regulated DEGs involved in many metabolic processes in LAM1902 included “carbon and nitrogen metabolism,” “glycolysis or gluconeogenesis pathway,” “pentose phosphate pathway,” and “bacterial chemotaxis.” Moreover, NS exposure showed a positive effect on the genes encoding glycolate oxidase, which is responsible for oxalic acid production via the glyoxylate cycle pathway. Our results imply that strain LAM1902 has developed the acid metabolites production strategies during the biotransformation and detoxification of NS. As a consequence, energy production is required during the degradation and adaptation of strain LAM1902 with NS stress. Finally, the present study provides an invaluable theoretical basis for the development of future NS biodegradation strategies and environmental risk assessment.
Acknowledgments
This research was partially supported by the National Natural Science Foundation of China (32070004, 31670006, and 41720104007), the Major National R & D Projects for the Chinese Ministry of Science and Technology (2019YFC1803500), and the 1000-Talents plan (WQ2017110423). This study was also supported by the Fundamental Research Funds for Central Non-profit Scientific Institution (1610132020009), Central Public-interest Scientific Institution Basal Research Fund (Y2021GH18), and Key Laboratory of Microbial Resources Exploitation and Application of Gansu Province (2019cx-04). We also acknowledge the support of the Centre National de la Recherche Scientifique (CNRS PRC1416, France).
Author contributions
Miaomiao Li: Conceptualization, Methodology, Resources, Data Curation, Visualization, Formal analysis, Writing - original draft, Writing – review & editing. Qingqing Li: Data Curation, Writing – review & editing. Jun Yao: Conceptualization, Methodology, Writing – review & editing, Funding acquisition. Geoffrey Sunahara: Conceptualization, Data Curation, Visualization, Writing – review & editing. Robert Duran: Writing – review & editing. Qinghua Zhang: Writing – review & editing. Zhiyong Ruan: Conceptualization, Methodology, Writing – review & editing, Funding acquisition.
Conflicts of interest: The authors declare that there are no conflicts of interest.
- Chen, X. M., Wang, C. L., Bo, R., 2016. Current situation of Chinese pesticide application and policy suggestions. Pesticide Science and Administration. 37(2): 4-8. (Chinese)
- Lum, A.F., Chikoye, D., Adesiyan, S.O., 2004. Evaluation of nicosulfuron for control of speargrass [Imperata cylindrica (L.) Raeuschel] in Nigeria. Int. J. Pest Manage. 50, 327-330. (doi: 1080/09670870400000382)
- Sikkema, P.H., Kramera, C., Vyn, J.D., Kells, J.J., Hillger, D.E., Soltani, N., 2007. Control of Muhlenbergia frondosa (wirestem muhly) with post-emergence sulfonylurea herbicides in maize (Zea mays). Crop Prot. 26 (10), 1585-1588. (doi: 1016/j.cropro.2007.02.006)
- De Lafontaine, Y.D., Beauvais, C., Cessna, A.J., Gagnon, P., Hudon, C., Poissant, L., 2014. Sulfonylurea herbicides in an agricultural catchment basin and its adjacent wetland in the St. Lawrence River basin. Sci. Total Environ. 479-480, 1-10. (doi: 1016/j.scitotenv.2014.01.094)
- Battaglin, W.A., Furlong, E.T., Burkhardt, M.R., Peter, C.J., 2000. Occurrence of sulfonylurea, sulfonamide, imidazolinone, and other herbicides in rivers, reservoirs and groundwater in the midwestern United States, 1998. Sci. Total Environ. 248, 123-133. (doi: 10.1016/S0048-9697(99)00536-7)
- Zawoznik, M.S., Tomaro, M.L., 2005. Effect of chlorimuron-ethyl on Bradyrhizobium japonicum and its symbiosis with soybean. Pest Manag. Sci. 61 (10), 1003-1008. (doi: 1002/ps.1077)
- Tan, H.B., Xu, M.K., Li, X.Y., Zhang, H.W., Zhang, C.G., 2013. Effects of chlorimuron-ethyl application with or without urea fertilization on soil ammonia-oxidizing bacteria and archaea. J. Hazard. Mater. 260, 368-374. (doi: 1016/j.jhazmat.2013.05.043)
- Johnson, D.H., Jordan, D.L., Johnson, W.G., Talbert, R.E., Frans, R.E., 1993. Nicosulfuron, primisulfuron, imazethapyr, and DPX-PE350 injury to succeeding crops. Weed. Technol. 7 (3), 641-644. (jstor.org/stable/3987704)
- Greenland, R.G., 2003. Injury to vegetable crops from herbicides applied in previous years. Weed. Technol. 17, 73-78. (doi: 10.1614/0890-037X(2003)017[0073:ITVCFH]2.0.CO;2)
- Sikkema, P.H., Soltani, N., McNaughton, K., Robinson, D.E., 2006. Broccoli, cabbage and cauliflower tolerance to sulfonylurea herbicides. Crop Prot. 25 (3), 225-229. (doi: 1016/j.cropro.2005.04.011)
- Azimi, M., Ramezani, K., Alimoradi, L., 2014. Investigation of phytotoxicity and stability of residuals, nicosulfuron and rimsulfuran on wheat grown on two soil types. Int. J. Adv. Biol. Biomed. Res. 2 (7), 2259-2263. (doi: http://www.ijabbr.com/article_7996_0.html)
- Silva, F.B., Costa, A.C., Müller, C., Nascimento, K.J.T., Domingos, M., 2020. Dipteryx alata, a tree native to the Brazilian Cerrado, is sensitive to the herbicide nicosulfuron. Ecotoxicology. 29, 217-225. (doi: 10.1007/s10646-019-02154-7)
- Brown, H.M., Joshi, M.M., Van, A.T., Carski, T.H., Doughty, J., 1997. Degradation of thifensulfuron-methyl in soil: role of microbial carboxyesterase activity. J. Agric. Food Chem. 45 (3), 955-961. (doi: 10.1021/jf9604145)
- Kreutz, L.C., Barcellos, L.J.G., Silva, T.O., 2008. Acute toxicity test of agricultural pesticides on silver catfish (Rhamdia quelen) fingerlings. Ciênc Rural. 38, 1050-1055. (doi: 10.1590/S0103-84782008000400022)
- Cook, M.E., Moore, P.A., 2008. The effects of the herbicide metolachlor on agonistic behavior in the crayfish, Orconectes rusticus. Arch Environ Contam Toxicol. 55, 94-102. (doi: 1007/s00244-007-9088-z)
- Zhang, X.L., Li, X., Zhang, C.G., Li, X.Y., Zhang, H.W., 2011. Ecological risk of long-term chlorimuron-ethyl application to soil microbial community: An in situ investigation in a continuously cropped soybean field in Northeast China. Environ. Sci. Pollut. Res. 18, 407-415. (doi: 1007/s11356-010-0381-4)
- Thayer, K.A., Heindel, J.J., Bucher, J.R., Gallo, M.A., 2012. Role of environmental chemicals in diabetes and obesity: a National Toxicology Program workshop review. Environ. Health Perspect. 120 (6), 779-789. (doi: 10.1289/ehp.1104597)
- Joly, P., Bonnemoy, F., Charvy, J.C., Bohatier, J., Mallet, C., 2013. Toxicity assessment of the maize herbicides S-metolachlor, benoxacor, mesotrione and nicosulfuron, and their corresponding commercial formulations, alone and in mixtures, using the Microtox test. Chemosphere. 93(10), 2444-2450. (doi: 1016/j.chemosphere.2013.08.074)
- Rachedi, K., Zermane, F., Tir, R., Ayache, F., Duran, R., Lauga, B., Karama, S., Simon, M., Boulahrouf, A., 2018. Effect of sulfonylurea tribenuron methyl herbicide on soil Actinobacteria growth and characterization of resistant strains. Braz. J. Microbiol. 49 (1), 79-86. (doi: 1016/j.bjm.2017.05.004)
- Benzi, M., Robotti, E., Gianotti, V., 2011. HPLC-DAD-MSn to investigate the photodegradation pathway of nicosulfuron in aqueous solution. Anal Bioanal Chem. 399(4): 1705-1714. (doi: 10.1007/s00216-010-4467-0)
- Zhao, H.Y., Zhu, J.Y., Liu, S.N., Zhou, X.G., 2018. Kinetics study of nicosulfuron degradation by a Pseudomonas nitroreducens strain NSA02. Biodegradation. 29, 271-283. (doi: 1007/s10532-018-9828-y)
- Meng, C., Chngchun S., Guo, Y.H., Shi, X.A., Cheng, J.F., Yan, F., 2004. Study on characteristics of biocometabolic removal of omethoate by the Aspergillus Water Res. 38, 1139-1146. (doi: 10.1016/j.watres.2003.11.026)
- Li, C.Y., Lv, T.Y., Liu, W.J., Zang, H.L., Cheng, Y., Li, D.P., 2017. Efficient degradation of chlorimuron-ethyl by a bacterial consortium and shifts in the aboriginal microorganism community during the bioremediation of contaminated-soil. Ecotoxicol. Environ. Saf. 139, 423-430. (doi: 1016/j.ecoenv.2017.02.005)
- Li, M.M., Ma, Q.Y., Kong, D.L., Han, X.Y., Che, J., Zhou, Y.Q., Jiang, X., Ruan, Z.Y., Zhang, Q.H., 2021. Pseudomonas nicosulfuronedens nov., a nicosulfuron degrading bacterium, isolated from a microbial consortium. Int. J. Syst. Evol. Micr. 71(2). (doi:10.1099/ijsem.0.004632)
- Zhao, W., Wang, C., Xu, L., Zhao, C., Liang, H., Qiu, L., 2015. Biodegradation of nicosulfuron by a novel Alcaligenes faecalis strain ZWS11. J. Environ. Sci. 35, 151-162. (doi: 1016/j.jes.2015.03.022)
- Lu, X.H., Kang, Z.H., Tao, B., Wang, Y.N., Dong, J.G., Zhang, J.L., 2012. Degradation of nicosulfuron by Bacillus subtilis YB1 and Aspergillus niger Appl. Biochem. Microbiol. 48, 460-466. (doi: 10.1134/S0003683812050079)
- Wang, L., Zhang, X., Li, Y., 2016. Degradation of nicosulfuron by a novel isolated bacterial strain Klebsiella Y1: condition optimization, kinetics and degradation pathway. Water Sci. Technol. 73, 2896-2903.
- Zhou, S., Song, J., Dong, W., Mu, Y., Zhang, Q., Fan, Z.W., Wang, Y.W., Kong, D.L., Zhou, Y.Q., Jiang, X., Zhao, B., Han, G., Ruan, Z.Y., 2017. Nicosulfuron biodegradation by a novel cold-adapted strain Oceanisphaera psychrotolerans LAM-WHM-ZC. J. Agric. Food Chem. 65, 10243-10249. (doi: 10.1021/acs.jafc.7b04022)
- Yang, Y., Tao, B., Zhang, W., Zhang, J., 2008. Isolation and screening of microorganisms capable of degrading nicosulfuron in water. Front. Agric. China. 2, 224-228. (doi: 1007/s11703-008-0033-3)
- Song, J.L., Gu, J.G., Zhai, Y., Wu, W., Wang, H.S., Ruan, Z.Y., Shi, Y.H., Yan, Y.C., 2013. Biodegradation of nicosulfuron by a Talaromyces flavus Bioresour. Technol. 140, 243-248. (doi: 10.1016/j.biortech.2013.02.086)
- Feng, W.M., Wei, Z., Song, J.L., Qin, Q., Yu, K.M., Li, G.C., Zhang, J.Y., Wu, W., Yan, Y.C., 2017. Hydrolysis of nicosulfuron under acidic environment caused by oxalate secretion of a novel Penicillium oxalicum strain YC-WM1. Sci. Rep. 7, 647. (org/10.1038/s41598-017-00228-2)
- Carles, L., Florent, R., Pascale, B., Christelle, B., Martin, L., Joan, A., Isabelle, B., 2018. Nicosulfuron degradation by an ascomycete fungus isolated from submerged Alnus leaf litter. Front. Microbiol. 9, 3167. (doi: 10.3389/fmicb.2018.03167)
- Li, M.M., Song, J.L., Ma, Q.Y., Kong, D.L., Zhou, Y.Q., Jiang, X., Parales, R., Ruan, Z.Y., Zhang, Q.H., 2020. Insight into the characteristics and new mechanism of nicosulfuron biodegradation by a Pseudomonas LAM1902. J. Agric. Food Chem. 68 (3), 826-837. (doi: 10.1021/acs.jafc.9b06897)
- An, X.J., Cheng, Y., Miao, L., Chen, X., Zang, H.L., Li, C.Y., 2020. Characterization and genome functional analysis of an efficient nitrile-degrading bacterium, Rhodococcus rhodochrous BX2, to lay the foundation for potential bioaugmentation for remediation of nitrile-contaminated environments. J. Hazard. Mater. 389, 121906. (doi: 1016/j.jhazmat.2019.121906)
- Shu, B.S., Wu, Y.X., Qu, M.Q., Pu, X.H., Wu, Z.Z., Lin, J.T., 2020. Comparative transcriptomic analyses revealed genes and pathways responsive to heat stress in Diaphorina citri. Gene. 727:144246. (doi: 1016/j.gene.2019.144246)
- Kumar, A.G., Hinduja, M., Sujitha, K., Rajan, N.N., Dharani, G., 2021. Biodegradation of polystyrene by deep-sea Bacillus paralicheniformis G1 and genome analysis. Sci. Total Environ. 774, 145002. (doi: 1016/j.scitotenv.2021.145002)
- Hao, D.C., Song, S.M., Cheng, Y., Qin, Z.Q., Ge, G.B., An, B.L., Xiao, P.G., 2018. Functional and transcriptomic characterization of a dye-decolorizing fungus from taxus rhizosphere. Pol. J. Microbiol. 67 (4), 417-429. (doi: 21307/pjm-2018-050)
- Mohammadi, N.S., Buapet, P., Pernice, M., Signal, B., Kahlke, T., Hardke, L., Ralph, P.J., 2019. Transcriptome profiling analysis of the seagrass, Zostera muelleri under copper stress. Mar. Pollut. Bull. 149, 110556. (doi: 1016/j.marpolbul.2019.110556)
- Zhang, Y., Zhao, P., Yue, S.D., Liu, M.J., Qiao, Y.L., Xu, S.C., Gu, R.T., Zhang, X.M., Zhou, Y., 2021. New insights into physiological effects of anoxia under darkness on the iconic seagrass Zostera marina based on a combined analysis of transcriptomics and metabolomics. Sci. Total Environ. 768, 144717. (doi: 1016/j.scitotenv.2020.144717)
- Chen, G.T., An, X.J., Feng, L.L., Xia, X., Zhang, Q.H., 2020. Genome and transcriptome analysis of a newly isolated azo dye degrading thermophilic strain Anoxybacillus Ecotoxicol. Environ. Saf. 203, 111047. (doi: 10.1016/j.ecoenv.2020.111047)
- Cheng, Y., Zang, H.L., Wang, H.L., Li, D.P., 2018. Global transcriptomic analysis of Rhodococcus erythropolis D310-1 in responding to chlorimuron-ethyl. Ecotoxicol. Environ. Saf. 157, 111-120. (doi: 1016/j.ecoenv.2018.03.074)
- Tribelli, P.M., Venero, E.C.S., Ricardi, M.M., Gómez-Lozano, M., Iustman, L.J.R., Molin, S., López, N.I., 2015. Novel essential role of ethanol oxidation genes at low temperature revealed by transcriptome analysis in the Antarctic bacterium Pseudomonas extremaustralis. PLoS One. 10 (12), e0145353. (doi: 1371/journal.pone.0145353)
- Bolger, A.M., Lohse, M., Usadel, B., 2014. Trimmomatic: a flexible trimmer for Illumina aequence data. Bioinformatics. 30 (15), 2114-2120. (doi: 10.1093/bioinformatics/btu170)
- Kim, D., Langmead, B., Salzberg, S.L., 2015. HISAT: a fast spliced aligner with low memory requirements. Nat Methods. 12 (4), 357-360. (doi: 1038/nmeth.3317)
- Anders, S., Huber, W., 2010. Differential expression analysis for sequence count data. Genome Biol. 11 (10), R106. (doi:10.1186/gb-2010-11-10-r106)
- Robinson, M.D., McCarthy, D.J., Smyth, G.K., 2010. edgeR: a Bioconductor package for differential expression analysis of digital gene expression data. Bioinformatics, 26 (1), 139-140. (doi: 1093/bioinformatics/btp616)
- Ran, S.J., Liu, B., Jiang, W., Sun, Z., Liang, J.P., 2015. Transcriptome analysis of Enterococcus faecalis in response to alkaline stress. Front. Microbiol. 6, 795. (doi: 3389/fmicb.2015.00795)
- Yu, G.C., Wang, L.G., Han, Y., He, Q.Y., 2012. clusterProfiler: an R package for comparing biological themes among gene clusters. OMICS: A Journal of Integrative Biology. 16(5), 284-287. (doi: 1089/omi.2011.0118)
- Lin, J.Q., Zhao, X.X., Zhi, Q.Q., Zhao, M., He, Z.M., 2013. Transcriptomic profiling of Aspergillus flavus in response to 5-azacytidine. Fungal Genet. Biol. 56, 78-86. (doi: 1016/j.fgb.2013.04.007)
- Kolaczkowski, M., Kolaczowska, A., Luczynski, J., Witek, S., Goffeau, A., 1998. In vivo characterization of the drug resistance profile of the major ABC transporters and other components of the yeast pleiotropic drug resistance network. Microb. Drug. Resist. 4, 143-158. (doi: 1089/mdr.1998.4.143)
- Lage, H., 2003. ABC-transporters: implications on drug resistance from microorganisms to human cancers. Int. J. Antimicrob. Agents. 22(3), 188-199. (doi: 1016/S0924-8579(03)00203-6)
- Della Torre, C.D., Zaja, R., Loncar, J., Smital, T., Focardi, S., Corsi, I., 2012. Interaction of ABC transport proteins with toxic metals at the level of gene and transport activity in the PLHC-1 fish cell line, Chem. Biol. Interact. 198, 9-17. (doi: 1016/j.cbi.2012.04.008)
- Glavinas, H., Krajcsi, P., Cserepes, J., Sarkadi, B., 2004. The role of ABC transporters in drug resistance, metabolism and toxicity (ADME-Tox). Curr. Drug. Deliv. 1, 27-42. (doi: 1016/j.drudis.2007.12.010)
- Dong, L., Wu, Y., Bian, Y.Z., Zheng, X., Chen, L., Chen, Y.G., Zhang, X., 2021. Carbon nanotubes mitigate copper-oxide nanoparticles-induced inhibition to acidogenic metabolism of Propionibacterium acidipropionici by regulating carbon source utilization. Bioresour. Technol. 330, 125003. (doi: 1016/j.biortech.2021.125003)
- Slamovits, C.H., Keeling, P.J., 2006. Pyruvate-phosphate dikinase of oxymonads and parabasalia and the evolution of pyrophosphate-dependent glycolysis in anaerobic eukaryotes. Eukaryot Cell. 5 (1), 148-154. (doi: 1128/EC.5.1.148-154.2006)
- Seo, J.S., Keum, Y.S., Li, Q.X., 2013. Metabolomic and proteomic insights into carbaryl catabolism by Burkholderia C3 and degradation of ten N-methylcarbamates. Biodegradation 24 (6), 795-811. (doi: 10.1007/s10532-013-9629-2)
- Stincone, A., Prigione, A., Cramer, T., Wamelink, M.M., Campbell, K., Cheung, E., Olin-Sandoval, V., et al., 2015. The return of metabolism: biochemistry and physiology of the pentose phosphate pathway. Biol Rev Camb Philos Soc. 90 (3), 927-963. (doi: 1111/brv.12140)
- Srivastava A; Biswas S; Yadav S; Kumar S; Srivastava A; Mishra Y. 2021. Acute cadmium toxicity and post-stress recovery: Insights into coordinated and integrated response/recovery strategies of Anabaena PCC 7120. J. Hazard Mater. 411, 124822. (doi: 10.1016/j.jhazmat.2020.124822)
- Ganesh, I., Kim, T.W., Na, J.G., Eom, G.T., Hong, S.H., 2019. Engineering Escherichia coli to sense non-native environmental stimuli: synthetic chimera two-component systems. Biotechnol. Bioproc. Eng. 24 (1), 12-22. (doi: 1007/s12257-018-0252-2)
- Zhao, Y., 2014. Preliminary study of two-component regulatory of Stenotrophomonas maltophilia. Liaoning Med. Coll. Master Diss. 3.
- Xiang, W.S., Wang, X.J., Ren, T.R., 2006. Expression of a wheat cytochrome P450 monooxygenase cDNA in yeast catalyzes the metabolism of sulfonylurea herbicides. Pestic. Biochem. Phys. 85, 1-6. (doi: 1016/j.pestbp.2005.09.001)
- Lu, P., Jin, L., Liang, B., Zhang, J., Li, S.P., Feng, Z.Z., Huang, X., 2011. Study of biochemical pathway and enzyme involved in metsulfuron-methyl degradation by Ancylobacter XJ-412-1 isolated from soil. Curr. Microbiol. 62, 1718-1725. (doi: 10.1007/s00284-011-9919-z)
- Feng, C.X., Xu, C.X., Wang, X.L., Ge, C.H., Wang, Q.H., 2015. The oxalic acid in plants: Biosynthesis, degradation and its accumulation regulation. Plant Physiology Journal. 51 (3): 267-272. (doi: 1038/s41598-017-00228-2)
- Zhang, Z., Yang, D.C., Si, H.L., Wang, J.Y., Parales, R.E., Zhang, J, L., 2020. Biotransformation of the herbicide nicosulfuron residues in soil and seven sulfonylurea herbicides by Bacillus subtilis YB1: A climate chamber study. Environ. Pollut. 263(Pt B):114492. (doi: 10.1016/j.envpol.2020.114492)
- Carles, L., Joly, J., Bonnemoy, F., Leremboure, M., Batisson, I., Besse-Hoggan, P., 2017. Identification of sulfonylurea biodegradation pathways enabled by a novel nicosulfuron-transforming strain Pseudomonas fluorescens SG-1: Toxicity assessment and effect of formulation. J. Hazard. Mater. 324, 184-193. (dx.doi.org/10.1016/j.jhazmat.2016.10.048)
No competing interests reported.