Cell lines and cell culture
The breast cancer cell line T47D (ER + PR+) was obtained from the University of Colorado Cancer Center Tissue Culture core and was maintained in minimal Eagle’s medium, 5% fetal bovine serum (FBS), 1X non-essential amino acids, 1 × 10− 9 M insulin, 0.1 mg/mL sodium pyruvate, and 2 mM L-glutamine. Development of ER + PR + breast cancer PDX UCD4 and UCD65 has been previously described (12, 31). The UCD65 cell line was derived from the UCD65 PDX and is ER + PR + and Her2 unamplified. The UCD65 cell line was maintained in DMEM/F-12 1:1 with 10% FBS, 1 × 10− 9 cholera toxin, 1 × 10− 9 hydrocortisone, and 1 × 10− 9 M insulin. Cell lines were authenticated using short tandem repeat (STR) analysis using the University of Colorado Genetics core. For UCD65, cells were matched to the original PDX and not to any other cell lines in the database. All cell lines were routinely tested for mycoplasma contamination using the MycoAlert mycoplasma detection kit (Lonza, Basel, Switzerland).
In vitro hormone experiments were performed using phenol red-free media with the same additives described above. Hormone treatment was used as follows: E2 = 17-β-estradiol, 10− 8 M (Sigma-Aldrich, St. Louis, MO); P = R5020, 10− 8 M (PerkinElmer, Waltham, MA). PR expression was induced in UCD65 cells by E2 pre-treatment for a minimum of 24 h prior to experiment start.
Animal Experiments
For these experiments, PDX tumors were partitioned into female NOD/SCID/ILIIrg−/− (NSG) mice supplemented with subcutaneous silastic pellets containing E2 or E2 + progesterone (P4) (called E2 + P herein) (Sigma-Aldrich, St. Louis, MO) as described previously (32, 33). For T47D xenografts, 1 × 10⁶ cells were injected into the mammary fat pad of female NSG mice supplemented with E2 or E2 + P pellets. Tumors were measured weekly with a digital caliper and volume was estimated by the formula lw2/2. All animal experiments were performed under a protocol approved by the University of Colorado Institutional Animal Care and Use Committee.
Metabolomics
Metabolites were extracted from T47D and UCD65 cell pellets in quadruplicate using ice-cold extraction buffer (5:3:2 methanol:acetonitrile:water) at a concentration of 2 × 10⁶ cells per mL as previously described (34, 35). Supernatants (10 uL) were analyzed on a Thermo Vanquish ultra-high performance liquid chromatography column coupled online to a Thermo Q Exactive mass spectrometer (UHPLC-MS) in positive and negative ion modes (separate runs) using a 5 min C18 gradient. Untargeted data acquisition, quality control, and targeted data analysis were performed as previously described (36). Precipitated protein was reconstituted in PBS and measured using BCA protein assay (Pierce, Thermo Fisher, Waltham, MA). Metabolomics intensity signals were normalized to sample protein concentration.
Normalized data was imported into MetaboAnalyst software (37, 38), where data was log-tranformed and autoscaled (39). Partial least squares discriminant analysis (PLS-DA) was performed on all samples within cell lines for visual inspection of clustering patterns and outlier detection. Heatmaps were constructed using Pearson distance with average linkage and depict non-scaled PLS-DA variable importance in projection (VIP) averaged across replicates (N = 4) within treatment groups.
For pathways analysis, pairwise comparisons were used: 1) vehicle-treated cells (Veh, 0.2% ethanol) vs. P-treated cells, and 2) E2-treated cells vs. E2 + P-treated cells. Metabolites from random forest variable importance analysis with mean decrease in accuracy > 0 were evaluated for fold-change direction (lower in E2 + P vs. E2, called “down”; higher in E2 + P vs. E2, called “up”). These subsets of metabolites were submitted to MetaboAnalyst Pathways Analysis (MetPA) and can be found in Additional file 1: Table S1 for T47D cells and Additional file 2: Table S2 for UCD65 cells. Pathways were identified using default settings; specifically, the hypergeometric test for overrepresentation analysis and relative betweenness centrality was used for pathway topology analysis, with pathways mapped to the Homo sapiens KEGG reference library.
Immunocytochemistry
Immunohistochemistry and ICC were performed as previously described (31, 40). Cells were plated on coverslips and fixed in methanol/acetone. The primary antibody directed against CK5 (#NCL-L-CK5, Leica Biosystems, 1:200) was applied for 1 hour followed by Alexa Fluor 488 goat anti-mouse fluorescent secondary antibody (#A11029, Thermo Fisher, Waltham, MA), counterstained with DAPI and mounted. Images were collected using a Nikon TiE microscope equipped with a digital camera and NIS Elements software.
Seahorse Metabolic Phenotyping
Metabolic phenotype was determined using the Seahorse XFe96 Extracellular Flux Analyzer (Agilent, Santa Clara, CA). Cells were cultured in the presence of hormones for 24–48 hours and assessed via the Mito Stress Test kit. Samples were analyzed with 5–6 replicates per treatment.
Atp Assay
Intracellular ATP was quantified using the ATP Fluorimetric Assay from Novus Biologicals (#NBP2-54855, Biotechne, Cambridge, MA) according to the manufacturer’s protocol. Briefly, cells treated with hormones for 24, 48 h, or 72 hours were lysed in ice-cold assay buffer and deproteinized using the Deproteinizing Sample Preparation Kit (#K808-200, BioVision, LLC, Milpitas, CA) according to the manufacturer’s protocol and assayed under fluorimetric conditions (Ex 535/Em 587) in triplicate. Results are representative of at least 3 experiments.
L-amino Acid Assay
Amino acids were measured using the L-Amino Acid Quantitation Kit (#MAK002, Sigma-Aldrich, St. Louis, MO) according to the manufacturer’s protocol. Briefly, T47D cells treated with hormones for 24 h were homogenized in ice-cold assay buffer, diluted within linear range of the assay, and colorimetric absorbance at 570 nm measured in triplicate. Results are representative of at least 2 experiments.
Glutathione Assay
Intracellular glutathione (GSH) was quantified using the Glutathione Assay Kit from Cayman Chemicals (#703002, Ann Arbor, MI) according to the manufacturer’s protocol. Briefly, T47D cells were treated with hormones for 24 h, lysed in ice-cold assay buffer, and deproteinized using the Deproteinizing Sample Preparation Kit (#K808-200, BioVision, LLC, Milpitas, CA). Deproteinated samples were measured for total glutathione (combined GSH + GSSG) via absorbance at 405 nm in triplicate. Results are representative of at least 3 experiments.
Inhibition Of Glutathione Synthesis
The small molecule buthionine sulfoximine (BSO) inhibits the catalytic subunit of the glutamate-cysteine ligase enzyme (GCLC), which catalyzes the rate-limiting step in glutathione synthesis (41). BSO was purchased from Cayman Chemical (#14484, Ann Arbor, MI) and was reconstituted fresh in sterile PBS immediately prior to use at a final concentration of 10− 4 M.
Transmission Electron Microscopy
Cells were cultured on PermaNox 60-cm dishes (VWR, Radnor, PA). Excised tumors were cut into approximately 1 mm3 pieces. Cultured cells and tumor pieces were fixed with 2% paraformaldehyde and 2.5% glutaraldehyde in 0.1 M phosphate buffer and then post-fixed with reduced osmium (1.5% potassium ferrocyanide + 1% osmium tetroxide) followed by 2% osmium tetroxide. Samples were dehydrated with a graded series of ethanol and embedded in a thin layer of Epon. Following Epon curing, small pieces were cut out and re-embedded in blocks that were sectioned at 65 nm on an ultramicrotome, collected on formvar coated slot grids, and post-stained with 2% osmium tetroxide and lead citrate.
At least 10 fields per treatment were imaged and blinded prior to analysis. Mitochondrial length along the longest axis was measured using Fiji and plotted via histogram, with bin mode indicated on the X-axis. Outliers greater than 3 standard deviations outside the mean of the full dataset were excluded. Differences in distributions were analyzed using the Kolmogorov-Smirnov test for frequency distributions; comparisons for cells were 1) vehicle vs. E2 and 2) E2 vs. E2 + P, while tumor samples were pooled by hormone treatment and compared E2 pellets vs. E2 + P pellets.
Confocal Microscopy
T47D cells were labeled overnight with CellLights BacMam 2.0 MitoGFP (Thermo Fisher, Waltham, MA) according the manufacturer’s protocol. Following treatment, cells were fixed in 4% paraformaldehyde, counterstained with DAPI, and mounted on coverslips. Images were collected using confocal laser scanning microscopy (Zeiss LSM 780) with 40X objective.
Mitotimer
T47D and UCD65 cells were transduced to express the MitoTimer construct from Addgene (Watertown, MA) as previously described (42). Following stable transduction with the pLenti-CMV-rtTA3 Blast (w756-1) (Plasmid #26429) with > 2 weeks blasticidin selection, cells were transiently transfected with pTRE-Tight-MitoTimer (Plasmid #50547) using Lipofectamine 3000 (Thermo Fisher, Waltham, MA). MitoTimer expression was induced by treatment for 1 hour with doxycycline (4 ug/ml, Cayman Chemical, Ann Arbor, MI), followed by washout and hormone treatment for 48 h, at which point most mitochondria should be yellow to red. A second 1 h dox pulse, followed by washout, was used to label a new wave of mitochondria corresponding to cells undergoing active biogenesis. Following an additional 6 h of hormone treatment, live cells (via IncuCyte ZOOM at 20X magnification or fixed cells (4% paraformaldehyde with DAPI counterstain) were imaged for analysis.
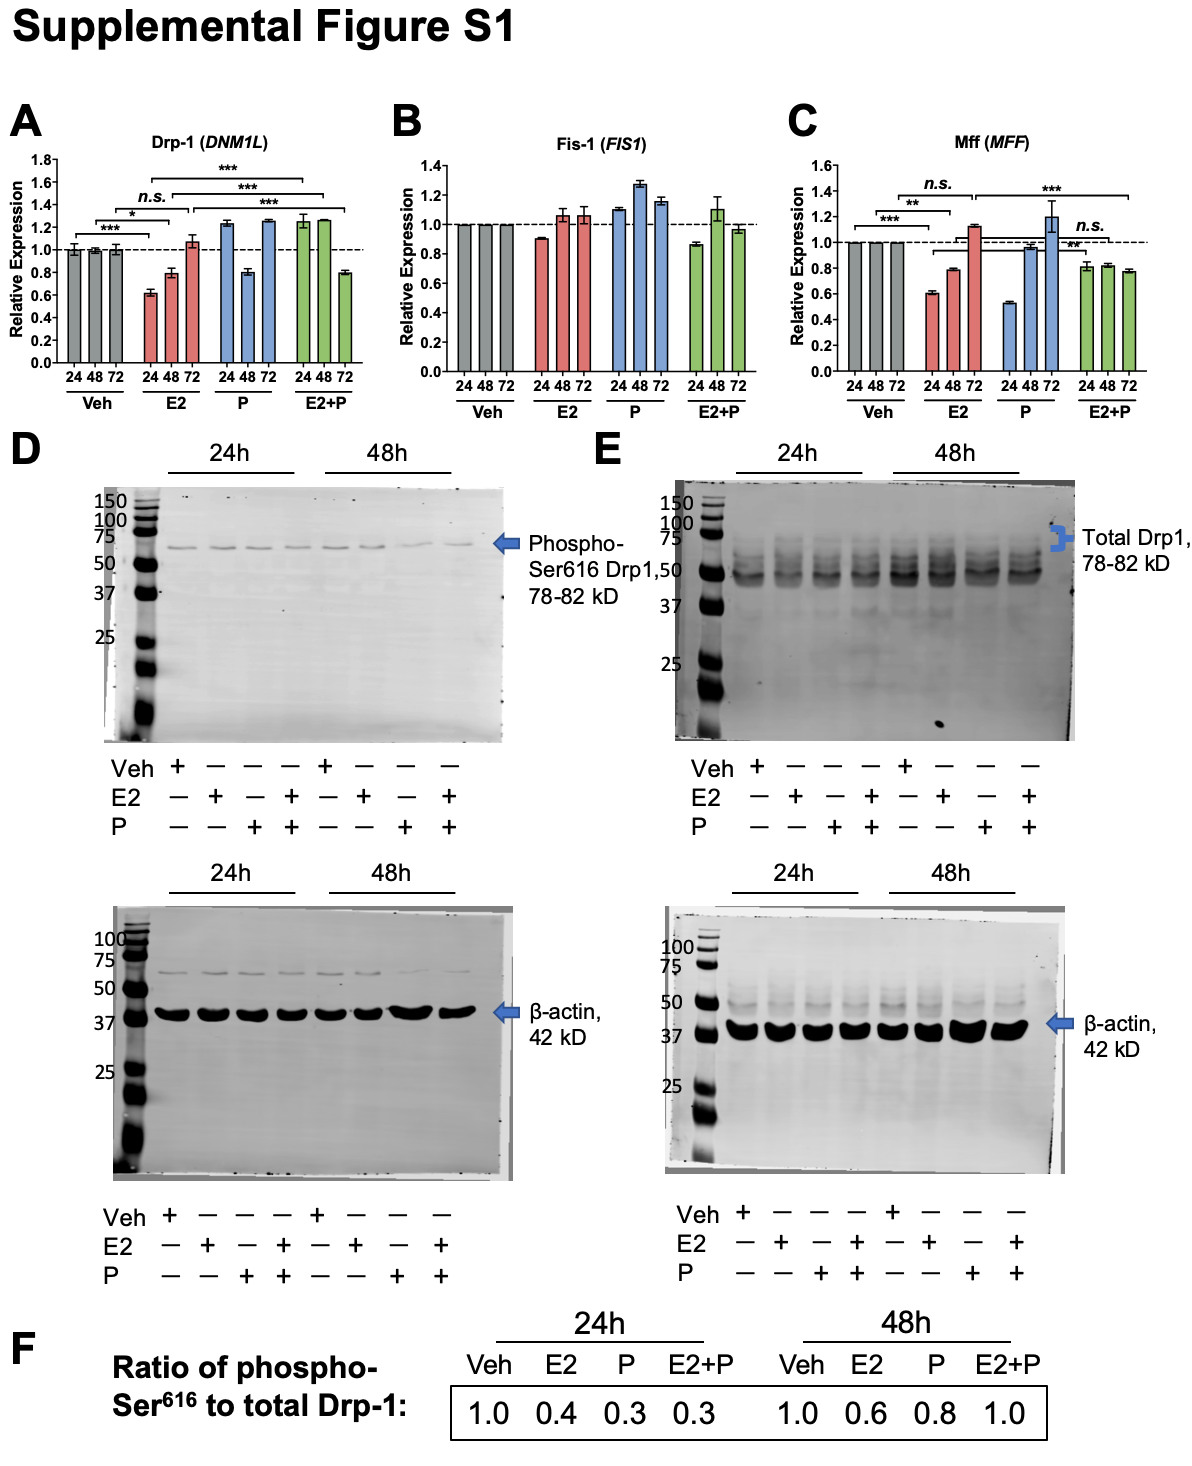
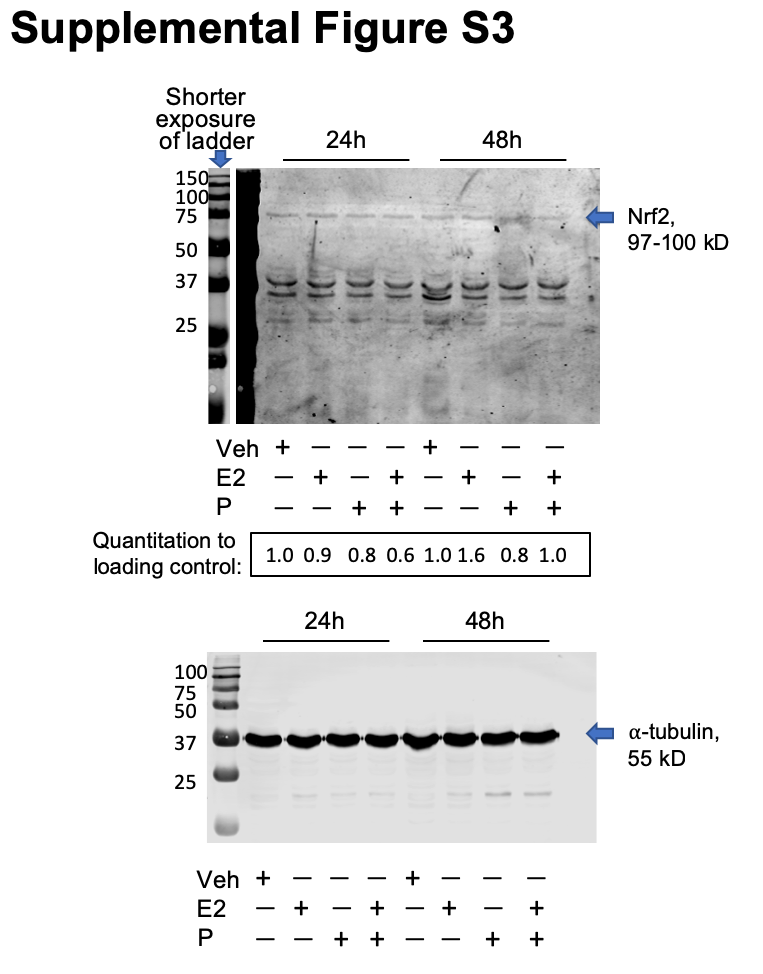
Real-time Quantitative Pcr (qpcr)
RNA was harvested using QIAzol lysis reagent (Qiagen, Venlo, the Netherlands) and converted to cDNA using the Verso cDNA kit (Thermo Fisher, Waltham, MA). qPCR was performed on cDNA using ABsolute Blue Sybr Green (Thermo Fisher, Waltham, MA) and normalized to β-actin using the Pfaffl method (43). qPCR primers are provided in Additional file: Table S3. Results are representative of 3–4 experiments.
Statistical Analyses
Statistics were performed using GraphPad Prism 8.3.0 (GraphPad Software, San Diego, CA), with the exception of metabolomics data, which was analyzed using MetaboAnalyst (see Metabolomics section for details). Two-tailed Student’s t-tests, or one-way ANOVA followed by Tukey post hoc multiple comparison tests were used as indicated with significance set a priori at P < 0.05. Equivalent non-parametric tests were used in the event of unequal variance between groups.