Statement on animal welfare
In vivo experimental procedures followed the Swiss animal welfare regulations. Studies described in this report were approved by the Swiss Cantonal Veterinary Authority of Basel City, Switzerland, and performed under the license number BS-2711. Authors complied with the ARRIVE guidelines for animal experimentation.
Animals
TREM2-KO mice [18] were purchased from the UC Davis KOMP Repository (Project ID VG10093) and were then bred at Novartis Pharma AG (Basel, Switzerland) in the C57BL/6 background. Wildtype (WT) mice were either littermates from a TREM2 heterozygous KO breeding or C57BL/6J from Charles River (Sulzfeld, Germany). TREM2-IPD mice were generated as described earlier [7]. The TREM2-sol (TREM2 soluble-only, B6-Trem2em3Npa) knock-in (KI) mice were generated at the Novartis Institutes for BioMedical Research (NIBR, Cambridge, USA). In brief, two single guide RNAs (sgRNAs) and a donor oligo (200 bp) containing the stop-codon TGA after the amino acid H and including a restricting enzyme site Eco57I (CACTGAAGC) replacing the wildtype amino-acids HST (CACAGCACC) were designed to target the mouse TREM2 allele. The sgRNAs (sgRNA1, complementary sequence: 5’-gggaccactactgtacct; sgRNA2, forward sequence: 5’- aagtggaacacagcacctcc) were ordered as crisp RNAs (crRNAs) from Integrated DNA Technologies (IDT, Coralville, IA, USA) as part of their Alt-R CRISPR/Cas9 system. sgRNA1 or sgRNA2 was microinjected, along with the universal Alt-R tracrRNA (IDT, IA, USA), donor oligo and Cas9 protein (PNA Bio, Thousand Oaks, CA, USA), into the pro-nucleus of fertilized C57Bl/6J oocytes. Viable two-cell embryos were re-implanted in pseudo-pregnant B6CBAF1 females. The resulting pups were genotyped by PCR analysis (primer F1: 5`-agctacccgctactgcaaag, primer R1: 5`-cccgatgagctcttccacat, expected product length: 635 bp, PCR program: 95°C 3 min, 95°C 20 sec, 60°C 20 sec, 72°C 45 sec, go to step 2, 35 cycles, 72°C 5 min, 14°C forever), followed by XhoI digestion and Sanger sequencing. Eight KI founders were back-crossed with C57BL/6J mice (JAX stock #000664, The Jackson Laboratory, Bar Harbor, ME, USA) and the F0 and F1 generation was subjected to MiSeq sequencing (Illumina Inc, San Diego, CA, USA) using a forward primer 5`-atgctggagatctctgggtcc and a reverse primer 5`-gtgagttgctacaaagggctcc to generate amplicons, and NuGEN’s Amplicon Sequencing System (part number 9092 − 256, Tecan, Redwood City, CA, USA) for the construction of a Next-Generation Sequencing library. Two founder lines were chosen. One mouse of each founder line (heterozygous) was subjected to targeted locus amplification (TLA) at Cergentis (Utrecht, The Netherlands). For this, viable frozen mouse spleen cells were used and processed according to Cergentis’ TLA protocol [48]. Two primer sets were designed on the transgene (Set 1: reverse primer exon 3: 5`- GGTCATCTAGAGGGTCTGTA, forward primer exon 3: 5`- TTCGTGCACTTAGTAGATCC; Set 2: reverse primer HA: 5`-CTACCTGGGTTTGTCCATG, forward primer HA: 5`- GAACGTTAGCCTGTCTCTAG). The primer sets were used in individual TLA amplifications. PCR products were purified and library prepared using the Illumina Nextera flex protocol and sequenced on an Illumina sequencer. Reads were mapped using the Burrows-Wheeler Aligner's Smith-Waterman (BWA-SW) alignment algorithm [26], version 0.7.15-r1140, settings bwasw -b 7. The NGS reads were aligned to the transgene sequence and the host genome. The mouse mm10 genome was used as host reference genome sequence. The presence of single-nucleotide variants (SNVs) was determined using samtools mpileup (samtools version 1.3.1, Genome Research Limited, Hinxton, UK) [25, 27]. Fusion sequences consisting of two parts of the transgene were identified using a proprietary Cergentis script. Fusions resulting from the TLA procedure itself were recognized by the restriction enzyme-specific sequence at the junction site and removed. Integration sites were detected based on a) coverage peak(s) in the genome and b) the identification of fusion-reads between the transgene sequence and the host genome. The transgene of both samples were integrated in mouse chr17:48,351,169 − 48,351,193 as intended. Genotyping has been performed from ear punch or tail tip DNA by two different PCRs with GotTaq (Promega, Madison, WI, USA) with the following primers: (i) PCR with Knock-in with primer sets 996_sTrem2-KI_F (5`-gatagggaatcgaccagaggc) and 997_sTrem2-KI_R (5`-ctactgtacctactcgtgcttcag) as well as internal control for beta-actin (747-beta-actin-fw-1: 5`-TGTGGGCATTTGATGAGCCGG; 748-beta-actin-rev-1: 5`-AAGACCCAGAGGCCATTGAGG); (ii) PCR with wildtype primer sets 994_sTrem2-wt_F (5`- tggaacacagcacctccagg) and 995_sTrem2-wt_R (5`- gggcttcatgtggctcaggg) as well as internal control for beta-actin with primer pair (747-beta-actin-fw-1 and. 748-beta-actin-rev-1. Expected KI band size: 251 bp, wildtype band size: 468 bp. Internal beta-actin control: 122 bp. PCR program: 95°C 3 min, 95°C 30 s, 60°C 30 s, 72°C 30 s, go to step 2, 35 cycles, 72°C 5 min, 8°C forever.
All animals were female, 2–3 months old at the beginning of the study, and divided into n = 4–7 mice per group.Genotyping of TREM2-KO mice was performed according to the protocol by UC Davis KOMP. All animals were allowed to adapt for 7 days prior to the start of the experiment and housed in individual ventilated cages (max. 4 mice/XJ Type cage). Mice were given access to food and water ad libitum throughout the study.
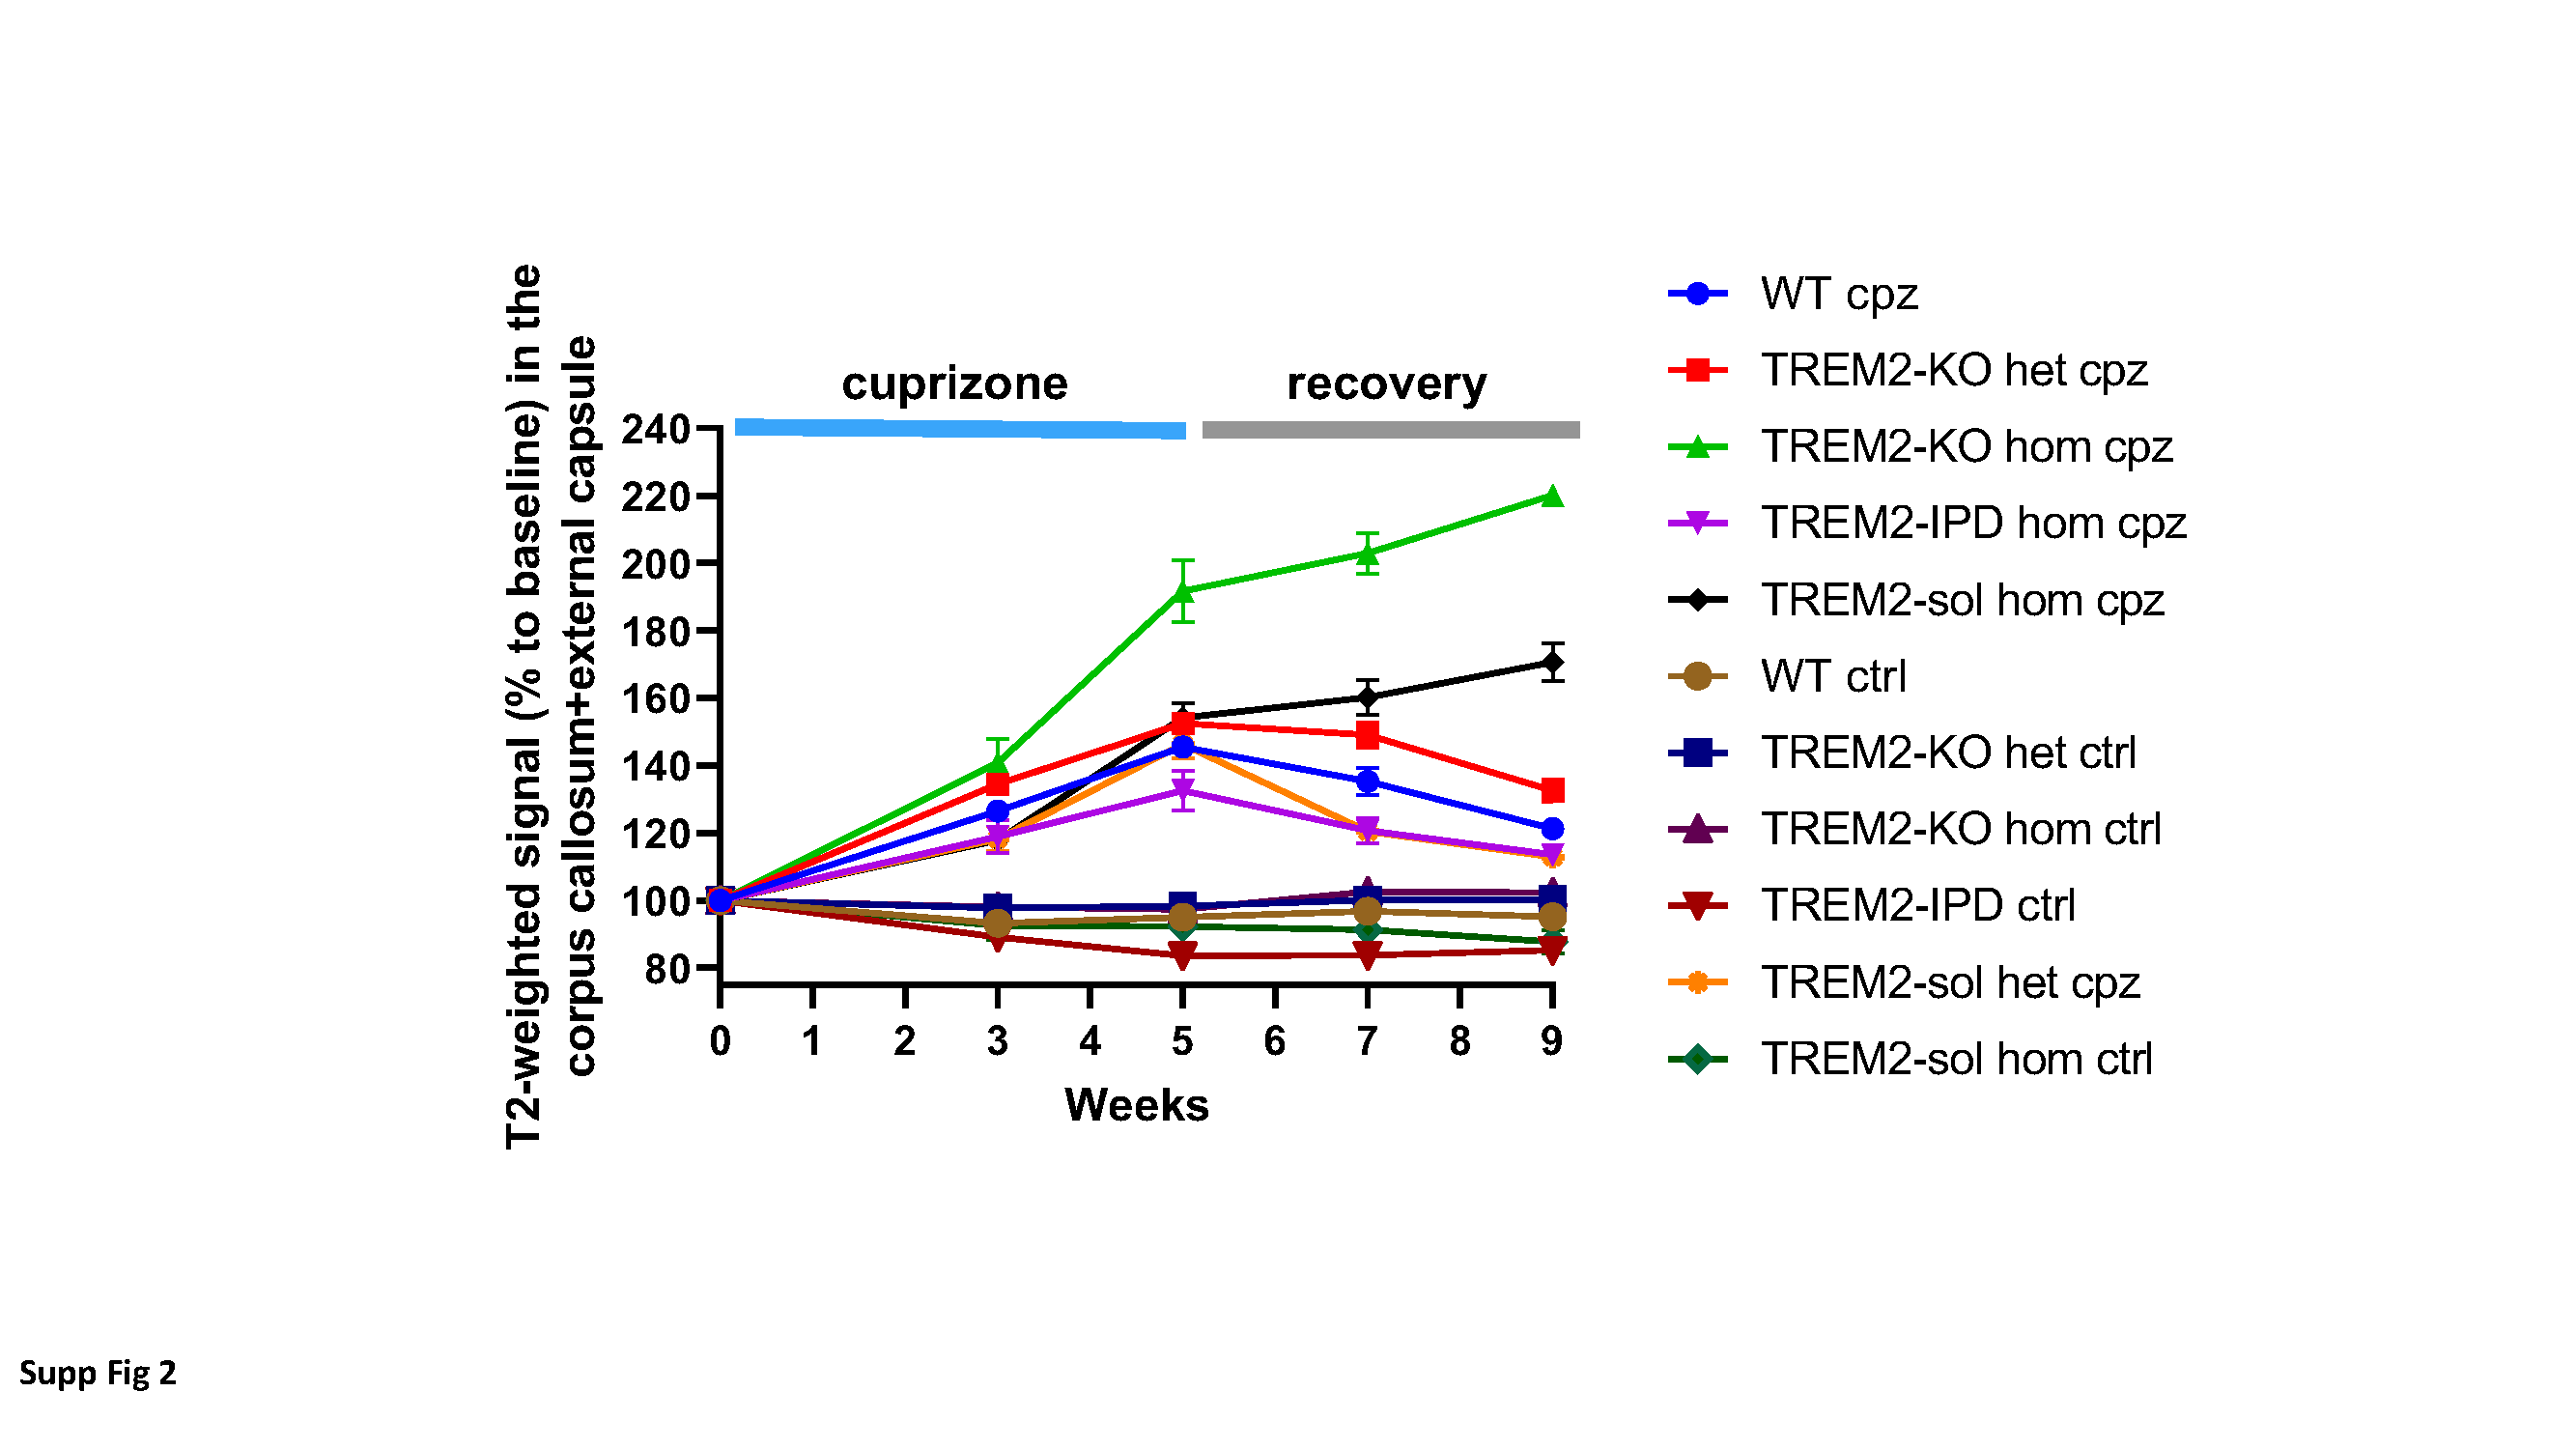
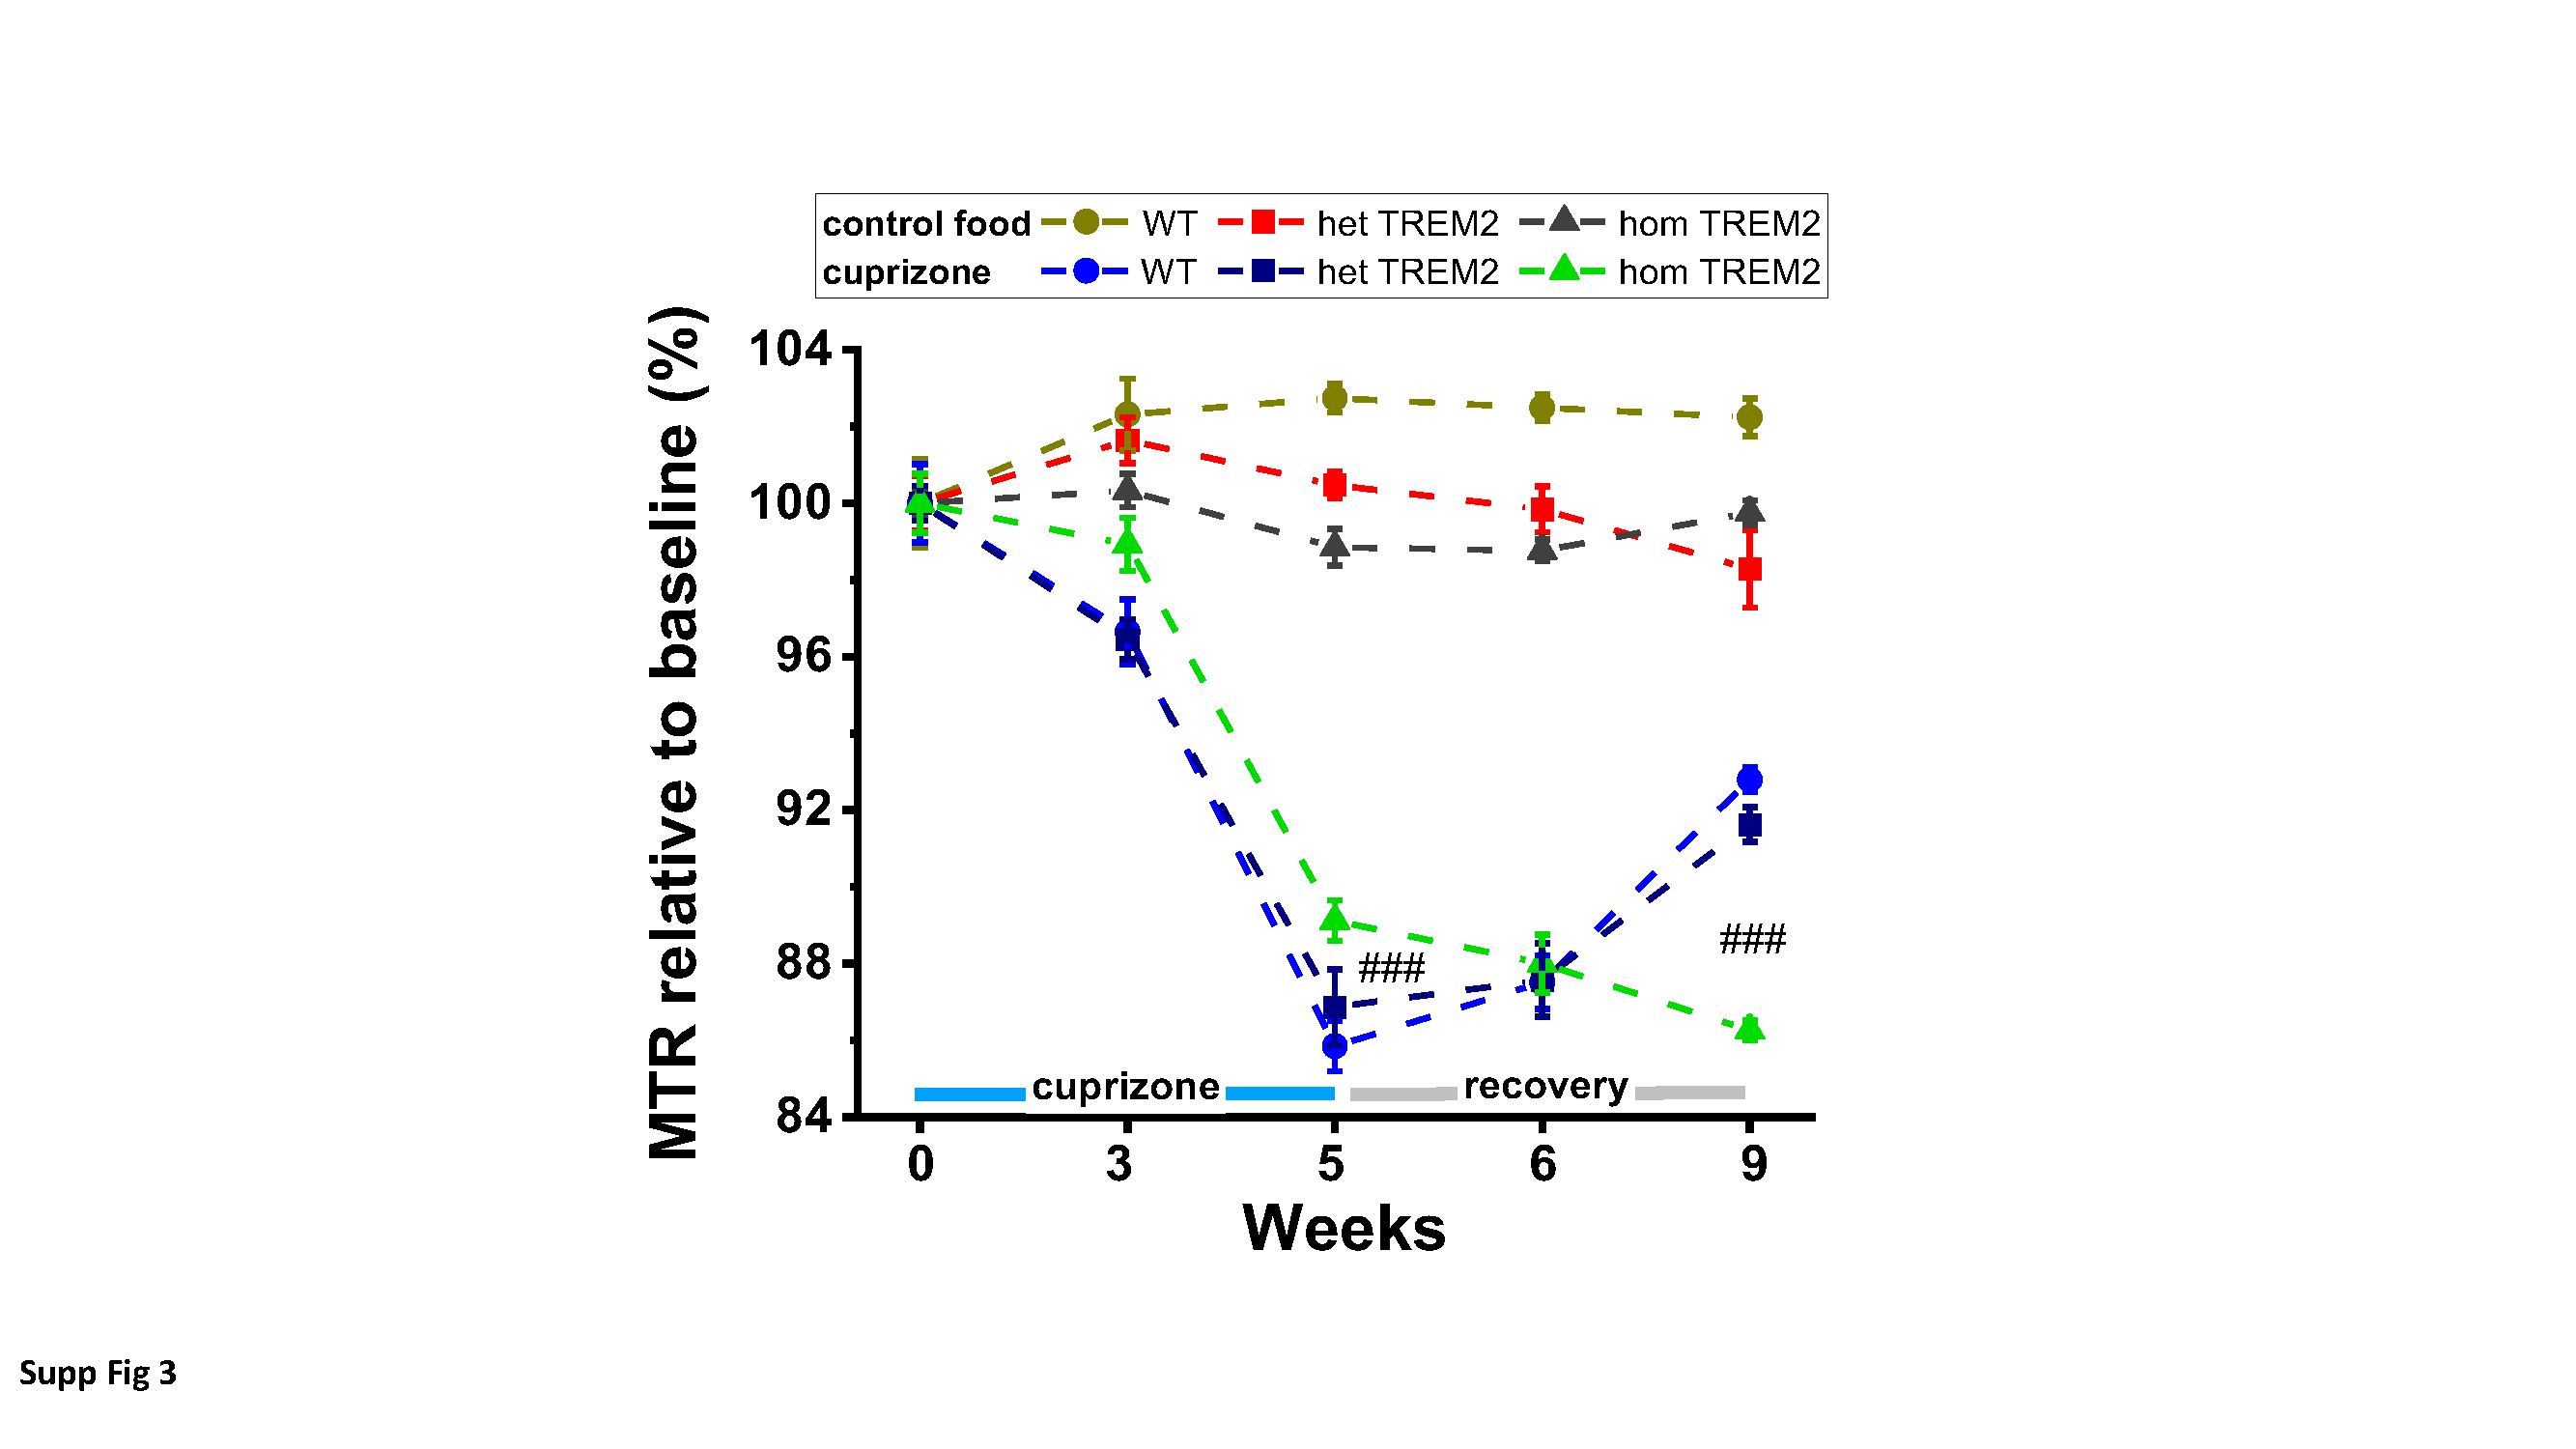
Cuprizone treatment
Animals were treated with cuprizone for 5 (acute model) or 12 (chronic model) weeks and then switched to normal food for 3 or 4 weeks. Cuprizone [Bis(cyclohexanone) oxaldihydrazone, Sigma-Aldrich, Buchs, Switzerland] was mixed into rodent food pellets (0.2% w/w) by Granovit AG (Kaiseraugst, Switzerland). Three independent studies for the acute model were performed. 1. Study: TREM2-KO (hom), TREM2-KO (het) and WT; 2. Study: TREM2-IPD, TREM2-sol (hom) and WT; 3. Study: TREM2-sol (het) and WT.
Magnetic resonance imaging (MRI)
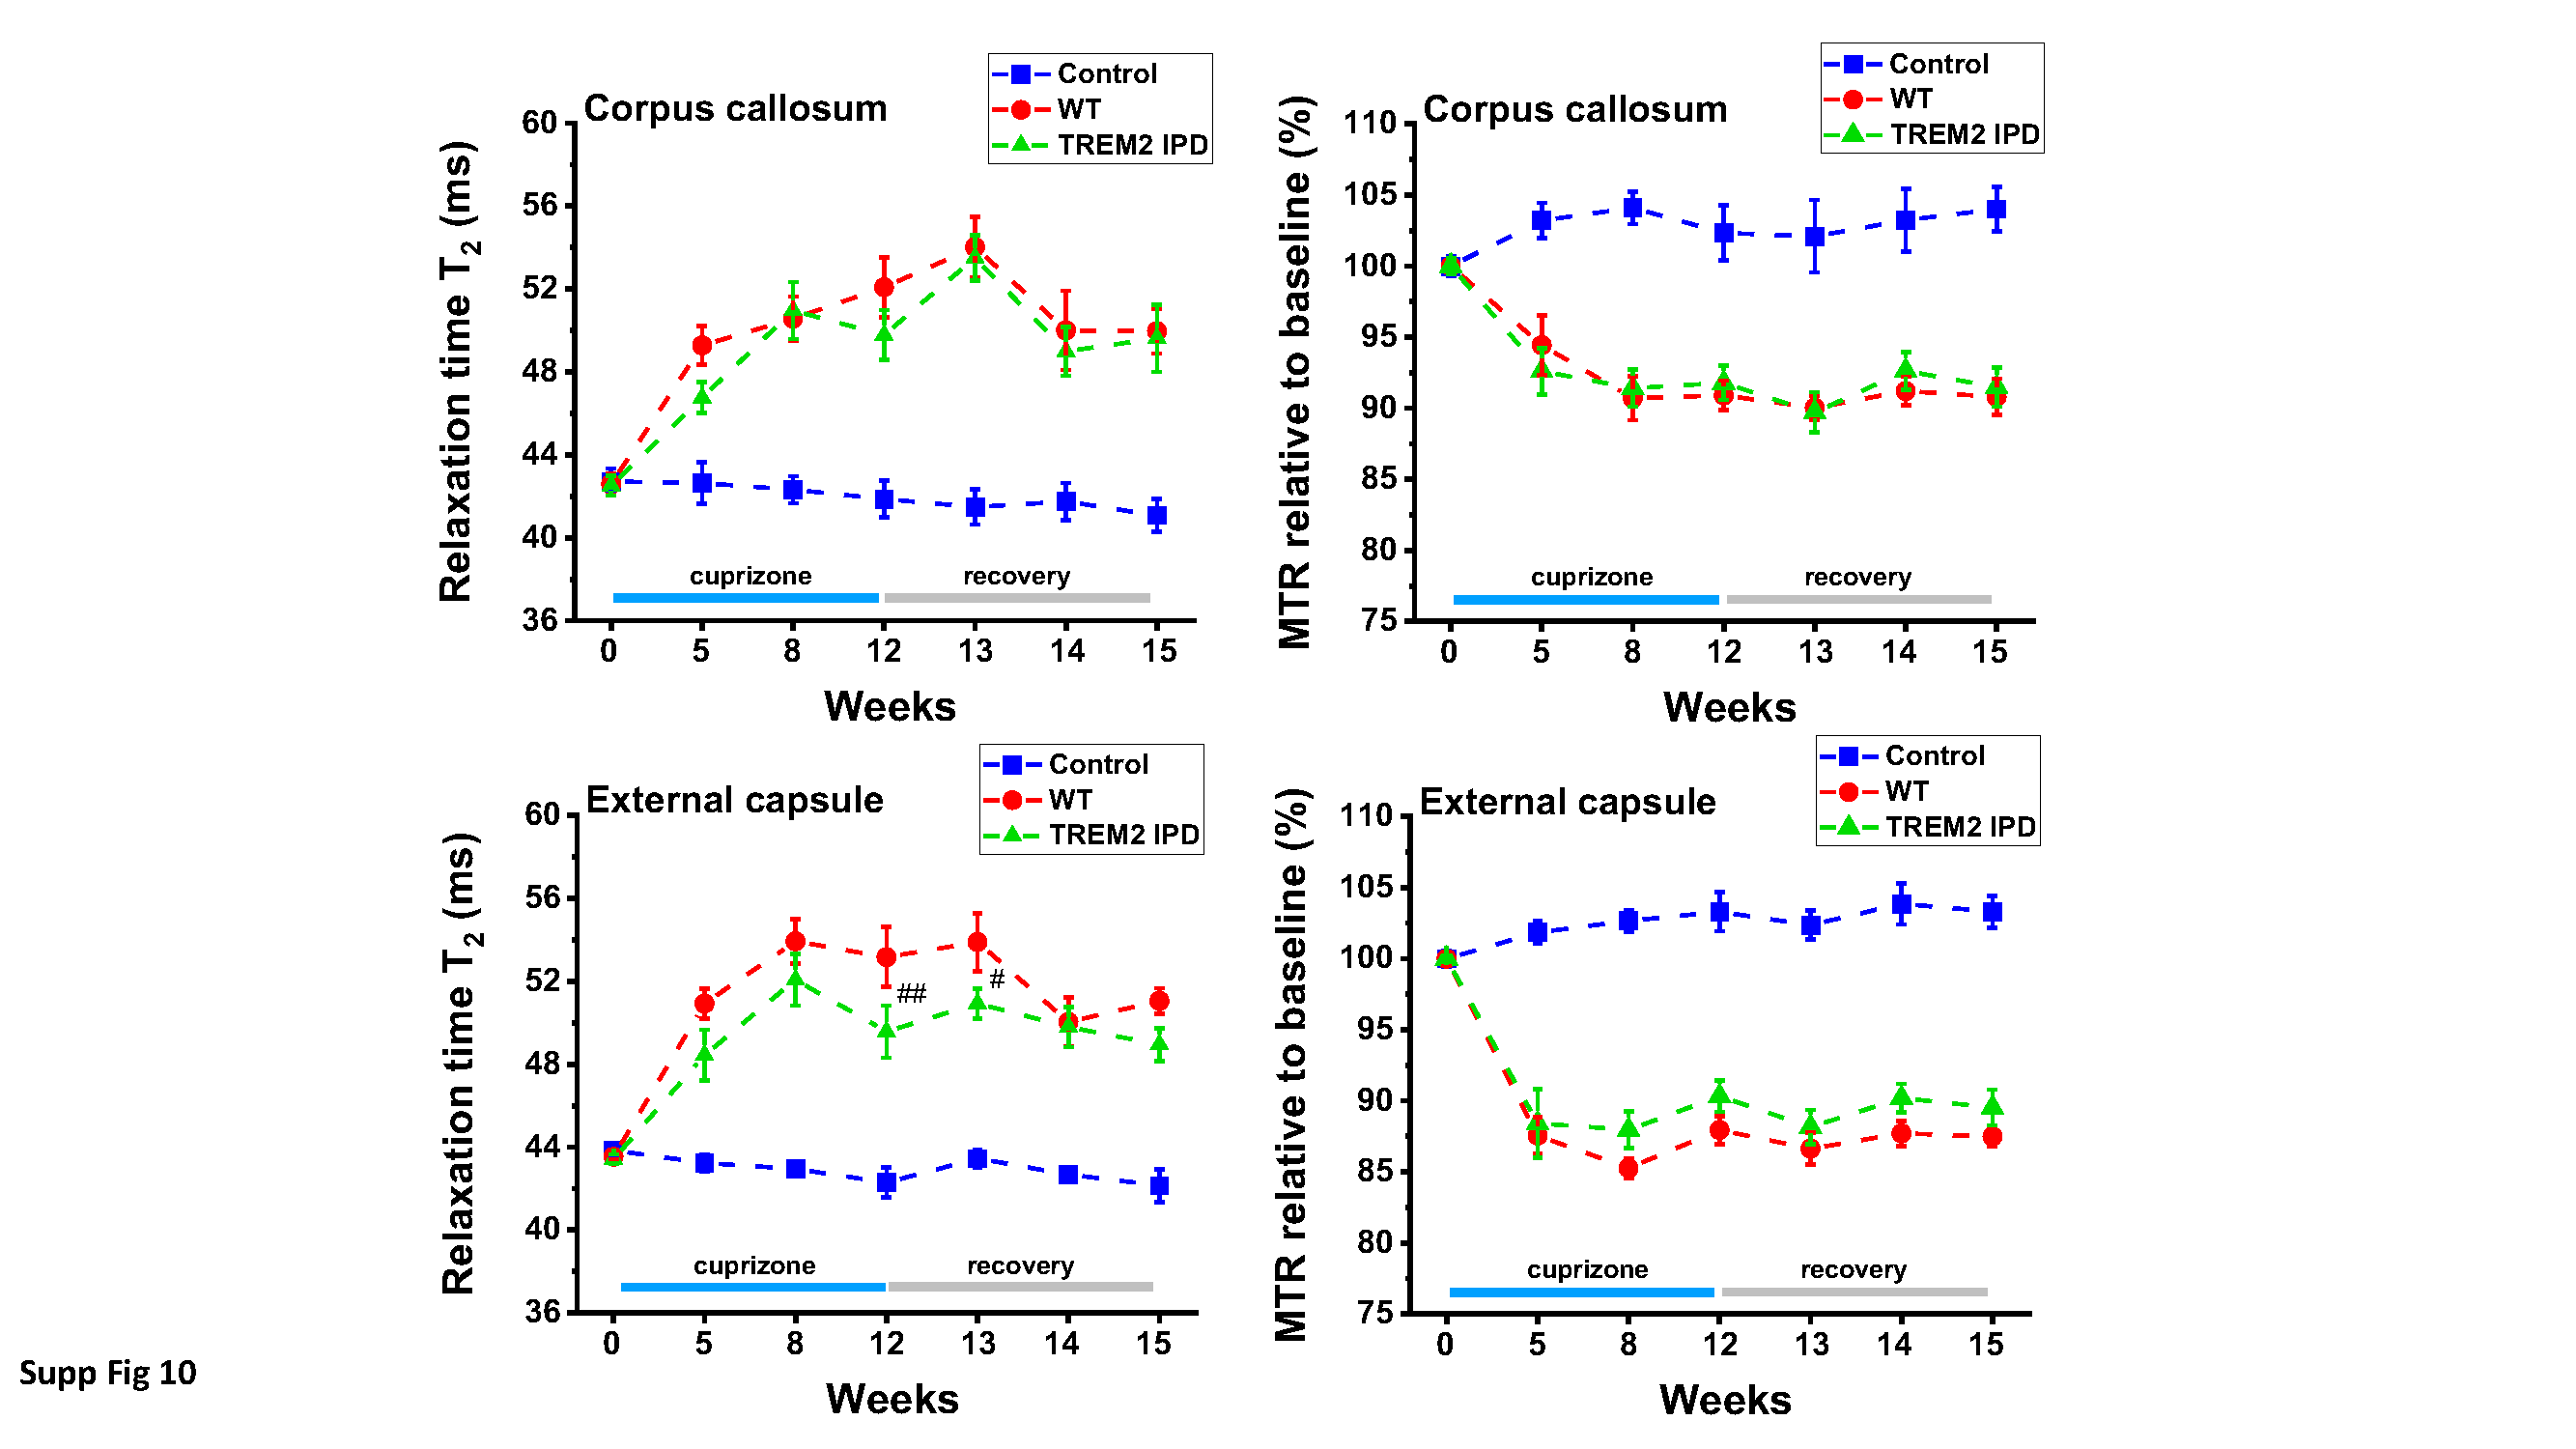
Measurements were performed with a Biospec 70/30 spectrometer (Bruker Medical Systems, Ettlingen, Germany) operating at 7 T. The operational software of the scanner was Paravision 5.1 (Bruker). Images were acquired from anesthetized, spontaneously breathing animals using a mouse brain circularly polarized coil (Bruker, Model 1P T20063V3; internal diameter 23 mm) for radiofrequency excitation and detection. Neither cardiac nor respiratory triggering was applied. Following a short period of introduction in a box, animals were maintained in anesthesia with 1.5% isoflurane (Abbott, Cham, Switzerland) in oxygen, administered via a nose cone. During MRI signal acquisitions, animals were placed in prone position in a cradle made of Plexiglas, the body temperature was kept at 37 ± 1°C using a heating pad, and the respiration was monitored.
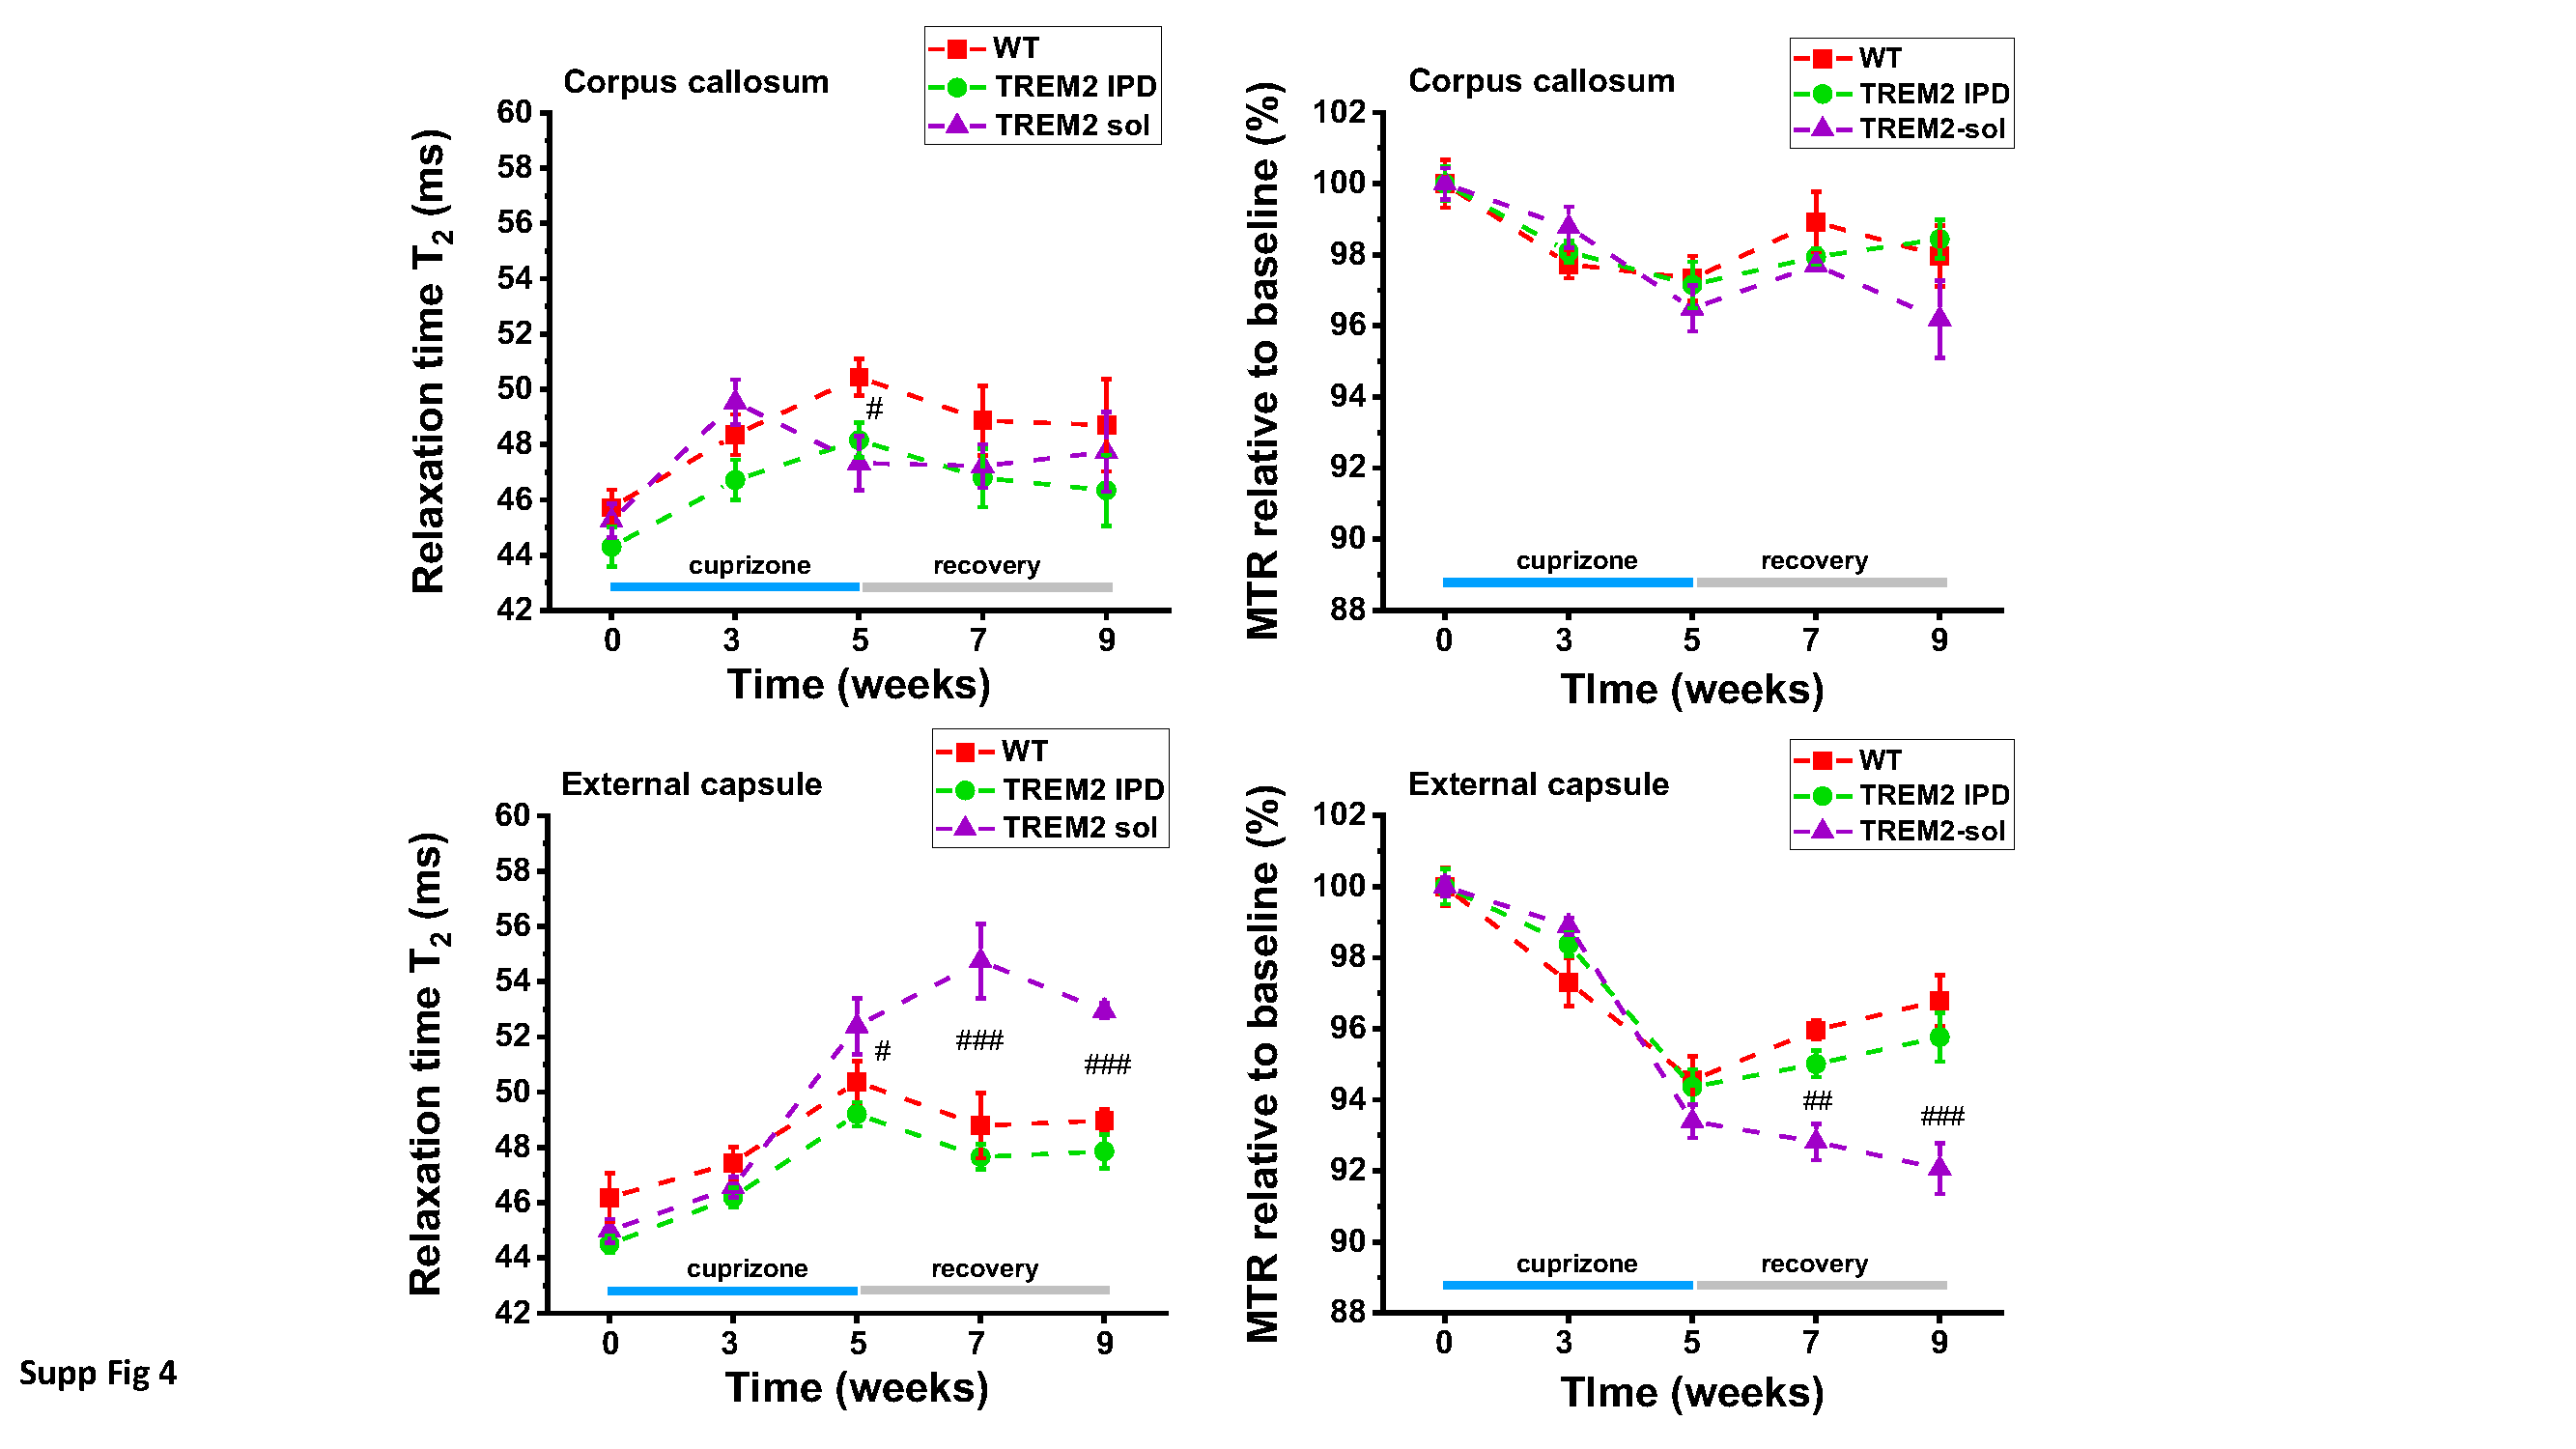
A T2-weighted, two-dimensional multislice RARE (Rapid Acquisition with Relaxation Enhancement) sequence [16] was used for selecting the regions-of-interest (ROIs) and for evaluating signal intensities. A two-dimensional multislice gradient-recalled FLASH (Fast Low-Angle Shot) acquisition [13] served to assess the magnetization transfer ratio (MTR), a measure reflecting myelin content (Beckmann et al., 2018). Assessments of the relaxation time T2 were performed using a multislice spin-echo sequence. As the three sequences had the same anatomical parameters, the ROIs for evaluations were selected on the RARE images and then transferred to the FLASH and spin-echo images. MRI images were analyzed using the Paravision software.
The parameters of the acquisitions were the following: (a) RARE sequence: effective echo time (TE) 80 ms, repetition time (TR) 3280 ms, RARE factor 16, 12 averages. Hermite pulses of duration/bandwidth 1 ms/5400 Hz and 0.64 ms/5344 Hz were used for radiofrequency excitation and refocusing, respectively. Fat suppression was achieved by a gauss512 pulse of 2.61 ms/1051 Hz duration/bandwidth followed by a 2-ms-long gradient spoiler. The total acquisition time was of 7 min 52.3 s; (b) FLASH sequence: TE/TR 2.8/252.8 ms, 4 averages. A hermite pulse of 0.9 ms/6000 Hz duration/bandwidth and flipangle 30° was used for radiofrequency excitation. MTR contrast was introduced by a gauss pulse of 15 ms/182.7 Hz duration/bandwidth applied with radiofrequency peak amplitude of 7.5 µT and an irradiation offset of 2500 Hz. The acquisition was then repeated with the same parameters but without the introduction of the MTR contrast. MTR was then computed using the formula MTR=(S0-SMTR)/S0, where S0 and SMTR represent respectively the signal intensities in the FLASH acquisitions without and with the introduction of the MTR contrast. The total acquisition time for both data sets was of 6 min 31.6 s; (c) Finally, assessments of the relaxation time T2 were performed using a multislice spin-echo sequence with the parameters: 16 echoes spaced by 11 ms, TE from 11 to 176 ms, TR 3000 ms, fat suppression as described above. T2 was determined by exponentially fitting with Origin2021 (OriginLab, Northampton, MA, USA) the mean signals as function of TE from ROIs placed in the corpus callosum (cc) and the external capsule (ec). All three sequences were run using the same anatomical parameters: field-of view 20x18 mm2, matrix size 213x192, pixel size 0.094x0.094 mm2, slice thickness 0.5 mm, 15 adjacent slices.
Post-mortem analyses
Before animals were perfused trans-cardiacally by phosphate-buffered saline under isoflurane anesthesia, blood was withdrawn by heart-puncture. Brains were removed from the skull and the forebrain (excluding olfactory bulb, brainstem and cerebellum) was used for biochemical assessments and histology. In the study with the TREM2-KO animals were also perfused with 4% paraformaldehyde. All brains subjected for histology were fixed in 4% paraformaldehyde for 48 h at 4°C. Analyses were performed blind to the genotype and treatment of the mice.
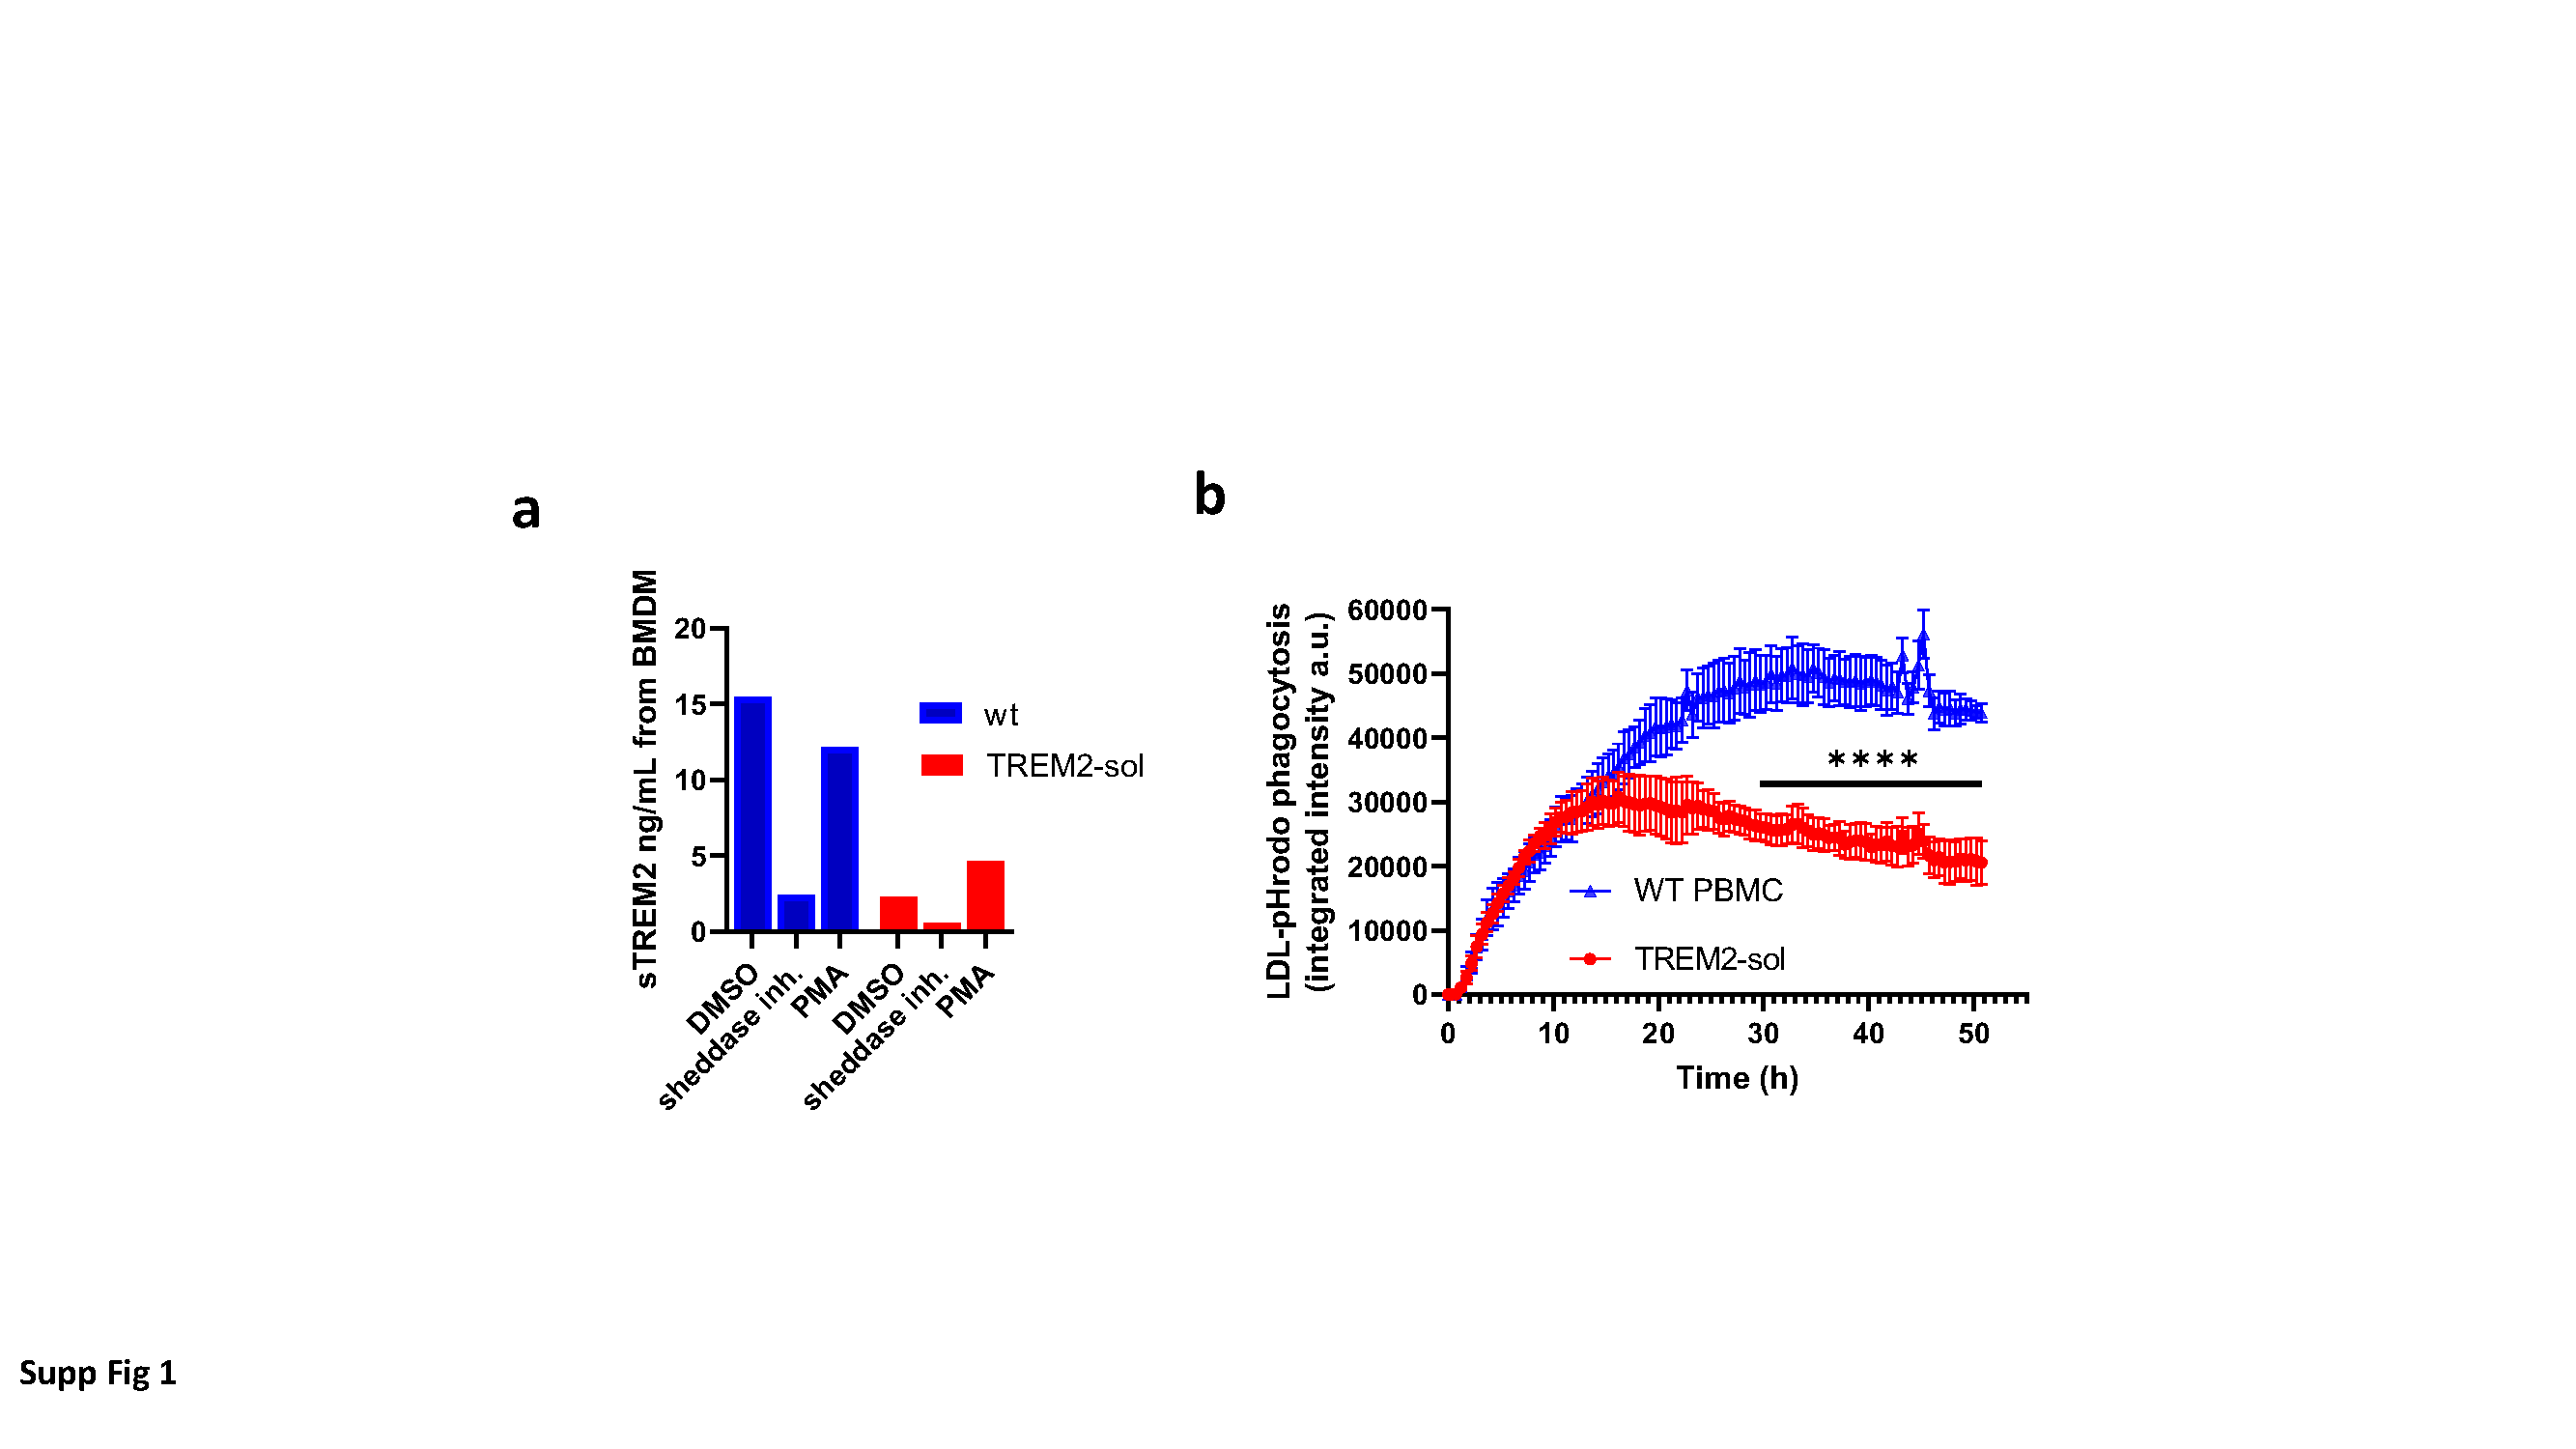
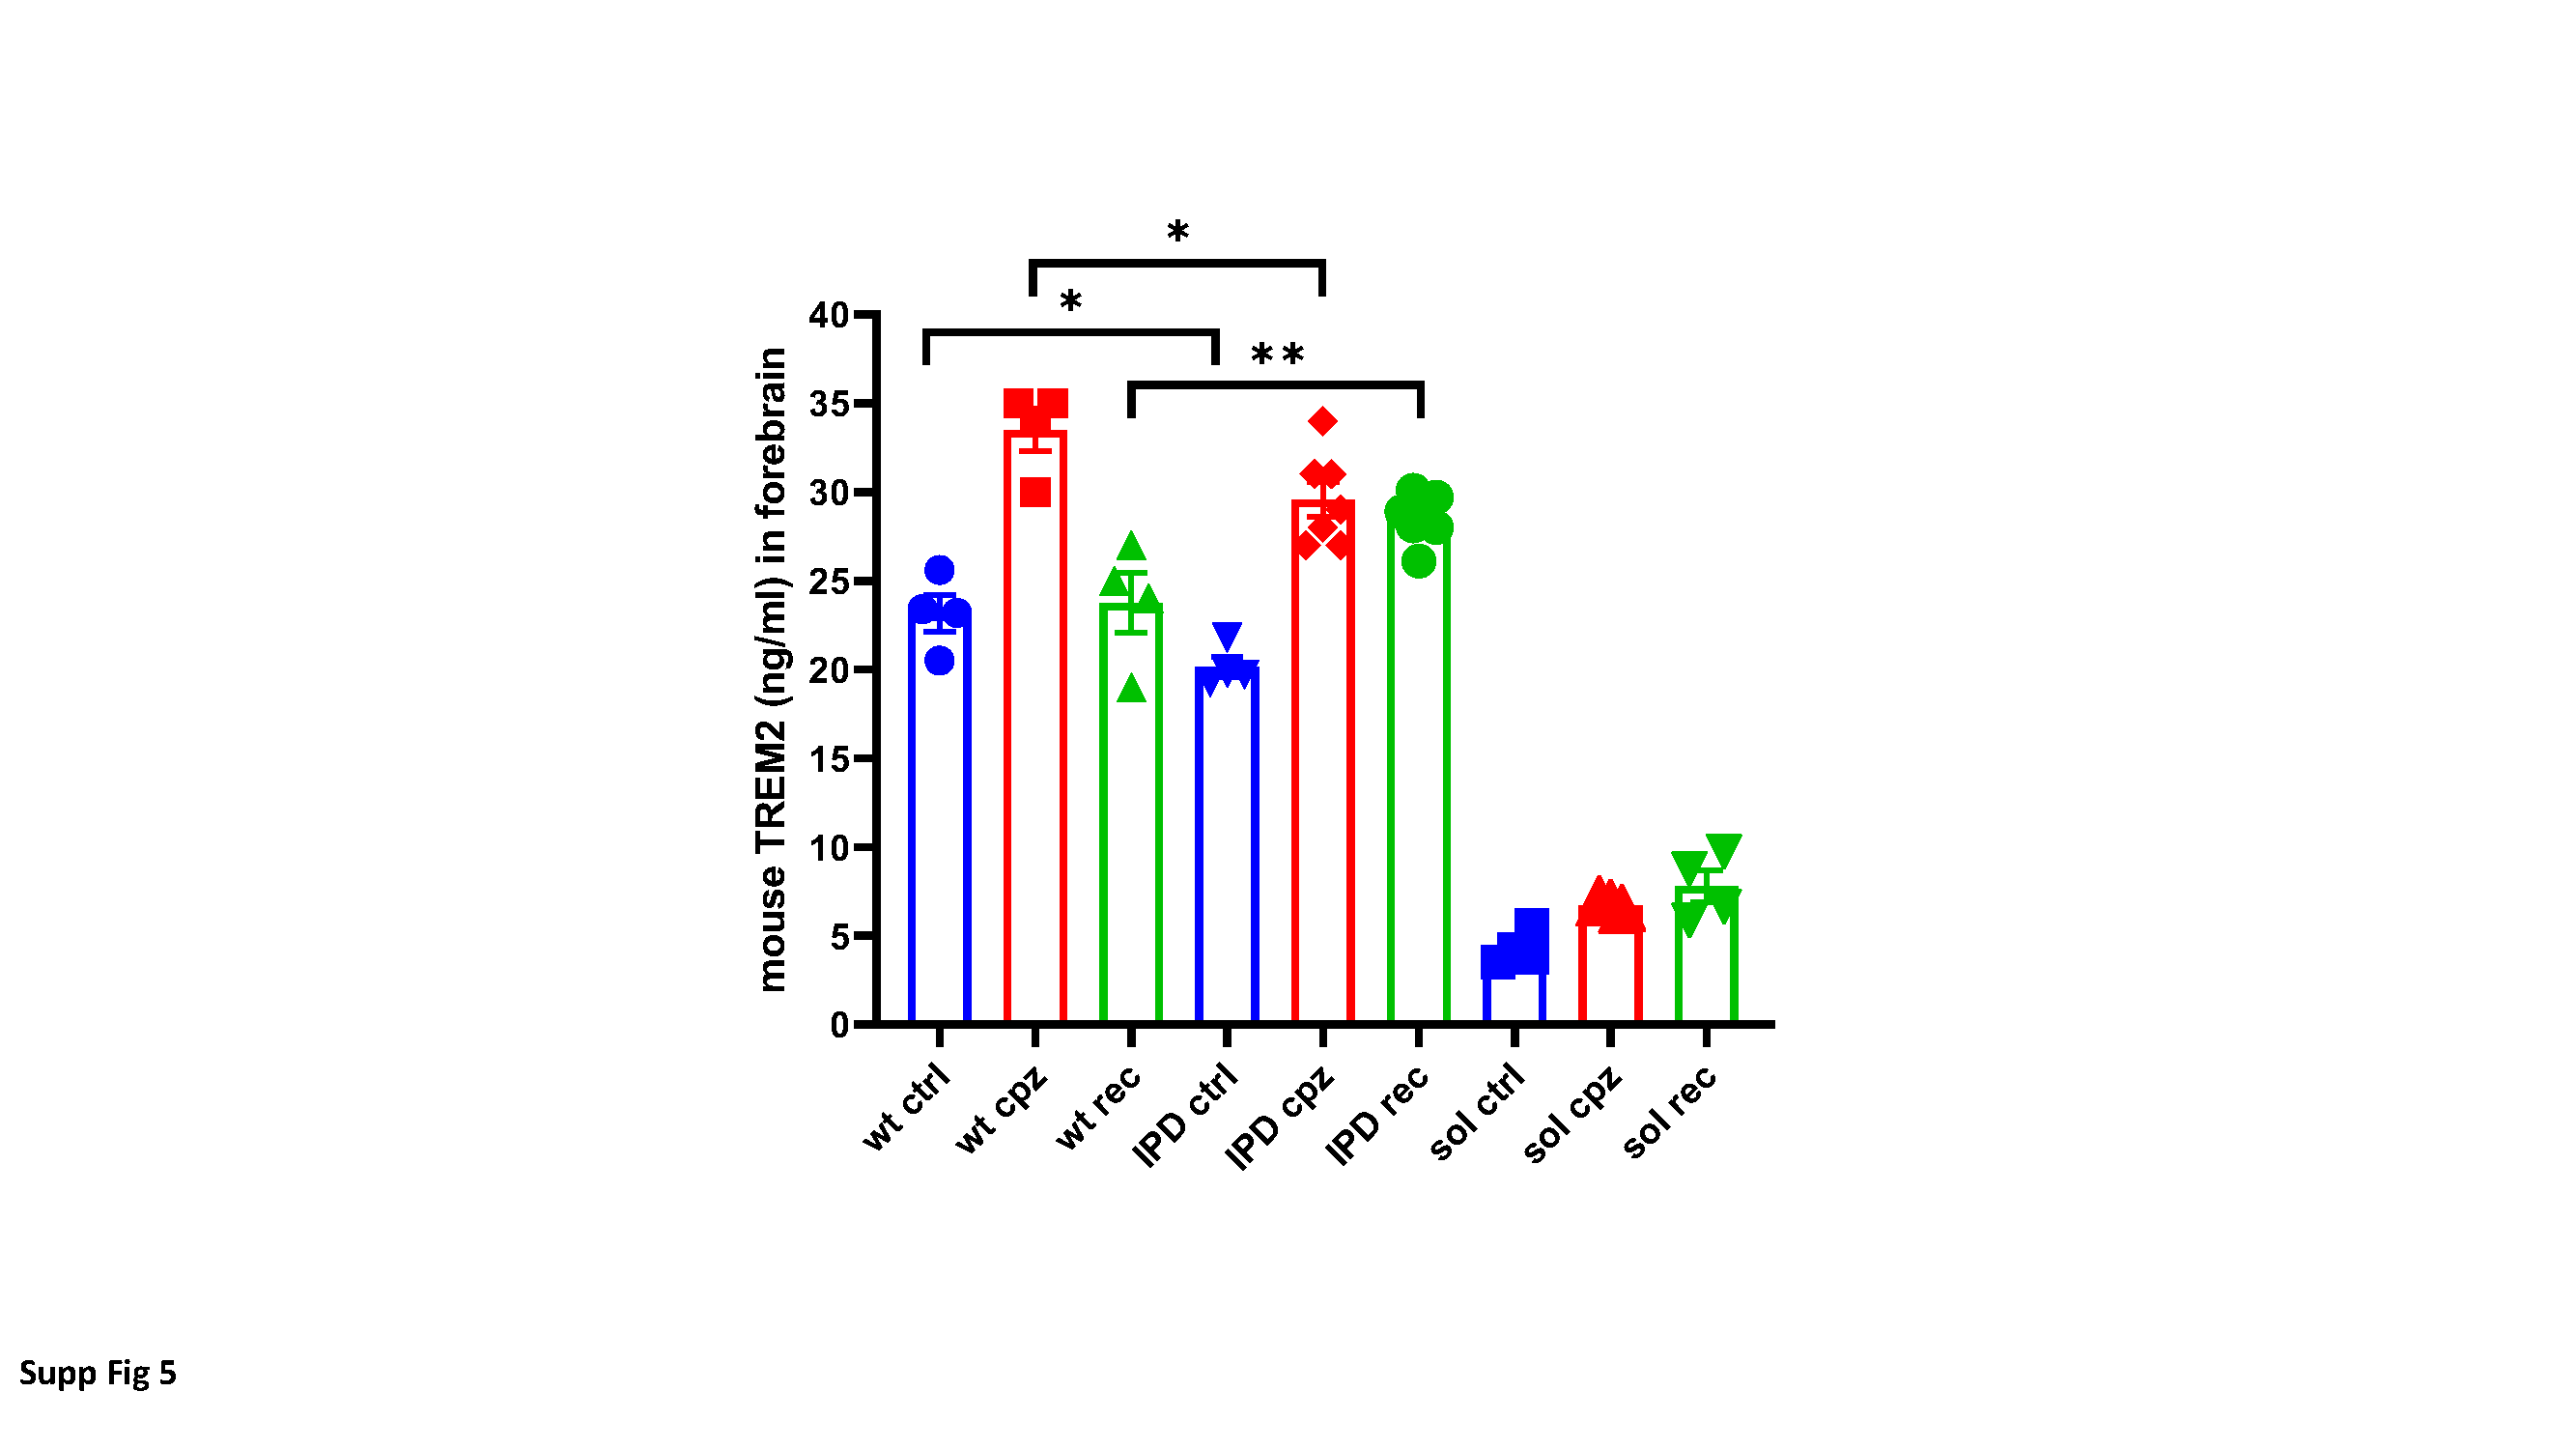
Mouse TREM2 determination from brain and cell culture supernatant
Mouse forebrain was homogenized in 1:10 (w/v) Tris-buffered saline (TBS) containing Complete protease inhibitor (Roche Diagnostics, Switzerland) using an ultrasonic device. Fifty microliters of TBS containing Complete Protease inhibitor were mixed with 50 µl of homogenate and incubated on ice, with regular vortexing for 15 minutes. The extract was centrifuged for 15 minutes at 100000xg and the clear supernatant (50 µl) was transferred to the ELISA plate. Medium from cultures of bone marrow derived macrophages (BMDM) was collected, spun down at 1000 RPM for 5 minutes and 25 µl of the supernatant was added onto the coated 96-well plates. Polyclonal sheep anti-TREM2 antibody AF1729 (R&D Systems, Minneapolis, MN, USA) at 0.2 mg/ml in PBS was used as coating antibody. Samples were incubated for two hours and the plate was washed. For detection, wells were filled with 50 µl of 0.5 µg/ml of biotinylated anti-TREM2 antibody AF1729 (R&D Systems), incubated 1 hour at room temperature and washed. Streptavidine-horseradish peroxidase (# 893975, R&D Systems) and tetramethylbenzidine/H2O2 substrate were added
at room temperature, and the reaction was stopped after 20 minutes by addition of 2 N sulfuric acid. Absorbance at 450 nm was read with a SpectraMax Plus 384 reader (Molecular Devices, San Jose, CA, USA). Recombinant mouse TREM2 (Novoprotein, Wuijang, PR of China, Cat # CM92) from 39 pg/ml to 2500 pg/ml was used as standard.
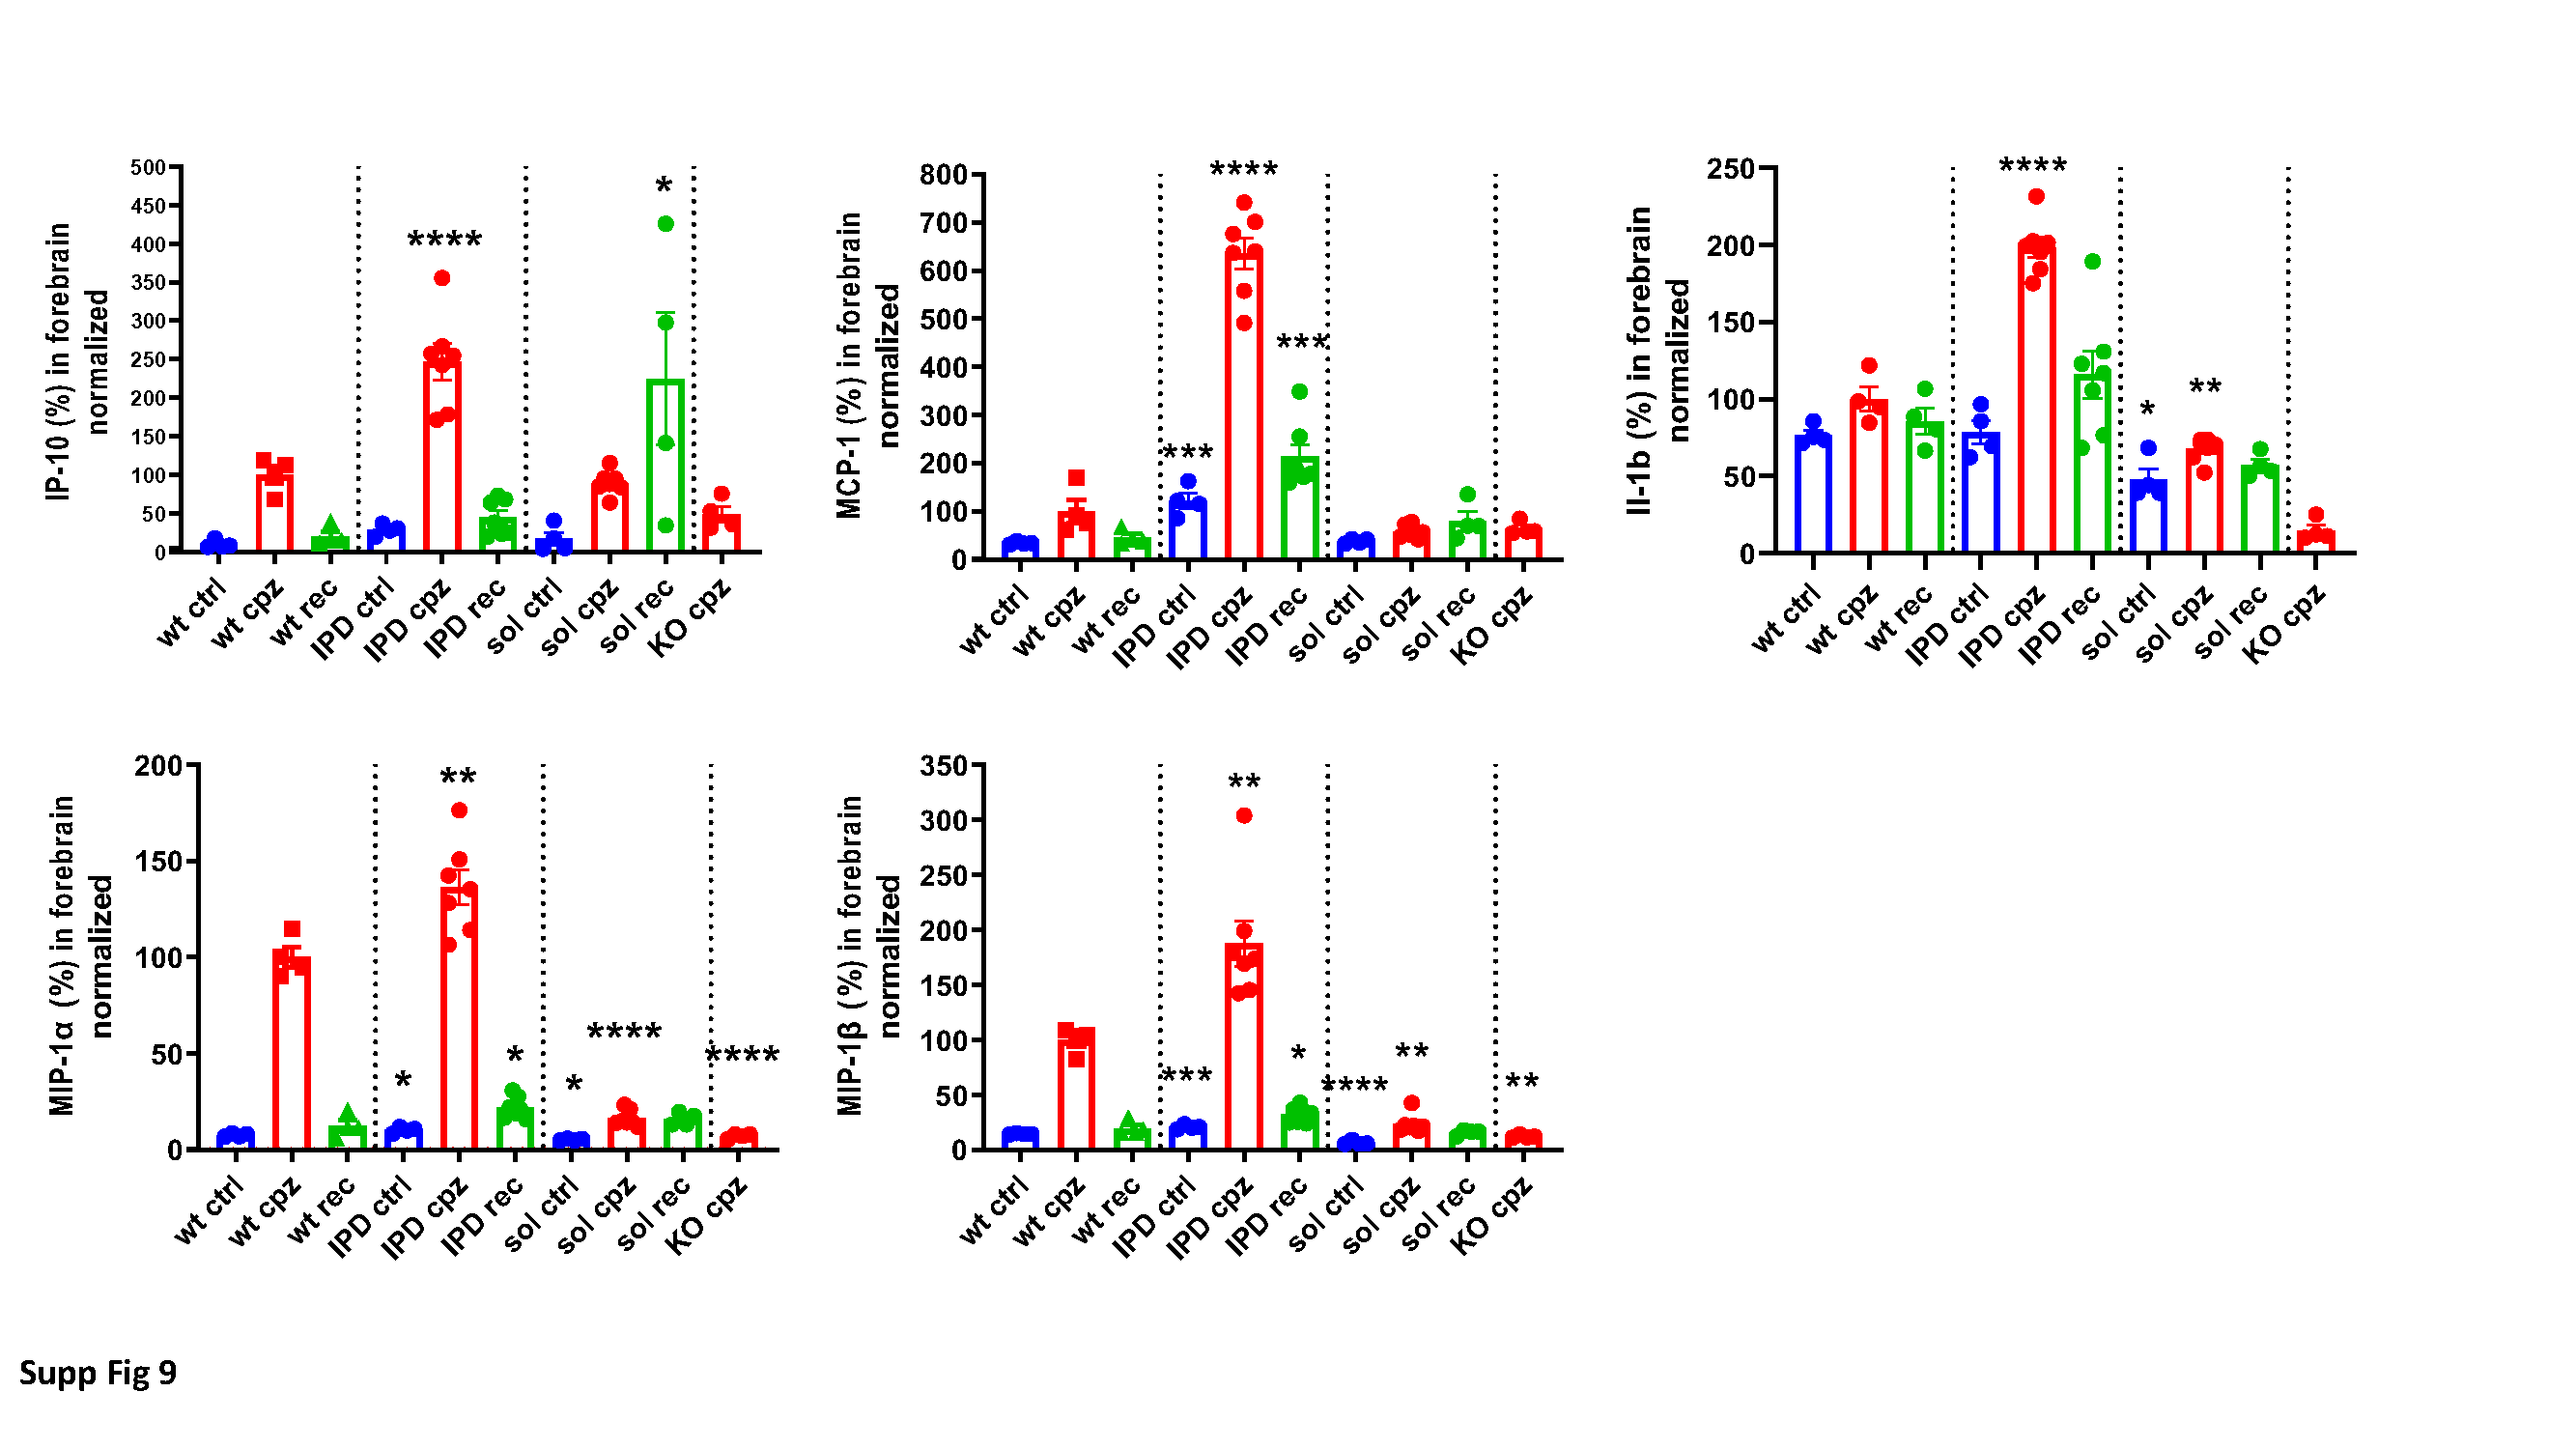
Cytokine/chemokine measurements
Half brains were dounce homogenized 1:10 (w:v) in TBS, aliquoted and stored at -80°C. Radioimmunoprecipitation assay buffer (Merck Millipore 20–188 ) was added ten times to an aliquot, mixed and incubated on ice for 10 min, then centrifuged for 5 min at 10000rcf at 4°C. Supernatants (1:2 in diluent 41) were used for U-plex (mouse) Meso Scale Discovery (Acro Biosystems, Newark, DE, USA) electrochemiluminescence analyses according to manufacturer`s protocol.
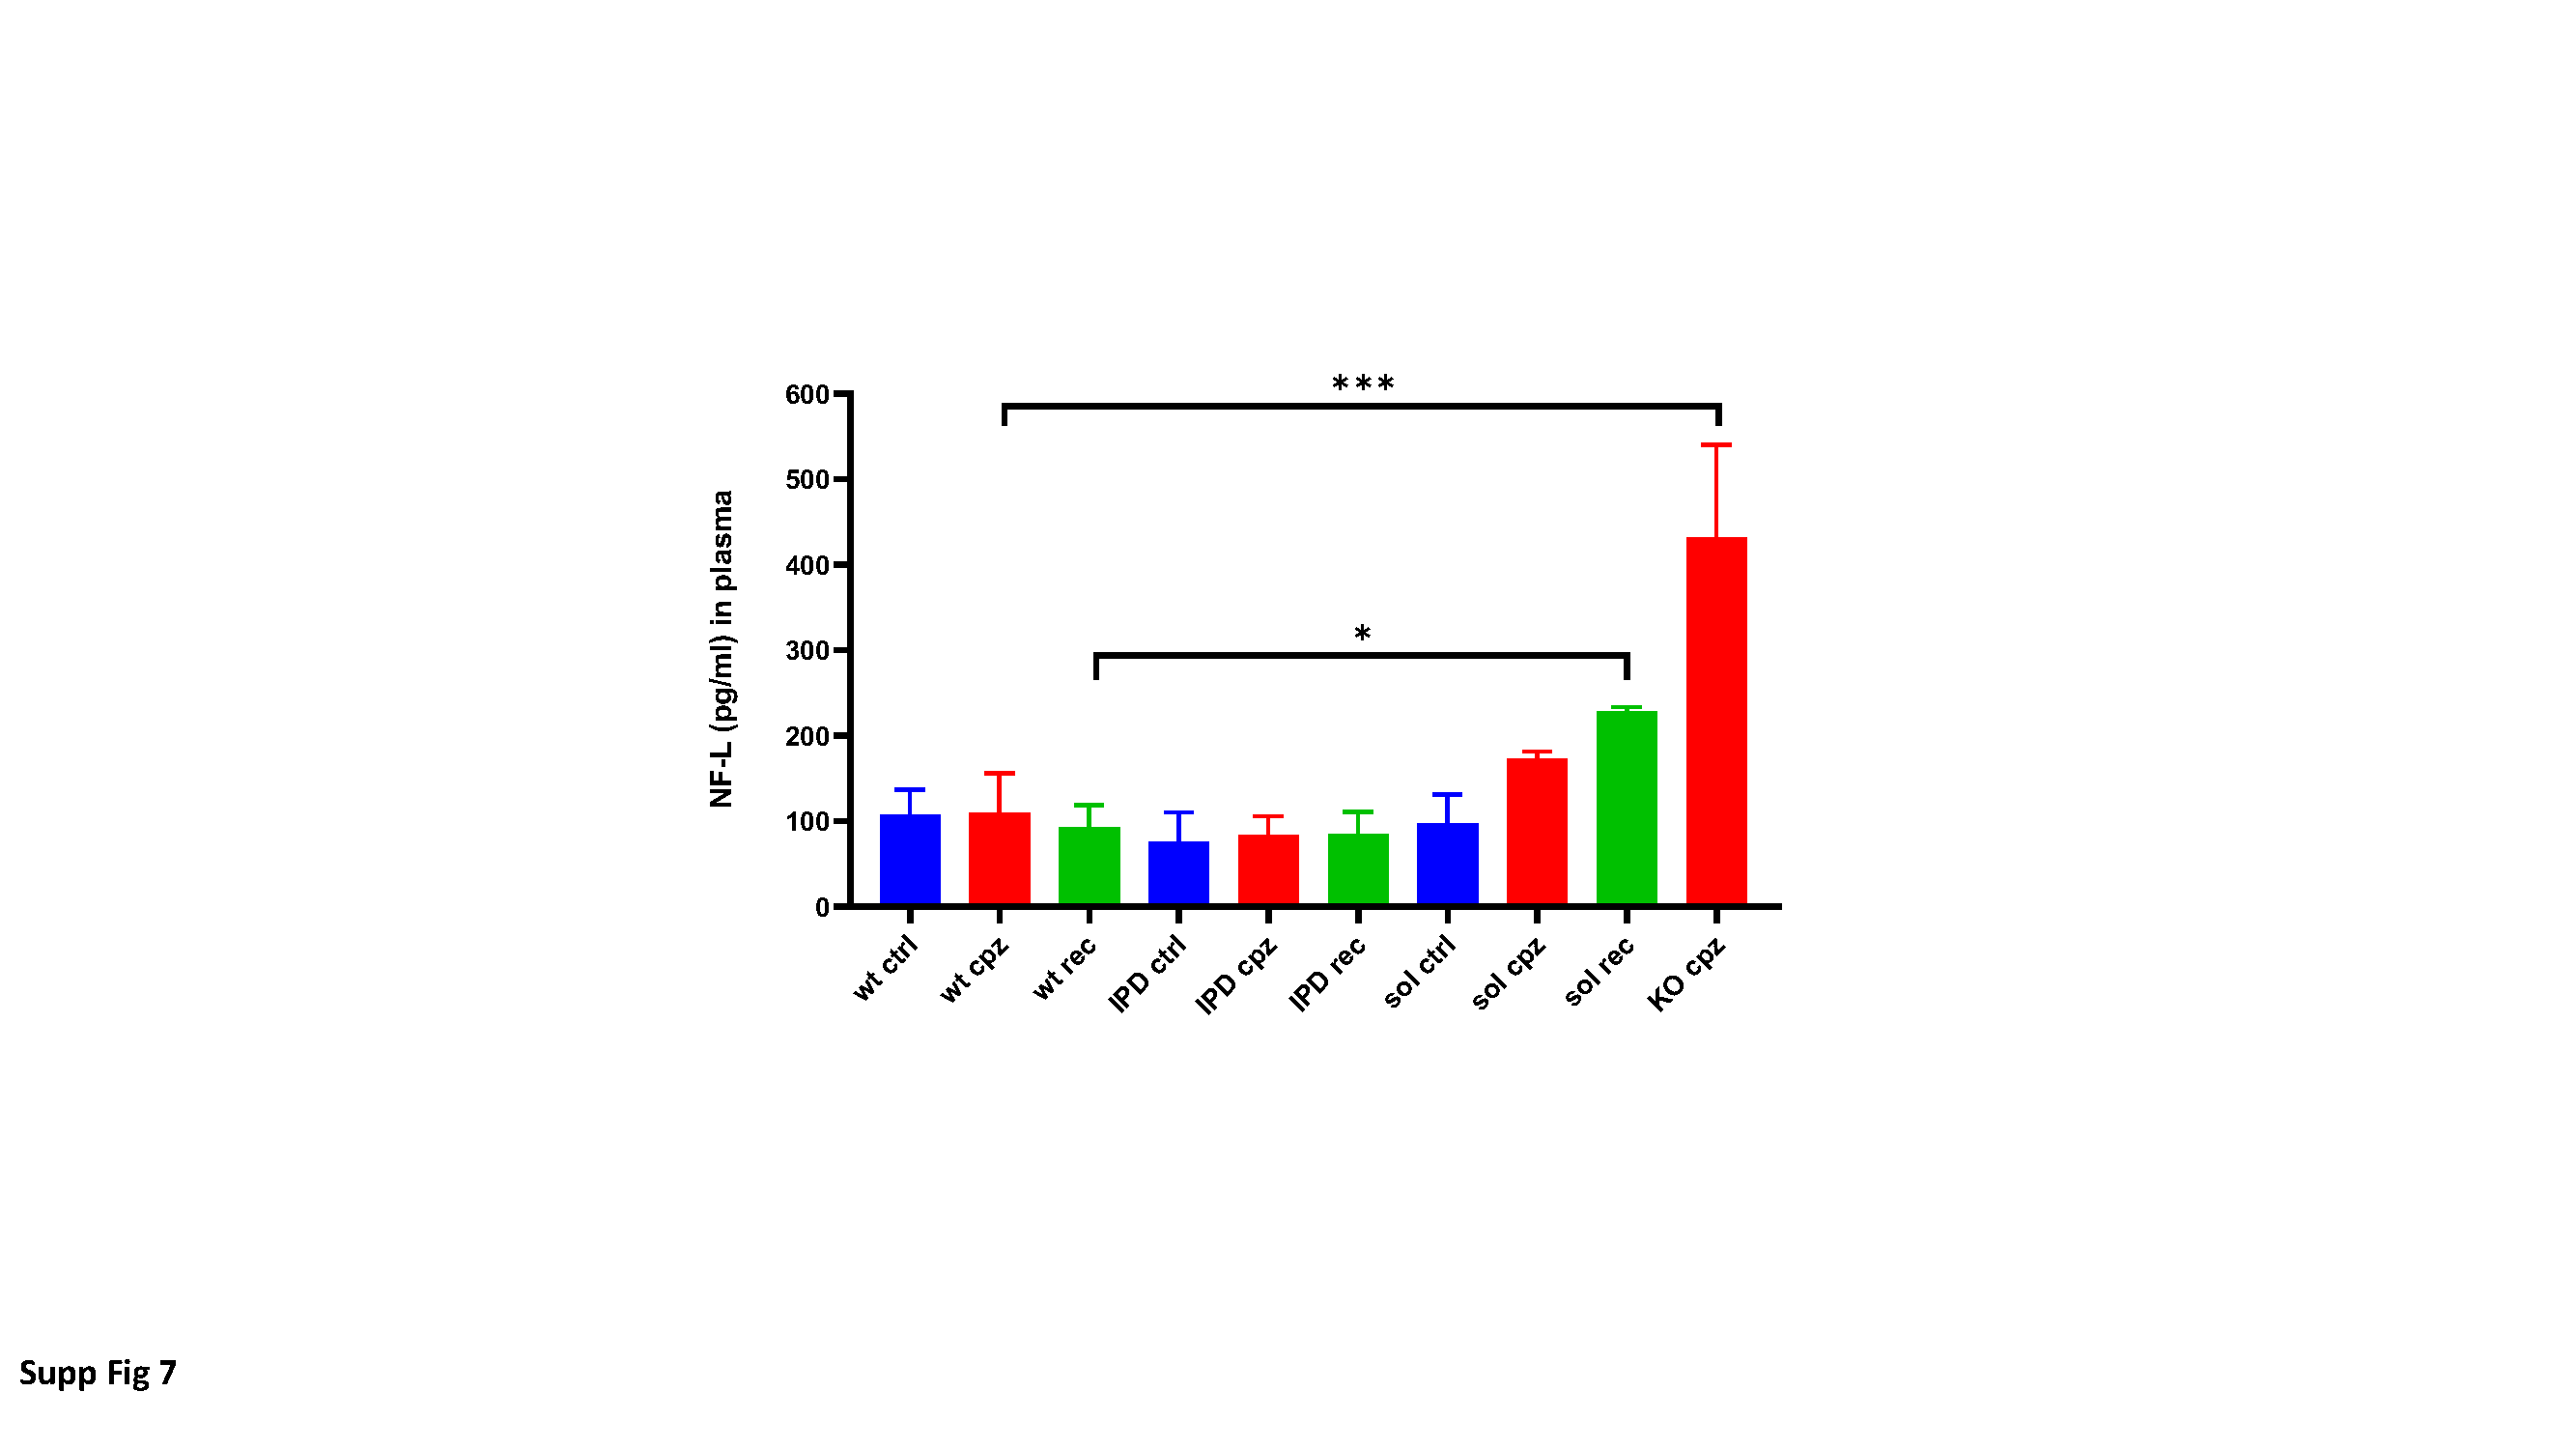
Mouse plasma NF-L measurements
Plates (MesoScale Discovery (MSD) Multi Array 96well, L15XA-3) were coated with 25µL capture antibody working solution 25µL/ well (Uman Diagnostics, α-NF-L mAb 47:3 (UD1); 2.35mg/ml; diluted in PBS to 0.5ug/mL), shaked for 10min and incubated overnight at 40C. Plates were washed 3x with 150µl wash buffer (0.05% Tween20 (Sigma, CAS 9005-64-5) in 1xTBS (Sigma, T5912-1L)). Blocking was performed with 150µL blocking buffer / well (2% BSA (fraction V) in wash buffer) and incubated 1h at room temperature. Plates were again washed 3x with 150µl wash buffer. Standard (NF-L, Uman Diagnostics, 27001) and plasma samples (dilution on plate 1:2 in 1xTBS with complete (protease inhibitor cocktail tablets (Roche)) were added (25µL per well, in sample dilution buffer (0.1% BSA in wash buffer)) and plates were sealed and incubated 2h at room temperature. Plates were washed 3x with 150µl wash buffer. Detection antibody (Uman Diagnostics, biotin labelled α-NF-L mAb 2:1 (UD3); 0.86 mg/ml; diluted to 0.5µg/ml in 0.5% BSA;) was added (25µL per well in detection antibody dilution buffer (0.5% BSA in wash buffer)) and plates were sealed and incubated for 1h at room temperature. Plates were washed 3x with 150µl wash buffer. Streptavidin SULFO TAG (MSD SulfoTag, CAT R32AD-1, 500µg/mL working dilution: 1:1000 in PBS) was added (25µL/well) and incubated for 30-60min at room temperature in the dark. Plates were washed 3x with 150µl wash buffer. 2xread buffer (Cat. R92TC-3, working solution 1:2 in destilled water) was added (150µL / well) and plates were analysed with the plate reader (MSD SECTOR Imager 600).
Culture of bone marrow-derived macrophages (BMDM)
BMDMs were prepared from three adult WT and TREM2-sol mice. Tibia and femur bones were dissected clean of surrounding muscle tissue and the marrow was flushed out using a 30G needle fitted onto a 10 ml syringe. The cell suspension was filtered through a 100 µm cell strainer and incubated for 5 minutes in red blood cell lysis buffer. Following centrifugation, BMDM were washed with PBS and resuspended in a RPMI1640 culture media containing 10% FBS (Gibco, 10082147), 1% Pen/Strep (Gibco, 15070063), 1% Sodium pyruvate (Gibco, 11360-070), 1% NEAA (Gibco, 11140035), 0.025 M HEPES (Gibco, 15630080), 50 µM β-Mercaptoethanol and 40 ng/ml M-CSF (R&D systems, 416-ML-050). Three days after seeding, cells were replenished with media containing 40 ng/ml M-CSF, 20 ng/ml M-IL4 (R&D systems, 404- ML-050) and 20 ng/ml M-IL13 (R&D systems, 413-ML-005). BMDM were used in experiments after one week of differentiation.
For measurement of cell surface TREM2 expression, BMDM were treated with either 5 µM DPC333 (Bristol-Myers Squibb, Princeton, NJ, USA) [10] O/N or with 50 ng/ml para-methoxyamphetamin (PMA, Sigma Aldrich, 19–144) for 30 minutes. Cells were detached using TrypLE enzyme (ThermoFisher, Basel, Switzerland, 12605010) once and incubated with FC block (anti-CD16/32; eBioscience, ThermoFisher, 14-0161-85) in FACS buffer (PBS containing 2% FBS, 0.5 mM EDTA and 0.05% sodium azide) for 20 minutes at 4°C. Then, cells were stained in suspension with biotinylated anti-mouse TREM2 antibody (R&D Systems, BAF1729) for 30 min at 4°C. Streptavidin-AF488 secondary antibody was added for 30 min at 4°C. Staining was analyzed in a Fluorescence Activated Cell Sorter (FACS) from BDBiosciences (FACSCanto) upon gating for LIVE/DEAD Fixable aqua (Molecular Probes, Eugene, OR, USA, L34966) to remove dead cells.
Phagocytosis by bone marrow-derived macrophages (BMDMs)
For in-vitro phagocytosis, BMDMs from WT and TREM2-sol mice were plated in Poly-L-lysine coated 96-well plates at seeding density of 40,000 cells/well and let attach for 3 hours. pHrodo™ Red LDL (ThermoFisher, L34356; 1 µg/ml) was diluted in BMDM medium and added to individual wells. The plates were placed in an IncuCyte S3 live cell analysis system (Agilent Technologies Switzerland, Basel, Switzerland) and four images per well were acquired every hour for 9 hours. The integrated fluorescence intensities were extracted for each well and analyzed in a GraphPad Prism software (Graphpad Software Inc., La Jolla, CA USA).
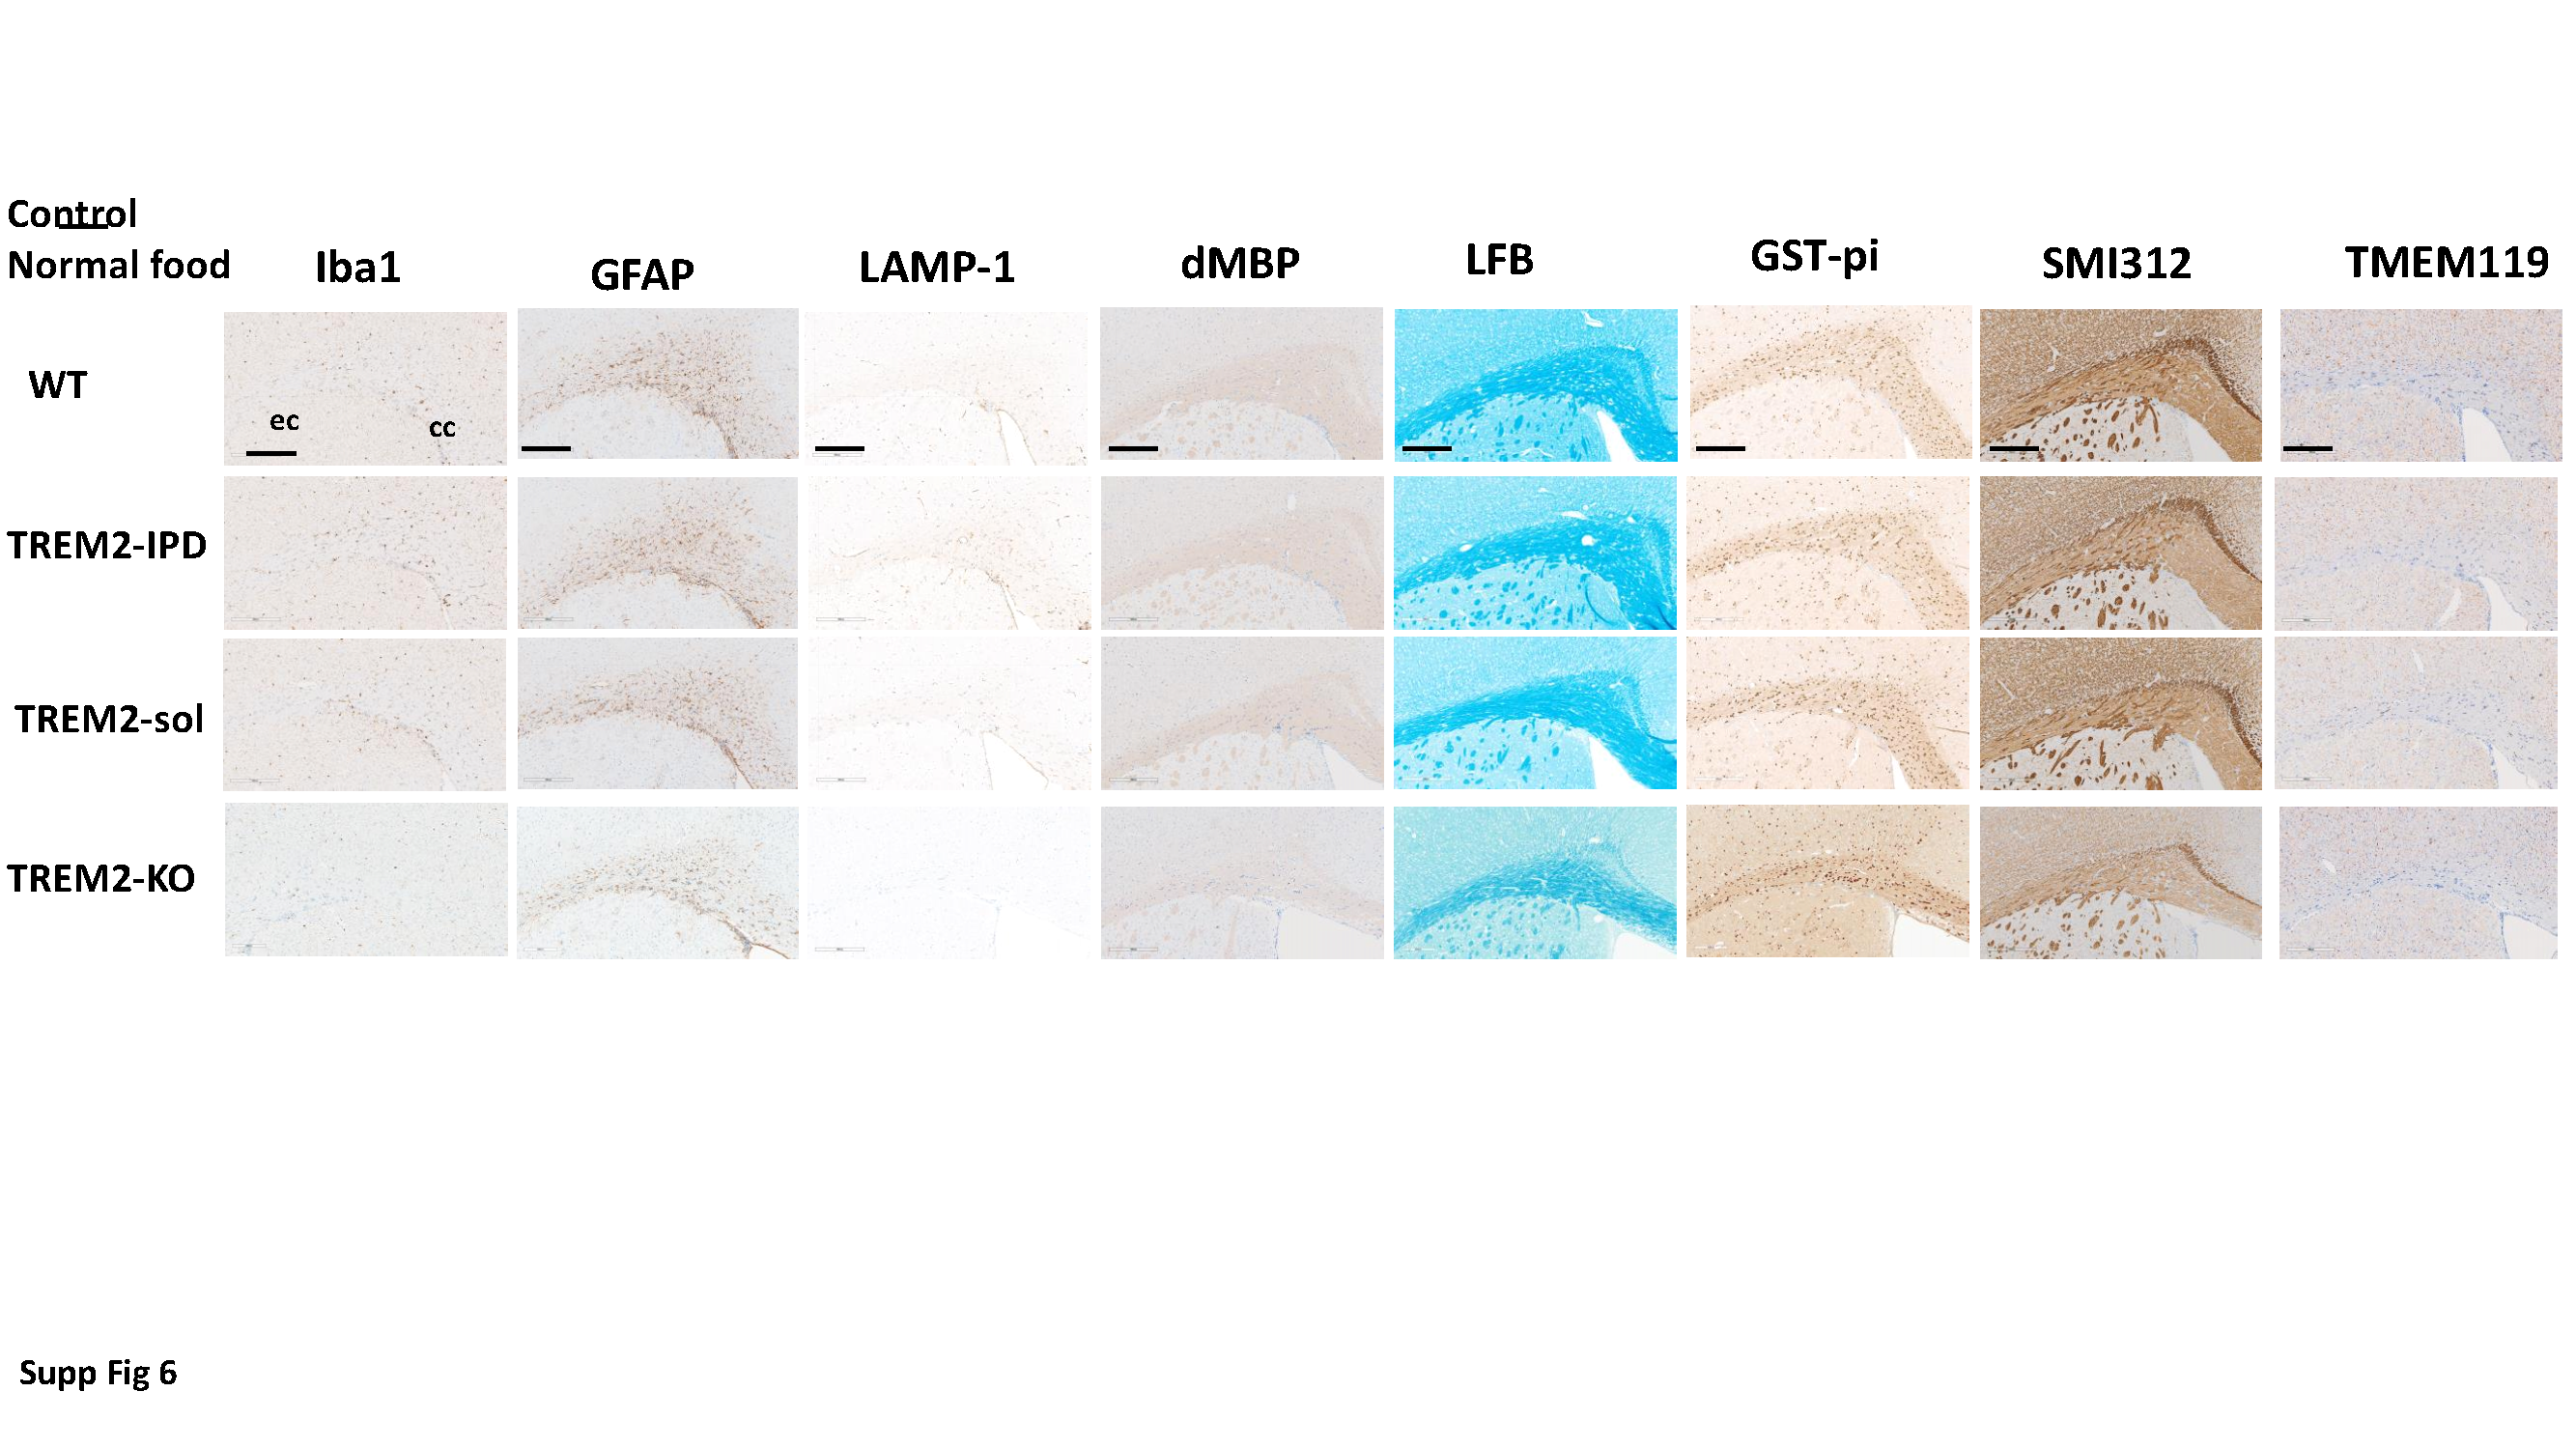
Histology of brains
After fixation, brains were processed for paraffin embedding by dehydration through increasing ethanol series. Paraffin sections of 3 µm thickness (coronal brain sections from the preoptic area, coordinates according to Paxino and Franklin: interaural 4.9–3.94 mm, Bregma 1.1–0.14 mm) mounted on SuperFrost + slides (Thermo Fisher Scientific, Reinach, Switzerland) were automatically immunostained using the Discovery XT technology (Ventana, Roche Diagnostics, Rotkreuz, Switzerland). Sections were deparaffinized, rehydrated, subjected to antigen retrieval by heating with CC1 cell conditioning buffer for 28–68 min according to the antibody, then incubated for 1–3 hours according to the primary antibody at room temperature with primary antibody diluted in antibody diluent (Ventana), incubated with the respective biotinylated secondary antibody diluted in antibody diluent, reacted with a DABMab kit (Ventana) and counterstained with Hematoxylin II and Bluing reagent (Ventana). Slides were washed with soap in hot tap water and rinsed under cold running tap water to remove the soap, then dehydrated and embedded with Pertex.
For luxol fast blue (LFB) staining, slides were deparaffinized and rehydrated to 95% ethanol. Slides were then incubated in LFB solution [Solvent Blue 38 (Sigma S3382) in 95% ethanol and 10% acetic acid (Sigma 695092)] overnight at 60°C, rinsed in 95% ethanol for 1 min, then in distilled water for 2 min and in 0.05% lithium carbonate (Merck 105680; Merck Millipore, Schaffhausen, Switzerland) for 5 s. Subsequently, slides were rinsed in 70% ethanol twice for 10 s, then in distilled water for 2 min. The rinsing was repeated in 0.05% lithium carbonate prepared freshly, 70% ethanol and distilled water until there was a sharp contrast between the blue of the white matter (myelin) and the colorless grey-matter. Finally, slides were dehydrated starting with 95% ethanol and mounted in Pertex.
Antibodies
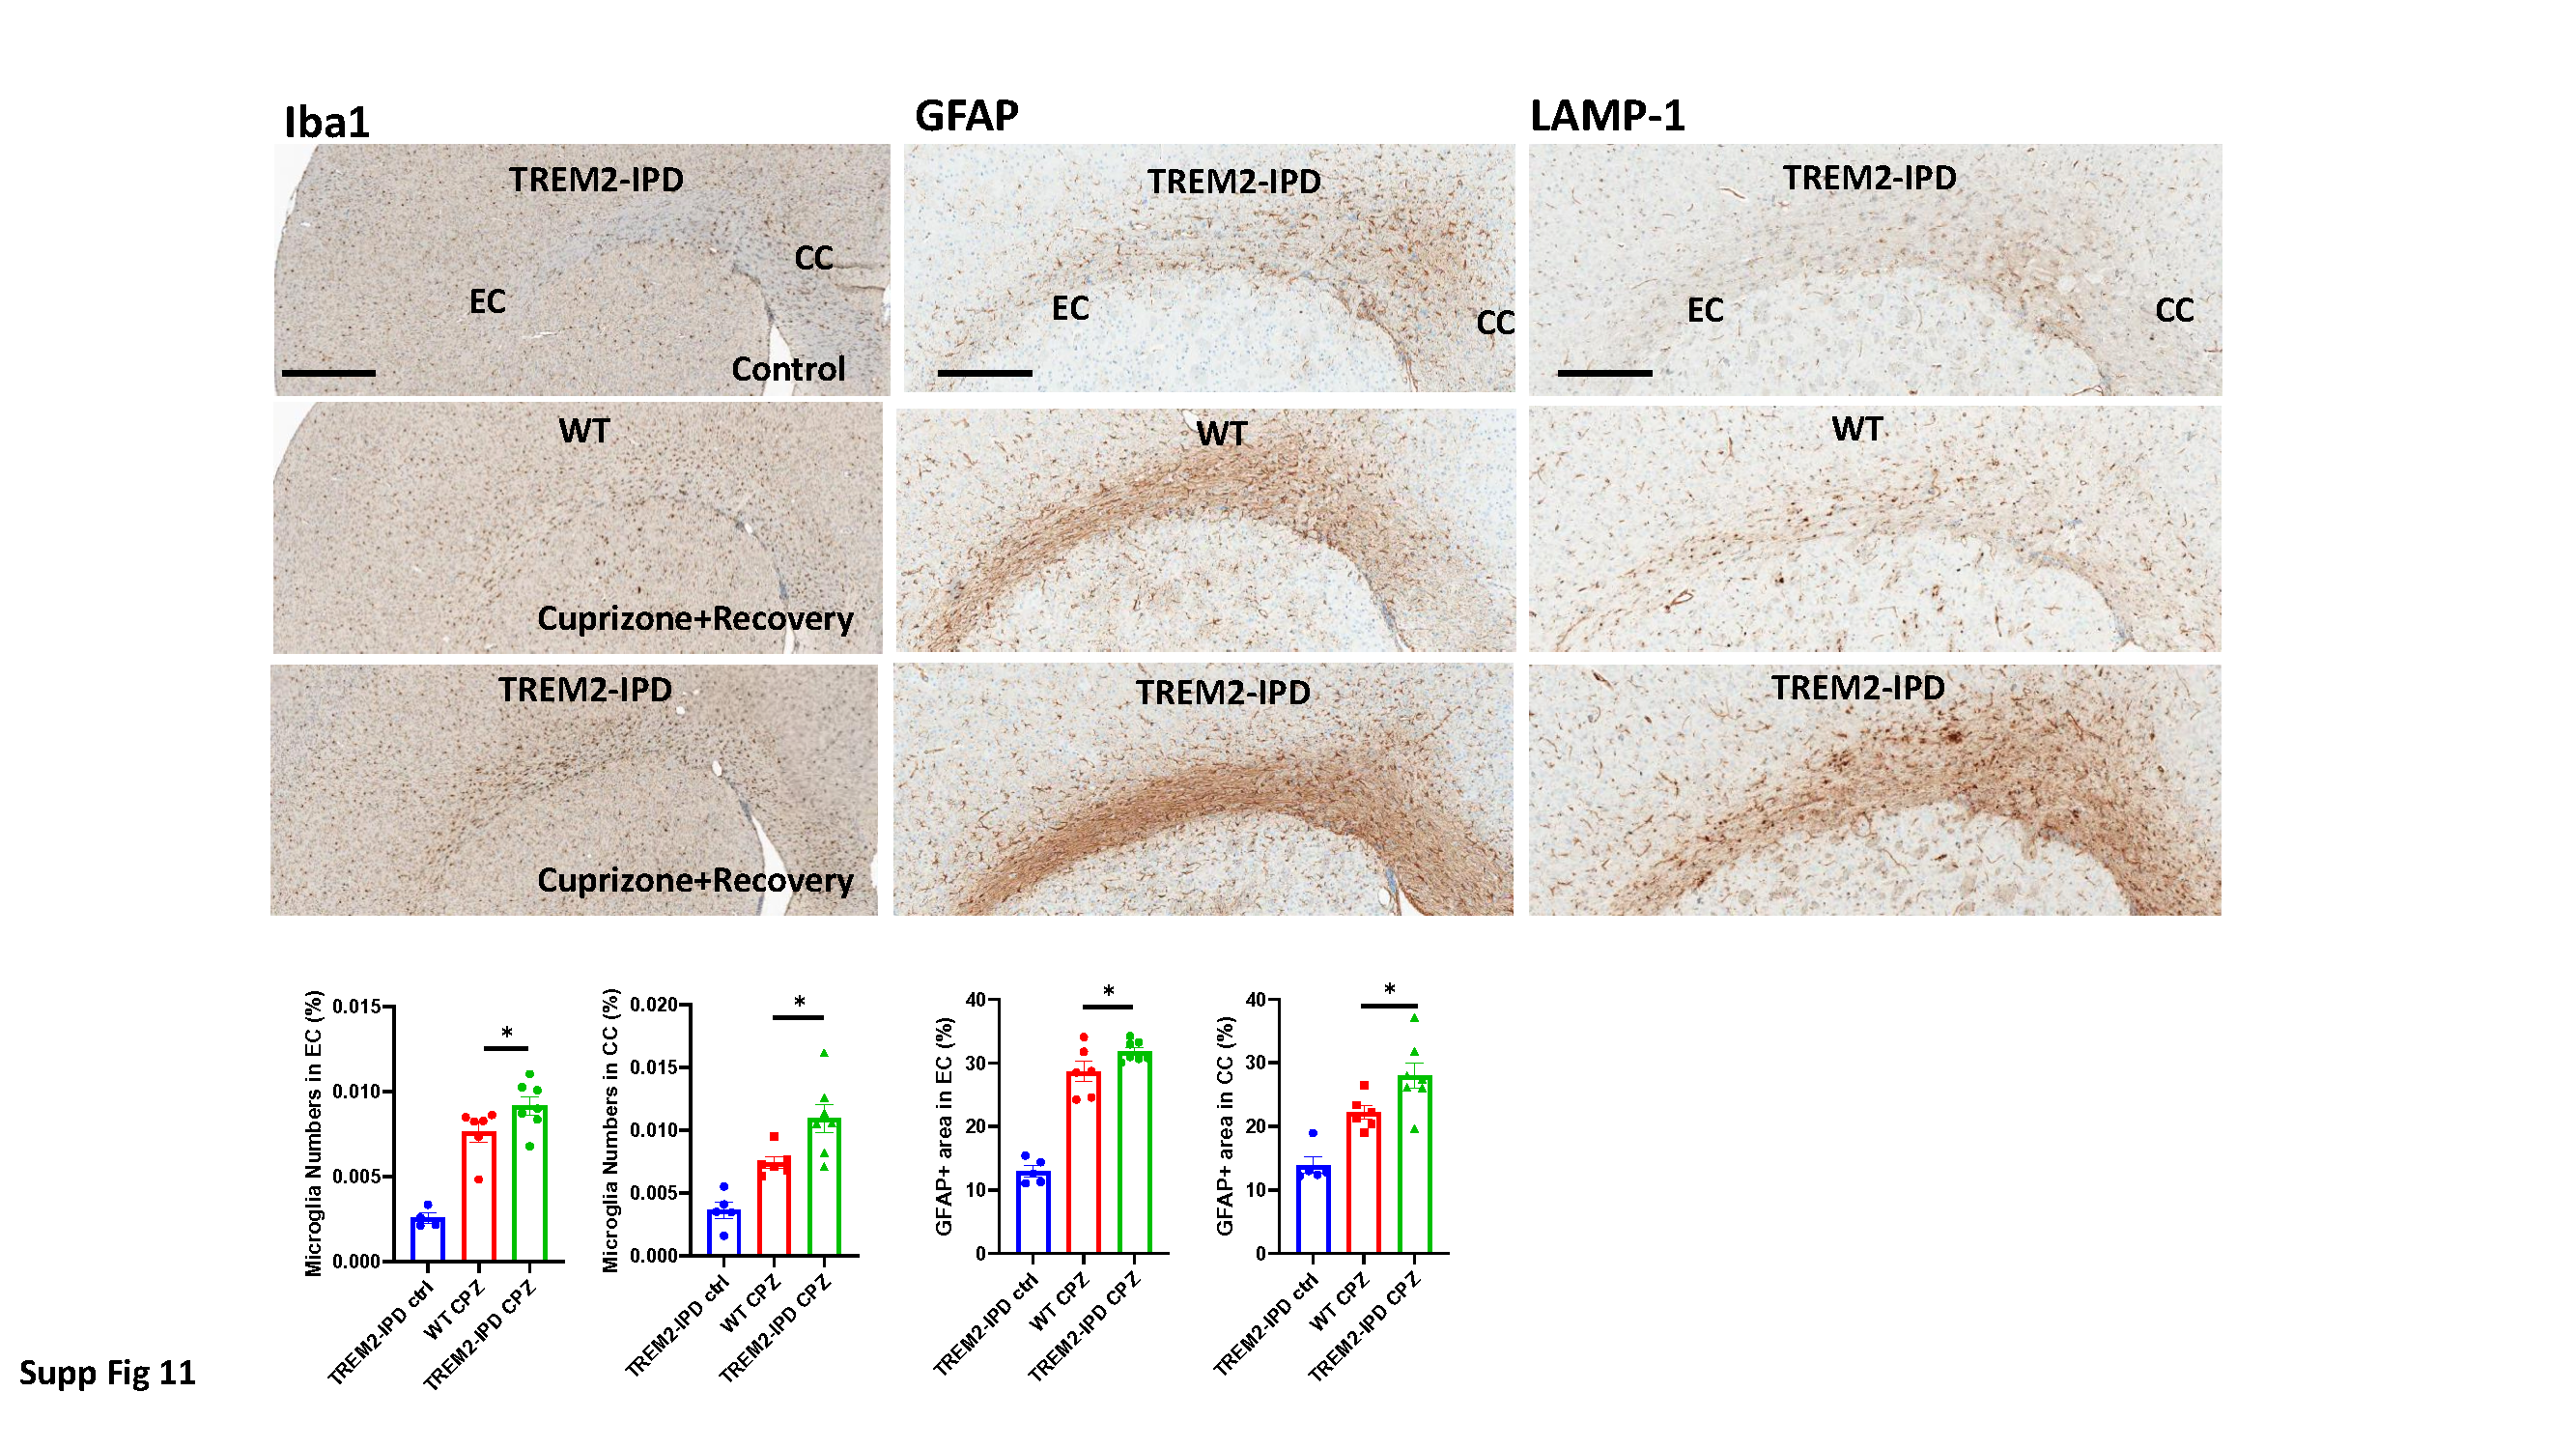
Primary antibodies were: rabbit anti-mouse myelin basic protein (MBP) (Dako A0623; Dako, Carpinteria, CA, USA) 1:1000; rabbit anti-mouse glutathione S-transferase-π (GST-π) (MBL 312; MBL International, Woburn, MA, USA) 1:500; Rabbit anti-Iba1 (Wako 019-19741, 50 µg/100 µl) 1:500; rabbit anti-GFAP (glial fibrillary acidic protein, Dako Z0334) 1:5000; rabbit anti-dMBP (debris of MBP) (Merck Millipore AB5864) 1:3000; mouse anti-Neurofilament (Covance SMI312; BioLegend Covance, San Diego, CA, USA) 1:5000; rat anti-LAMP-1 (CD107a, Bio-Rad, Cressier, Switzerland, MCA4707T) 1:200. Rabbit anti-TMEM119 (209064, abcam).
Secondary detection antibodies were: Goat anti-rabbit IgG biotinylated (Jackson ImmunoResearch 111-065-144; Jackson ImmunoResearch, Cambridgeshire, UK) 1:1000; Goat anti-rabbit IgG biotinylated (Vector BA-1000; Vector Laboratories, Peterborough, UK) 1:200 or 1:1000; Goat anti-mouse IgG biotinylated (Vector BA-9200) 1:1000
Analysis of histological images
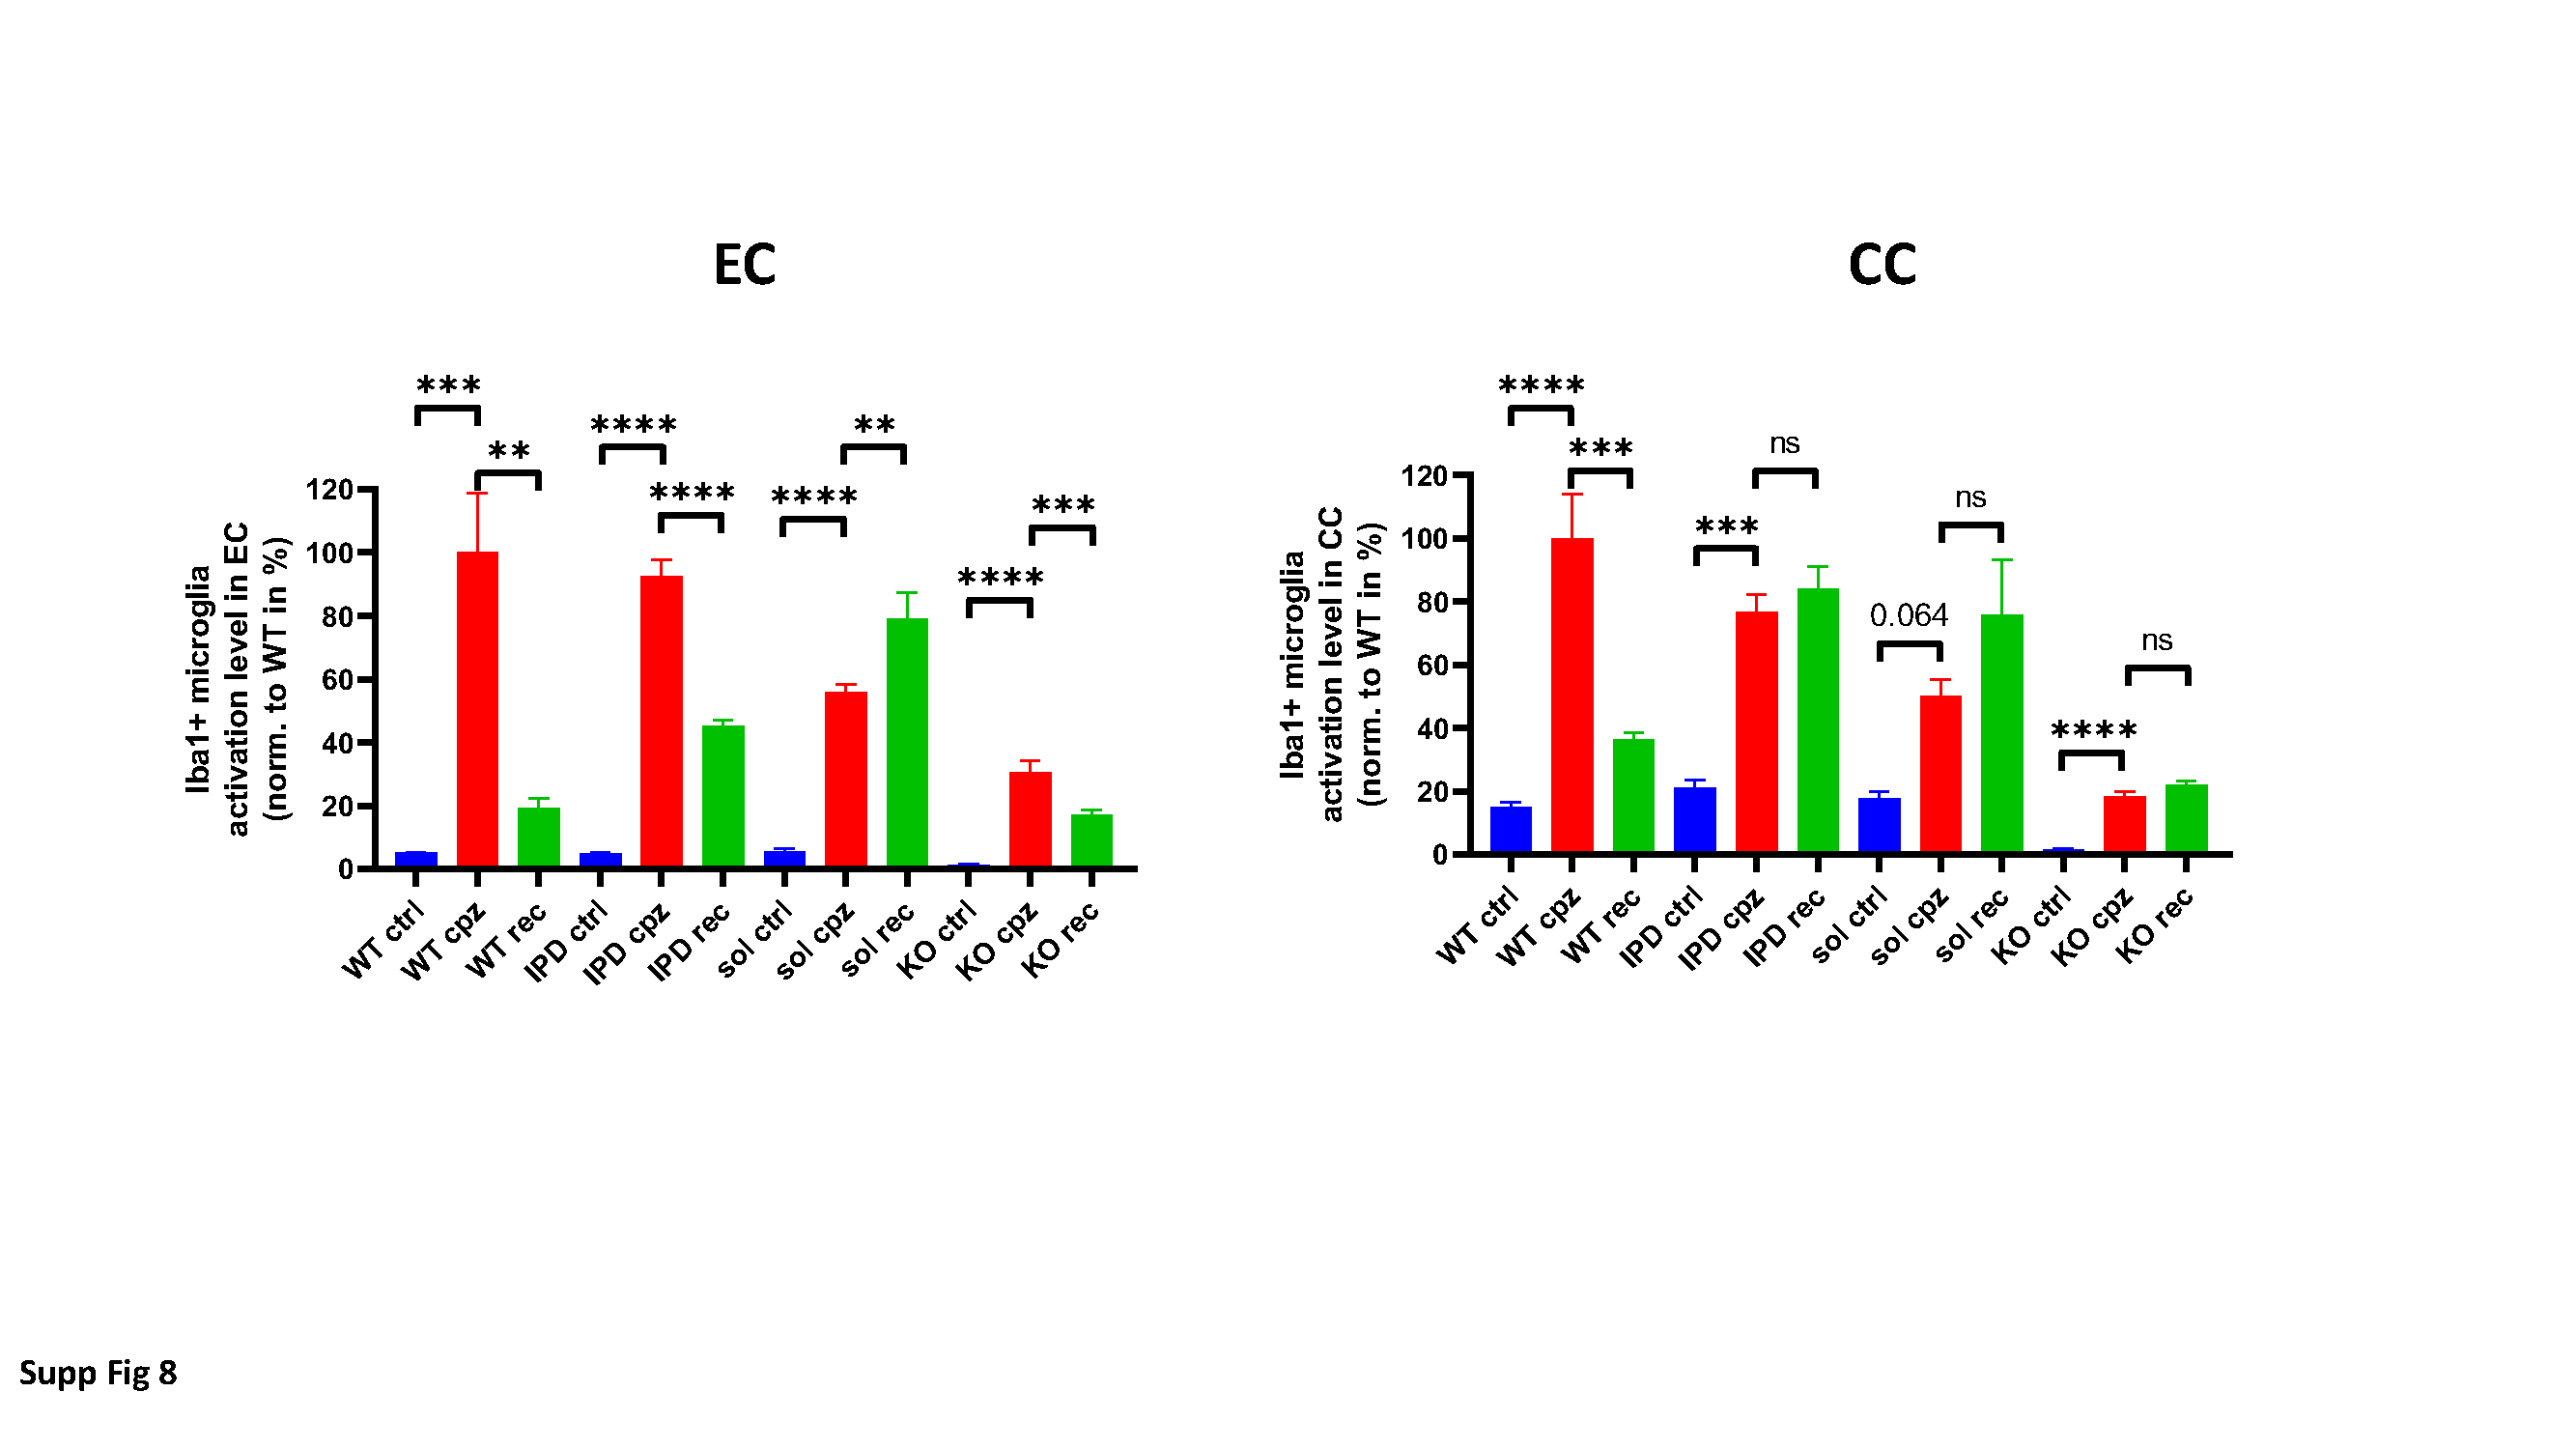
For the quantitative evaluation of microglia numbers and morphology based on image analysis from histological stained coronal brain sections, a proprietary image analysis platform (ASTORIA, Automated Stored Image Analysis, Novartis Pharma AG, Basel, Switzerland) was developed based on MS Visual Studio 2010 (Microsoft, Seattle, WA, USA) and many functions from Matrox MIL V9 libraries (Matrox Inc., Dorval, Quebec, Canada) as described elsewhere [2]. One to two coronal brain sections (from the preoptic area, approximate coordinates according to Paxinos and Franklin: interaural 4.9–3.94 mm, Bregma 1.1–0.14 mm) per animal were used for image analysis at the level of the corpus callosum (cc) and the external capsule (ec).
The following procedure was followed for the detection and analysis of soma, proximal and distal processes as described earlier [2]: 1. Brain sections containing immunohistochemically stained microglia (Iba1) soma and their proximal and distal processes (all in brown) were scanned with Aperio’s Scanscope (Leica Biosystems, Wetzlar, Germany) at 20x magnification. 2. Each image was processed using the ImageScope software (V12.1.0.5029, Aperio) according to the following steps: A: color deconvolution to obtain brown staining without blue; B: segmentation of brain tissue from white background through thresholding, morphological closing, filling of holes, opening and elimination of too small objects, resulting in a binary mask of the valid tissue and sample area; C: adaptive thresholding for the individual segmentation of soma, based on the average gray value of the blue channel of the color-deconvoluted brown image at sufficiently dark regions (indicative for soma). The computed threshold was used for binarization, and after size filtering yielded the soma mask image (within the valid sample region); D: segmentation of processes through morphological top hat transformation with a size to pick thin processes. Adaptive thresholding was applied again to segment the processes (using the previously determined gray average of brown objects), followed by binarization of the top hat image and size filtering of the resulting objects; E: subtraction of soma (that may also have been picked by top hat thresholding) to obtain an image mask of true processes; F: ultimate thinning of processes for length computation; G: proximal processes: A predefined number of dilations of soma was used to define a reference (marker) region for proximal soma, employing a circle around the soma centre to define the cutoff boundary for proximal processes. Thinned proximal processes with marker in dilated soma and limited by circular influence zones (set of “proximal thinned processes”) were then reconstructed around the soma centre. “Final proximal processes” were collected through reconstruction of all processes having markers in the “proximal thinned processes” set; H: soma was added to proximal processes to obtain a set of “visible microglia”; I: Distal processes: Reconstruction of processes from proximal processes only (i.e. ignoring those in the background or from the soma in a different focus plane), then subtraction of circular regions defining proximal processes to yield a set of distal processes; J: in the optical density computation for soma as well as “visible microglia” (individual soma + proximal processes complex within circular reference region), local background (non-visible microglia) was used as reference; K: morphometric features (size, form factor, length) were computed for soma, proximal and distal processes.
This image analysis algorithm was also used to quantify stained area of oligodendrocytes (GST-π) and astrocytes (GFAP) stained coronal brain sections according to the above description. Luxol Fast Blue was analyzed by integrated optical density (IOD) parameter by ASTORIA.
HALO Image Analysis Platform (Indica Labs) was used to analyze myelin debris (dMBP), lysosomal marker (LAMP-1), neurofilament (SMI312) and homeostatic microglia marker (TMEM119).
Statistics
All data are presented as as means ± SEM. MRI data were analyzed using Anova with random effects (SYSTAT 13, SYSTAT Software, Inc.) to take the longitudinal character of the data into account. In vitro data was analyzed by mixed-effects analysis Sidak`s multiple comparison test or t-tests to compare two groups were performed as specified in the figure legends. To analyze histology data, either Holm-Sidak's one-way ANOVA tests with multiple test group effect per time point, Anova with random effects or t-tests to compare two groups were performed as specified in the figure legends. Statistical significance was assumed for p < 0.05.