Self-Assembly Mechanism
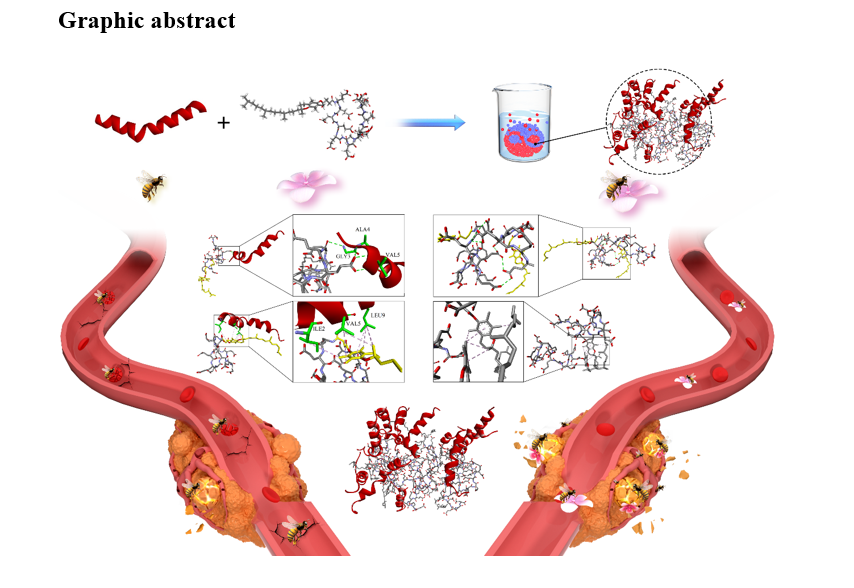
The structures of melittin and VG are shown in Fig. 1A. Molecular dynamics (MD) simulation snapshots depicting the time evolution between melittin and VG Initially, melittin and VG began to aggregate within 3 ns. Subsequently, the self-assembled nanoparticles became stable after 6 ns, as shown in Fig. 1B.
In the designed self-assembly system, the interaction was mainly composed of hydrogen bonds (Fig. 1C) and stacking effects (Fig. 1D). The van der Waals force in M/VG nanoparticles declined significantly with MD beginning, gradually stabilized after 6 ns, and stabilized in the range of − 2000 kJ/mol, indicating that the stacking effect (dominant by van der Waals force) in the designed self-assembly is gradually strengthened (Fig. 2A). Figure 2B shows the changes in the number of hydrogen bonds during the self-assembly process. In the first 6 ns, the intermolecular hydrogen bonds in the designed system were approximately 10. When simulated from 6 to 12 ns, the number of hydrogen bonds increased and stabilized at approximately 10–15. After 12 ns, the number of hydrogen bonds further increased and stabilized at 15–20. The electrostatic force energy (Fig. 2C) showed the same trend as the number of hydrogen bonds, since as the number of hydrogen bonds increased, the electrostatic force energy was gradually stable.
In the first 3 ns, the radius of gyration decreased significantly from about 2.8 nm to about 2.6 nm. After approximately 3 ns, the radius of gyration of the t-system gradually stabilized. The results show that the system was assembled successfully after 3 ns (Fig. 2D).
Figure 2E indicates that in the first 3 ns, the root-mean-square deviation (RMSD) of the clustering system was the largest at approximately 1.0 nm. From 3 ns to 8 ns, the RMSD between cluster systems decreased to approximately 0.7 nm. After 8 ns, the RMS deviation between clustering systems gradually tended to 0.4 nm. The above results confirmed that with the advancement of simulation time, the RMS deviation in clusters gradually decreased, resulting in self-assembly behavior and finally forming a stable nanoparticle structure. The relative results are consistent with the cluster behavior shown in Fig. 2F.
After forming a stable structure, the interactions between melittin and VG (Fig. 3A) were mainly based on hydrogen bonds and stacking interactions. GLY3, ALA4, and VAL5 in melittin interacted with the carbonyl or carboxyl of glutamate in VG via hydrogen bonding through NH-O interactions. LEU9 in melittin interacted with the benzene ring of vitamin E in VG by stacking interactions through CH-π interactions. ILE2 and VAL5 in melittin interacted with the benzene ring of vitamin E in VG by stacking interactions through CH-CH interactions. The interactions between VG and VG (Fig. 3B) were also mainly based on hydrogen bonds (OH-O and OH-N between glutamates) and stacking interactions (CH3-π and CH3-CH3 between vitamin E). The interactions between melittin and melittin (Fig. 3C) were also mainly based on hydrogen bonds (THR10 with PRO14 or SER18 by OH-O, LEU6 with SER18 by O-HO), and stacking interactions (LEU9-ILE17, PRO14-PRO14, and SER18-LEU6).
Characterization of M/VG nanoparticles
We optimized the mole ratio of melittin to VG in the self-assembly by zeta potentials, as shown in Fig. 4A. This was conducted because shielding the positive charges of melittin is key to decrease its hemolysis. With an increase in VG, the electric charge of melittin was reversed. To optimize the self-assembled nanoparticles of melittin and VG (mole ratio, 1:1), the potential of melittin (+ 19.6 mV) was transformed into − 26.8 mV, which was selected due to stable negative potential (Fig. 4B). The surface charge of M/VG nanoparticles was negative, which helped the self-assemble to escape from the recognition of the reticuloendothelial system and increased the retention time in vivo [22]. The hydrodynamic size of the M/VG nanoparticles was 63.4 nm as shown in Fig. 4C. As shown in Fig. 4D, the M/VG nanoparticles are spherical particles of approximately 30 nm. TEM revealed that the nanoparticles had smaller hydrodynamic size, which may be because TEM assesses solid particle sizes without a water layer, which is different from the hydrodynamic size. The average sizes of M/VG nanoparticles were smaller than the inter-endothelial gaps in most tumor vessels (380–780 nm), which is small enough to passively permeate into the tumor [23, 24].
CD spectrum characteristics
The CD spectra in Fig. 4E reveal that melittin has an α-helical configuration with negative peaks at approximately 209 and 220 nm. The results also demonstrated that VG converts the conformation of melittin because of the random coil of the M/VG nanoparticles. Previous reports have implied that melittin has an α-helical structure that easily binds to lipid membranes [25, 26]. Therefore, the change in the α-helical signal into a random coil suggests that M/VG nanoparticles might have low hemolysis.
Hemocompatibility of M/VG nanoparticles
As mentioned above, VG promoted the electric charge conversion of melittin by self-assembly (Fig. 4B). Shielding the positive charge of melittin is crucial for decreasing the interaction with RBCs. [11] Furthermore, after self-assembly into M/VG nanoparticles, the α-helical melittin changed into a random coil, probably yielding a decreased hemolytic effect of melittin (Fig. 4E). In vitro hemolytic evaluation indicated that melittin at a concentration of 20 µg/mL could lyse almost 50% RBCs, whereas at equal concentrations of melittin in M/VG nanoparticles, it only exhibited 12% hemolysis (Fig. 4F), further confirming that the fabricated self-assembly could remarkably increase the hemocompatibility of melittin.
MTT assay
The MTT assay was performed to evaluate the anti-tumor effect on HepG2 cells in vitro. The relative results indicated that the viability of melittin and M/VG nanoparticles-treated cells decreased significantly as the concentration of melittin increased (Fig. 5A). Meanwhile, the half-maximal inhibitory concentration (IC50) of M/VG nanoparticles was calculated as 2.13 µg/mL, a decrease of 55.16%, compared with that of melittin (4.75 µg/mL). This observation might be attributed to the different cellular uptake mechanisms of melittin and M/VG nanoparticles in HepG2 cells. Designed M/VG nanoparticles not only have good hemocompatibility but also have an effective therapeutic impact.
Wound healing assay
The effect of M/VG nanoparticles on HepG2 cell motility was evaluated using a scratch wound healing assay. As shown in Fig. 5B, HepG2 cells in the control group showed a significant motor aggregation phenotype. Both melittin and M/VG nanoparticles significantly inhibited cell motility. Compared with the melittin group, M/VG nanoparticles presented a lower healing rate, which decreased by 28.41%.
Apoptosis assay
HepG2 cells in the control group exhibited low apoptosis levels, as shown in Fig. 6A. Conversely, the M/VG nanoparticles significantly induced apoptosis in HepG2 cells and increased by 14.6%, compared with the melittin group (Fig. 6A).
Cellular uptake in vitro
As shown in Fig. 6B, within the first 1h, the cellular uptake of Cy5-labeled melittin and Cy5-labeled nanoparticles was low (Fig. 6B). As time increased, compared to Cy5-labeled melittin, HepG2 cells treated with Cy5-labeled nanoparticles displayed higher fluorescence signals at 4 h, indicating increased capture of Cy5-labeled nanoparticles (Fig. 6C). Furthermore, for quantitative analysis, the cellular uptake results in HepG2 cells demonstrated that Cy5-labeled nanoparticles could promote the uptake, which was 1.06 times higher than that of Cy5-labeled melittin (Fig. 6D).
In vivo imaging
To assess the tumor-targeting capability of Cy5-labeled nanoparticles, the biodistribution of Cy5-labeled melittin and Cy5-labeled nanoparticles, were both monitored. As shown in Fig. 7, Cy5-labeled melittin had insufficient tumor-targeting capacity and non-specific distribution. Conversely, Cy5-labeled nanoparticles first presented a fluorescence signal at 2 h in the tumor location after injection. As time elapsed, stronger fluorescent signals in the tumor region reached a plateau at 4 h. Notably, the Cy5-labeled nanoparticles were stably retained in the tumors and could still be detected after 24 h, validating a significant systemic long circulation and tumor-targeting capacity. Meanwhile, the ex vivo fluorescence imaging of tumor tissues and main organs as shown in Fig. 7 also indicated that Cy5-labeled nanoparticles could increase the accumulation of melittin in tumors, which is consistent with the in vivo imaging results. Furthermore, only lower deposition was detected in the liver, lung, and kidney. More importantly, Cy5-labeled nanoparticles showed a longer liver retention time, which may be a potential application for hepatocellular carcinoma. Notably, rapid clearance was found for the Cy5-labeled melittin, and fluorescence signals of the Cy5-labeled melittin group were less than those of the Cy5-labeled nanoparticles group, especially in the tissues after 24 h.
In vivo anti-tumor evaluation
Encouraged by the decreased hemolysis in vitro and increased tumor accumulation in vivo, an in vivo anti-tumor evaluation was performed. The limited tumor growth inhibition (39.86%) of melittin was observed, which could be attributed to the rapid clearance of the injections in the circulation system and lower affinity with the HepG2 cells. Compared to the melittin group, the self-assembled nanoparticles showed a longer retention time and specific tumor permeation (Fig. 7). As expected, the tumor growth curve and tumor images showed that M/VG nanoparticles dramatically suppressed tumor growth (Fig. 8A and 8B). At the end of the experiments, compared with the control group, mice treated with M/VG nanoparticles showed a 70.19% decrease in tumor volume for M/VG nanoparticles (2.5 mg/kg) and 92.96% inhibition for M/VG nanoparticles (5 mg/kg). In addition, even compared to the sorafenib group (positive control), the M/VG nanoparticles (5 mg/kg) group also showed a dramatic decrease in tumor size by 60.42%. When treated with melittin (2.5 mg/kg), hemolysis began from the bottom of the caudal vein, and melittin was gradually injected from the bottom to the top of the mouse tail. Therefore, the tails of the melittin (2.5 mg/kg) group showed severe tissue necrosis. Interestingly, the M/VG nanoparticle group exhibited no significant tail injury, even at a high dose of 5 mg/kg (Fig. 8C).
H&E and Ki67 staining of tumor tissues were chosen for histological evaluation (Fig. 8D). In the control group, tumor cells were large, polygonal, or almost round with obvious nucleoli and were easily observed. Fibrous tissues divided the tumor cells into small nests. For melittin and M/VG nanoparticles (2.5 mg/kg) groups, tumor cells were distributed diffusely without significant nest structure. Furthermore, when treated with M/VG nanoparticles (5 mg/kg) or sorafenib, tumor cells died significantly with no nuclear and dull cytoplasm eosin staining. Ki67 is a marker of tumor cell proliferation The proportion of Ki67 positive cells in the control group was significantly higher than that in the M/VG nanoparticles (5 mg/kg) group. The results showed that treatment with M/VG nanoparticles (5 mg/kg) induced malignant hepatoma proliferation (Fig. 8D).
Additionally, for histological evaluation, compared with the control, there were no significant histological changes in the major tissues in other treatment groups (Fig. 9). Meanwhile, melittin caused a significant decrease in hematocrit, demonstrating that melittin interacts with hemocytes in vivo; however, M/VG nanoparticles exhibited similar hemocyte levels as the control group. These results collectively indicate that M/VG nanoparticles can be used safely without causing evident hematotoxicity (Fig. 10).