Association of preoperative clinicopathological factors with the risk for LNM
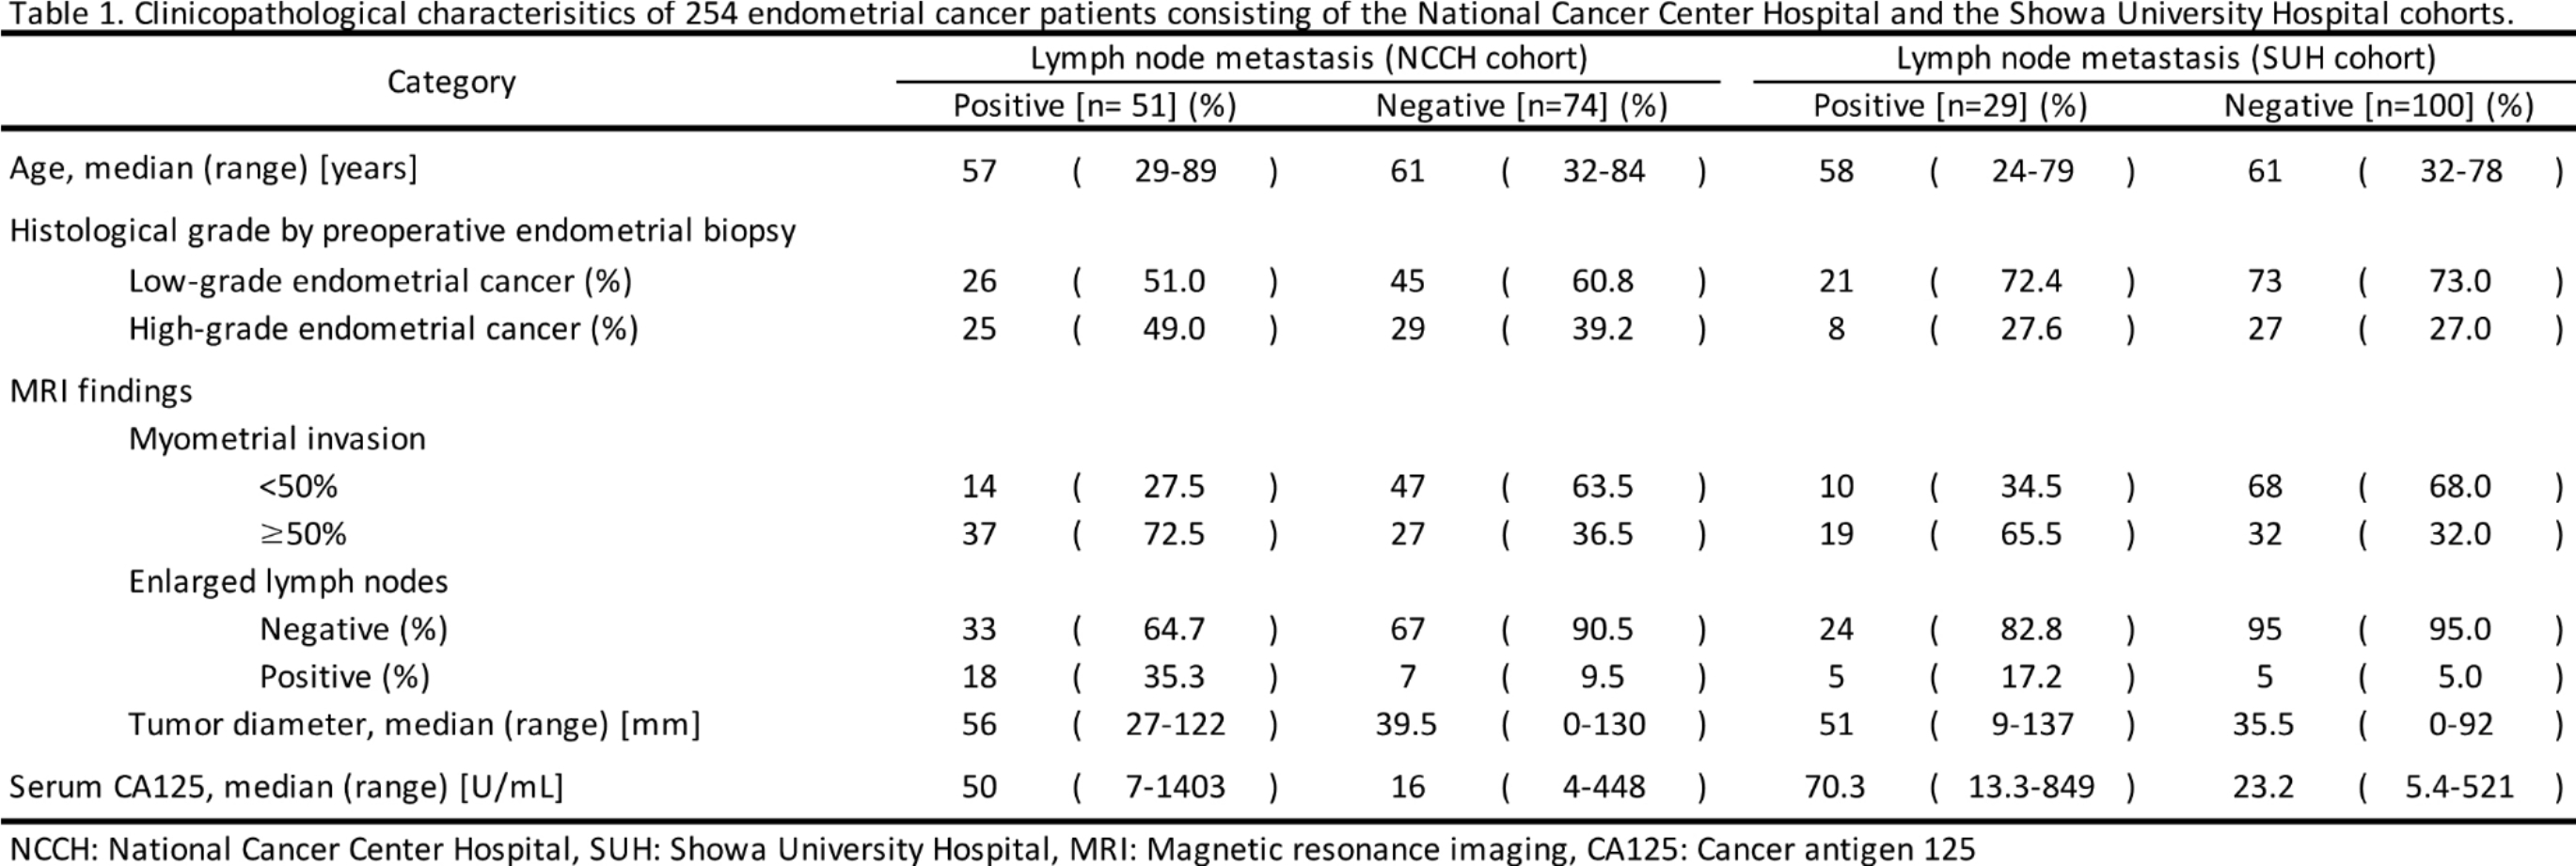
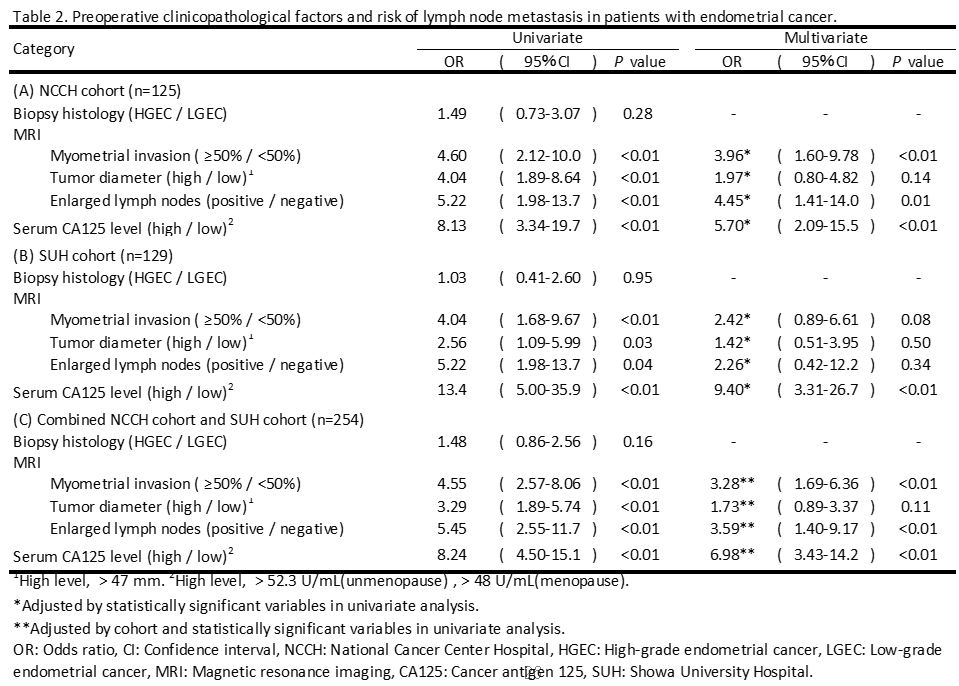
The clinical characteristics and pathological data of 254 patients are summarized in Table 1. Deep MI, enlarged LNs, and large TD (as determined by MRI), and high serum CA125 levels were significantly higher in patients with than without LNM (P < 0.01). In both cohorts, there was no difference in the distribution of biopsy histological subtypes and grades between patients with and without LNM (Table 2). Multivariate analysis revealed that deep MI, enlarged LNs, and high serum CA125 levels were associated with the risk of LNM in the NCCH cohort. Even in the SUH cohort, univariate analysis showed that deep MI, enlarged LNs, large TD, and high serum CA125 levels were higher in patients with than without LNM (P < 0.05), and there was no difference in the frequency of biopsy histological types between patients with and without LNM (Table 2 [B]). Multivariate analysis revealed that high serum CA125 levels were associated with the risk of LNM. In the combined analysis of 254 patients from the NCCH and SUH cohorts, deep MI, large, enlarged LNs, and high serum CA125 levels were independently associated with LNM in the multivariate analysis (Table 2 [C]).
Construction of predictive models for LNM detection using preoperative clinical factors
We investigated whether a predictive model for LNM could be constructed using the results of routine preoperative examinations, including MI, TD, LNs enlargement, biopsy histology, and serum CA125 levels. Predictive models were constructed for the NCCH training set (n = 75) using three methods: (A) LR, supervised machine learning with (B) SVM, and (C) RF. Models were validated on the test sets of the NCCH (n = 50) and SUH (n = 129) cohorts. The area under the ROC curve (AUC) was calculated to evaluate the predictive power of each model. Nearly all methods showed a high predictive performance above AUC 0.80, which was similar to the results of validation by other cohorts, including the SUH and NCCH test sets (Fig. 1).
Summary of the previous reported predictive performance
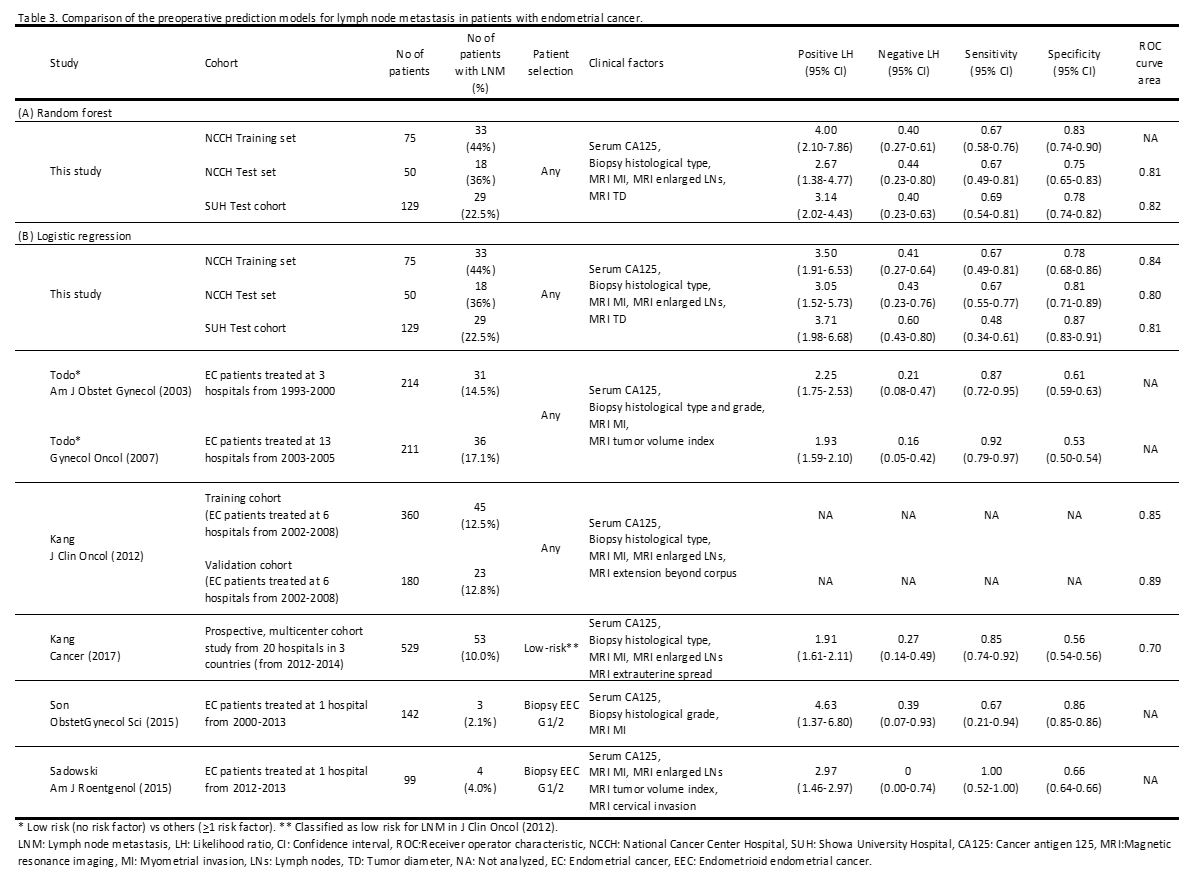
To evaluate the predictive performance of LNM in the present study, we compared it with the previously reported LNM prediction algorithm using preoperative clinical factors. In this study, both the RF and LR using clinical factors showed that our model had slightly lower sensitivity and higher specificity than previously reported models, although the positive likelihood ratio was higher than previously reported (Table 3).
Association of the preoperative clinical factors with the risk for LNM between LGEC and HGEC determined by biopsy specimens
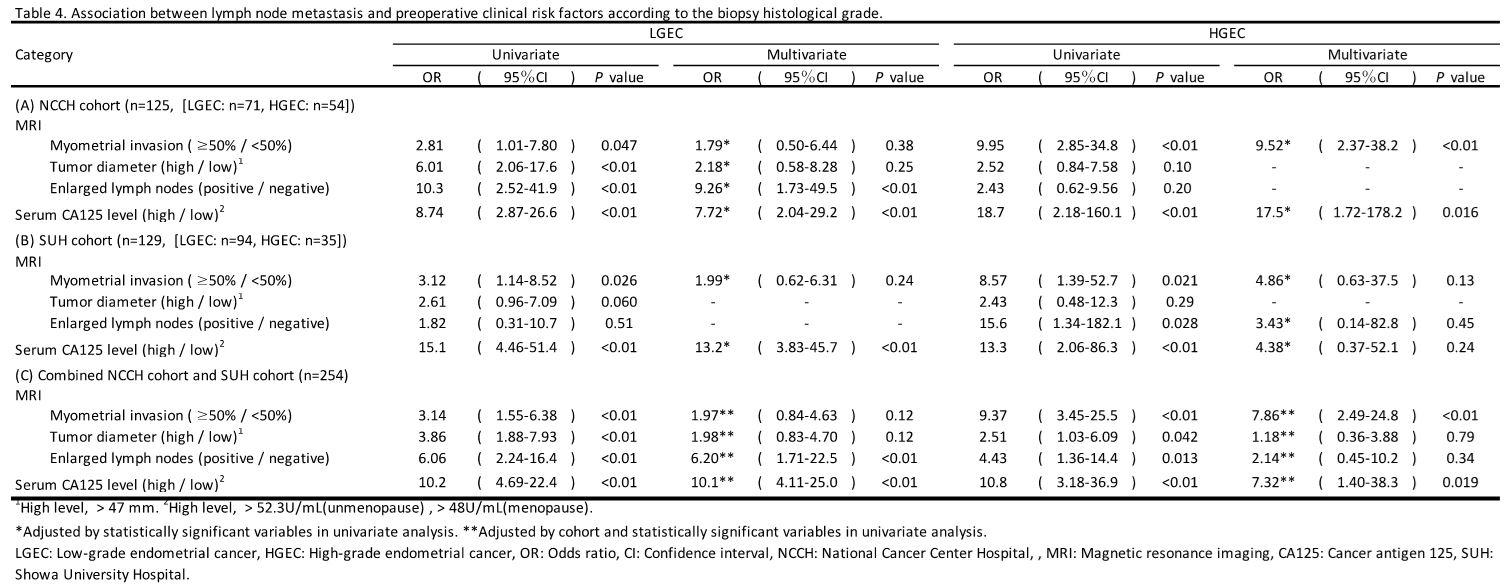
In patients with LGEC in the NCCH cohort, multivariate analysis revealed that high serum CA125 levels and enlarged LNs were significantly associated with a risk for LNM (odds ratio [OR] = 7.72, P < 0.01, and OR = 9.26, P < 0.01, respectively; Table 4 [A]). Multivariate analysis of the SUH cohort showed that high serum CA125 levels were significantly associated with LNM (OR = 13.2, P < 0.01; Table 4 [B]). In the combined analysis consisting of 254 patients from the SUH and NCCH cohorts, we identified high serum CA125 levels and enlarged LNs in the LGEC group (OR = 10.1, P < 0.01, and OR = 6.20, P < 0.01, respectively; Table 4 [C]). Conversely, multivariate analysis revealed that deep MI and high serum CA125 levels in HGEC of the NCCH cohort were significantly associated with risk of LNM (OR = 9.52, P < 0.01, and OR = 17.5, P = 0.016, respectively). However, none of the factors were statistically associated with risk of LNM in the SUH cohort (Table 4 [A] and [B]). In the combined analysis of 254 patients from the SUH and NCCH cohorts, deep MI on MRI and high serum CA125 levels were associated with risk of LNM in the HGEC group (OR = 7.86, P < 0.01, and OR = 7.32, P = 0.019, respectively; Table 4 (C).
Since the strength of factors contributing to LNM differs between LGEC and HGEC, we decided to separate LGEC and HGEC patients and create LNM prediction models for each. In the LGEC group, the three machine learning methods showed a relatively high predictive ability, with an AUC of approximately 0.75 for the (A) LR: AUC 0.75, (B) SVM: AUC 0.79, (C) RF: AUC 0.76; Fig. 2) models. The HGEC group showed an even higher predictive performance: (A) LR: AUC 0.84, (B) SVM: AUC 0.77, and (C) RF: AUC 0.86.
Correlation between the predictive classification of LNM and the clinical outcomes
We examined the association between the LNM predicted by the LR method in this study and the clinical outcomes of 125 patients in the NCCH cohort and 129 patients in the SUH cohort predicted in this study. Patients with positive LNM prediction had better RFS and OS than patients with negative LNM prediction (Supplementary Fig. S1). After adjusting for the presence of adjuvant therapy (chemotherapy or radiation therapy), RFS and OS in the positive LNM prediction group were significantly worse than those in the negative LNM prediction group (Supplementary Table S4). In the group without pathological LNM, the RFS of the groups with positive LNM prediction was worse than that of the groups with negative LNM prediction (Fig. 3). On the other hand, in the group with pathological LNM, there was no significant difference in RFS between the positive and negative LNM prediction groups (Supplementary Fig. S2).