3.1 Viral genotypic compositions, evolutionary and expansion dynamics in the early phase of COVID-19
3.1.1 A super-dominant genotype of SARS-CoV-2 was characterized with two concurrent mutations
By the first cutoff date (7 April 2020), we identified two most abundant substitutions, C/T at location 8782 base (orf1ab: C8517T, synonymous) and T/C at location 28144 base (ORF8: T251C, L84S) from 4013 viral genomes. The T8782 and C28144 genotypes were found to co-exist in 767 (19.1%) genomes, whereas the remaining 3,246 genomes (80.9%) were consistent with the first sequenced SARS-CoV-2 genome, Wuhan‐Hu‐1 (MN908947.3) at those two sites [2]. This finding was consistent with a previous study [13].
Next, to address the question of whether those two sites are evolutionarily conserved, we generated a phylogenetic tree of the seven patient samples linked with the Huanan Seafood Wholesale Market (hereinafter named as the Market) and the related coronaviruses from animal reservoirs by nucleotide sequence alignment [14]. Interestingly, we found the most related coronaviruses from pangolins and bats showed consensus at the orthologous sites of 8782 base as T and 28144 base as C. A complete linkage at both sites was also observed in these highly related coronaviruses including the most closely related bat coronavirus RaTG13 (96.2% identical) (Fig. 1a). This result suggests that the T8782 and C28144 genotype existing in 19.1% of SARS-CoV-2 genomes is more conserved during evolution as an ancestral genotype. On the opposite, the samples from the seven patients demonstrate identical concurrent mutations on those two sites (T8782C and C28144T). Coincidentally, all seven patients had worked or visited the Market before the onset of illness. Also worth mentioning is that the patient of sample Wuhan/WH04/2020 did not visit the market but stayed in a hotel nearby between 23 and 27 December, 2019 [2,7]. Different from the aforementioned seven Market samples, the genotype of this patient sample showed no mutations on the two sites (i.e. T8782 and C28144), suggesting this patient had been infected from somewhere else in Wuhan instead of the Market. Noteworthily, the first sequenced SARS-CoV-2 genome, Wuhan‐Hu‐1 which was from a worker at the Market, also acquired the two point mutations [2].
Given limited sampling of viruses from the Market, we acknowledge that samples with concurrent T8782 and C28144 genotype from the Market might have been underrepresented. However, we are confident that a significant portion of samples from the Market were derived from an ancestral genotype, generating a distinctive genotype defined by two concurrent mutations, which we named as M type (T8782C/C28144T) hereinafter. It represented an overwhelming majority of all COVID-19 samples since the initial phase of the global pandemic (Fig. 1b). All the 16 samples collected prior to 01 January, 2020 have the M type mutations that coincides with the fact that market contact history was one of the diagnostic criteria of COVID-19 at the period of time (Table S1) [9]. The M type was the most dominant genotype, accounting for 80.9% of 4,013 SARS-CoV-2 global genomes by early April. Based on the phylogenetic analysis, viral genotypes and epidemiological data of early cases sampled in Wuhan, we speculated that the Market was not the origin where the pandemic initially started, but was an incubator of the M type at the early outbreak of the pandemic. It also echoes with a few previous studies that doubted the market was the origin, or the only origin, of COVID-19 outbreak [13].
3.1.2 The mutation spectrum and dynamics of SARS-CoV-2 genome
First, we estimated the impact of sequencing errors on mutation calling in this study.
As described in detail in Methods, sequencing errors were very unlikely to confound the mutation analyses of 4,013 genomes. A total of 2,954 unique nucleotide substitutions were identified from the 4,013 SARS-CoV-2 genomes (Table S1) with relatively even distribution across the viral genome (Table S1). On average, there are 7.4±3.4 (mean±SD) mutations per genome. Only 31 genomes had no mutation (i.e. ancestral type), while 952 (32.2%) mutations were recurrent in more than one sample. There were 17 mutations that occurred in more than 10% samples (Fig. 2a, Table S1).
Interestingly, we found that mutations increased in individual samples during the course of evolution by plotting the number of mutations per sample with the time of sample emergence (Fig. 2b). Samples with more mutations were collected at a relatively later stage. A simple linear regression of the root-to-tip genetic distances against the sampling dates was performed to estimate the evolutionary rate of SARS-CoV-2 using the TempEst (v1.5.3) software. The evolutionary rate was estimated to be 27.1 subs per year, which was very similar to the evolutionary rate (26.7 subs per year) estimated by Nextstrain.org from 4616 viral genomes sampled between December 2019 and April 2020 (https://nextstrain.org/ncov/global?l=clock).
Like M type T8782C/C28144T mutations, concurrent mutations were also observed from the rest 15 most common single nucleotide mutations. A symmetric matrix plot by clustering analysis was generated from the 17 most abundant mutations to highlight the most common concurrent mutations (Fig. 2c). T8782C/C28144T were concurrent in 81% samples, followed by C14408T/A23403G/C3037T/C241T (51%), G28881A/G28882A/G28883C (16%), C1059T/G25563T (12%), C17747T/A17858G/C18060T (12%) and G11083T/C14805T/G26144T (8%). G28881A/ G28882A/ G28883C and C1059T/G25563T were intersecting with C14408T/C241T/C3037T/A23403G since both were subsequent mutations of C14408T/C241T/C3037T/A23403G (Fig. 2d). Likewise, C14408T/C241T/C3037T/A23403G and G11083T/C14805T/G26144T were intersecting with T8782C/C28144T since both were subsequent mutations of T8782C/C28144T. C17747T/A17858G/C18060T didn’t intersect with any other concurrent mutations since it was a genotype derived directly from ancestral type and independent to T8782C/C28144T (M type).
3.1.3 The super spreading genotypes
952 mutations (32.2%) spread at least once as they were detected in more than one patient samples, and distinct genotypes can be characterized based on the prevalence of mutations (Table S1) in order to identify “super spreaders” with particular genotypes, who to a great extent determined the scale and trend of the ongoing pandemic. Super spreader genotype was methodically defined as the basal outbreak variant possessing certain common mutations, which caused the outbreak with a single introduction and subsequently transmission and evolution.
The biggest super spreader genotype was the variant carrying M type (T8782C/C28144T) mutations which was spread into 3,246 patients, counting for 80.9% of the cases in the study (Fig. 1b). It may worth pondering whether this “founder effect” was attributed to a single super spreader or a multitude of coincidentally identical super spreaders. Based on an evolutionary rate of 26.7 subs per year estimated from genomes sampled between December 2019 and April 2020 on Nextstrain (https://nextstrain.org/ncov/global?l=clock), our estimation (detailed in Methods) indicated that the chance to have a multitude of identical mutations by coincidence or sequencing error was next to none. Therefore, it is plausible to assume that the COVID-19 patient clusters from the Market during the early outbreak were very likely to be the descendants from literally one single ancestor, who might have been a vendor or a regular customer and probably spread the virus at the Market late November or early December according to the limited epidemiologic data.
In contrast, only 41 patients (1.0%) had unique genotypes that were not overlapping with any other mutations identified in the 4,013 viral genomes (i.e. singletons) (Table S1). These patients had not spread their viruses based on the sampled viral genomes in this study.
3.1.4 Mutation-based unsupervised clustering indicates temporal and spatial transmission and expansion trajectory of SARS-CoV-2
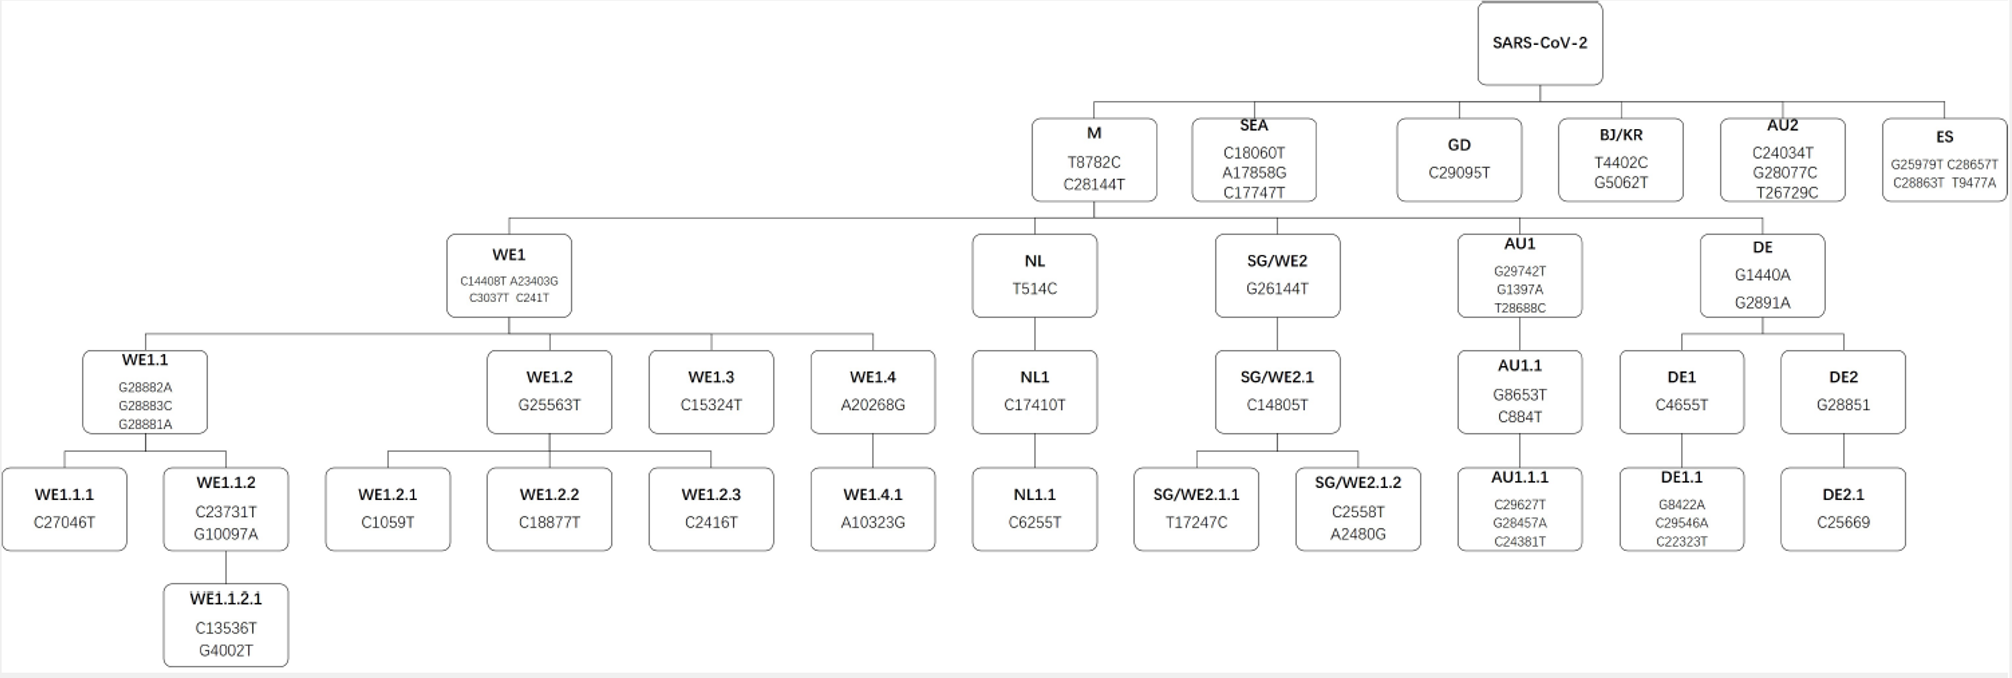
In order to trace the temporospatial transmission and regional expansion of COVID-19 pandemic, we conducted mutation-based unsupervised clustering of all the samples. As shown in Fig. 3a, the 4,013 samples were largely grouped by their mutation profiles. Based on the clustering result, a pedigree chart of five-level hierarchy was manually curated and illustrated to show how the most dominant descendent genotypes were derived from the ancestral genome of SARS-CoV-2 at the Level-0 of the hierarchy (Fig. 3b, Fig. S1). Six descendant genotypes, namely M type (concurrent T8782C/C28144T) starting from the Market, SEA type (concurrent C17747T/A17858G/C18060T) initially reported solely from the Greater Seattle area in USA, ES type (concurrent T9477A/G25979T/C28657T/C28863T) with more than 60% of cases reported from Spain, AU2 type (concurrent C24034T/T26729C/G28077C) with 22 out of 41 cases reported from Australia, GD type (C29095T) initially found in Guangdong Province, and BJ/KR type (12 cases with concurrent T4402C/G5062T mutations) reported from both Beijing and South Korea, were directly derived from the ancestral genome by acquiring corresponding mutations, and thus represented Level-1 of the hierarchy.
3.1.4.1 More than 80% of cases worldwide were derived from M type.
The M type accounted for 80.9% of all global cases in the study. Although initially identified from the Market in Wuhan, China, it was subsequently reported in Western Europe, USA, and Australia with corresponding novel mutation signatures apart from T8782C/C28144T. Five descendant genotypes were further derived from M type, consisting of Level-2.
In particular, the most prevalent descendant genotype of M, WE1 type (named as Western European 1), represented a total of 2,016 cases, a half of all the cases (50.2%) in the study. Over 70% of WE1 cases were reported from Western European countries, with the United Kingdom (19.2%), Iceland (11.8%), Belgium (9.7%), France (8.5%), and Netherlands (5.0%) being the most severely stricken countries by WE1. The WE1 type was featured by four concurrent mutations (C241T/C3037T/C14408T/A23403G). Given geographic proximity among those countries, cross-border virus traffic might have occurred, leading to widespread transmission of SARS-CoV-2 in Western Europe. WE1 also represented 34.8% of the cases in the United States. Interestingly, among 4,013 samples, we found three early samples carrying three out of the four mutations of WE1 (C241T/C3037T/A23403G), with two (one from Germany and one from Shanghai) sampled on 28 Jan 2020 and one from Shanghai sampled on 31 Jan 2020. The one from Germany belonged to the first COVID-19 cluster reported from Bavaria, Germany, which was associated with a primary case with previous travel history from Wuhan [15].
SG/WE2 type was characterized by a single common mutation (G26144T). This type was first reported from Singapore and several Western European countries (UK, France, Switzerland and Netherlands) as of 17 March 2020. Over half of the SG/WE2 cases in this study were reported from UK (38.8%) and Australia (13.7%), followed by 9.6% from Iceland, 8.7% from Hong Kong and 4.7% from USA. The chronological difference of the early cases implied a Singapore to Western European case importation. Based on the new cases from Oceania, case importation from Singapore to Australia can also be inferred since Singapore is an important transit point for many international flights.
The third representative Level-2 genotype was DE type with two concurrent mutations (G1440A/G2891A). All early cases of the DE type were found in Germany, however, the majority (62.6%) of DE cases were reported from UK. In particular, 60 out of 67 DE cases in UK further developed a unique mutation (G28851T) defined as DE2 in Level-3, and 34 DE2 cases acquired another mutation (C25669T) on top of DE2, resulting in 4 concurrent mutations defined as DE2.1 in Level-4. So cross-border traffic of DE type from Germany to UK can be inferred.
The last two genotypes derived from M type at Level-2 were NL and AU1 type. NL type was mainly reported from Netherlands and featured with a single extra mutation, T514C. AU1 type was mainly found in Australia with three extra concurrent mutations (G1397A/T28688C/G29742T).
3.1.4.2 SEA type, the most dominant type in USA penetrated other three countries with various geographic distances.
The SEA type was initially related to 41 cases in the Greater Seattle area and 7 cases on Grand Diamond cruise ship as of 17 March 2020. It was also seen from 41 cases in Australia, 26 cases in Canada and 11 case in Iceland in the cases reported later (as of 7 April 2020), apart from a total of 393 cases in USA, indicating case importation had occurred from USA to the other three countries before travel restrictions were implemented in those countries. Interestingly, this finding coincided with a recently study in which SEA type was referred to as the “Washington State outbreak clade”, since the majority (n=384, 84%) of the viruses sampled from the Washington State outbreak from 19 January to 15 March 2020 fall into this clade [16].
3.1.4.3 In contrast to M and SEA, four other genotypes in Level-1 were mostly circulated regionally among relatively small populations.
ES type featured by concurrent T9477A/G25979T/C28657T/C28863T mutations, was mainly reported from Spain, with 20 out of 52 cases scattered among other countries. Likewise, 22 of 41 cases of AU2 type (concurrent C24034T/T26729C/G28077C) was reported from Australia. GD type was mainly reported from Guangdong Province, and the BJ/KR type was related to 4 patients in Beijing and 8 patients in South Korea. Similar to WE1, other genotypes at Level-2 developed descendant genotypes in Level-3 and Level-4 by accumulating more additional mutations from the corresponding Level-2 genotype (Fig. S1).
Fig. 3c illustrated the temporal expansion of the 11 major genotypes defined above. M type (WE1, SG/WE2, DE, AU1, NL and the rest of M type) remained as the overwhelmingly dominant genotype from the very beginning of the outbreak to early April. WE1 was spread to more than half of the total cases as of 7 April, becoming the most prevailing M-derived genotype in the globe. Next to WE1 type, SG/WE2 type was spread to 11.1% of global population. The major non-M type, SEA type, initially reported from the Greater Seattle area, was spread to 11.8% of global population.
As shown in Fig. 3d, six Level-1 genotypes (M, SEA, ES, AU2, GD and BJ/KR) derived directly from ancestral type were mutually exclusive, and five Level-2 genotypes derived from M type (WE1, SG/WE2, DE, AU1 and NL) were mutually exclusive as well. It implies mutations occurred randomly and independently in the genome of SARS-CoV-2 and the various genotypes carrying specific mutations were propagated during human-to-human transmission, not by accumulating hot-spot mutations during the replication of individual viral genomes. This also reflects the high quality of sequencing data applied in the study after filtering out low quality sequence data and the randomness of the mutations as well.
3.1.5 Major genotypes of SARS-CoV-2 in different countries indicated genotypic-epidemiologic relevance
Fig. 4a lays out the genotypic compositions of SARS-CoV-2 in ten representative countries and geographic locations (Wuhan City, China, USA, UK, Netherlands, Australia, Spain, Germany and two cruise ships) in this study. An in-depth mutation profiling of the cases from four areas of interest were also conducted to provide genotypic-epidemiologic connections within different countries and regions, which may help to restore a more complete picture of the unfolding pandemic (Fig. 4b-4c).
3.1.5.1 China, as the first severely stricken country, reflected a “spill-over” effect of Wuhan viral genotypes.
The epicenter of COVID-19, Wuhan, was where the M type had originated. The M type samples accounted for 86% of all cases reported from the city. Population mobility from Wuhan to other parts of China during Spring Festival travel rush before Wuhan was locked down on 23 January 2020 might have caused nationwide prevalence (i.e. spill-over) of M type in China, which was subsequently diluted by regional expansion of other genotypes to a lower percentage of 57%.
Early cases reported from Wuhan was extremely critical to answer how the outbreak took place at the very beginning. In this study, we were able to collate 34 viral genomes sampled from Wuhan between December 24, 2019 to January 18, 2020, although the number of confirmed case by then were 121 according to Chinese officials (Fig. 4b). There were two distinct clusters of the 34 early samples. 30 out of 34 viral genomes were categorized into the M type (T8782C/C28144T) with a great extent of genetic diversity. Among these 30 genomes, 17 acquired extra mutations apart from two M type mutations resulting in 14 different genotypes. All of the 11 viral genomes linked with the Market (including 8 samples of patients who worked at the Market and 3 positive environmental samples collected from the Market) were in this cluster [7]. Although the M type was the dominant type during the early outbreak of COVID-19 in Wuhan, the non-Market genotypes from four patients forms the second cluster that also co-existed with M type cluster at that time. Two of them were ancestral type and the other two had their own unique mutations. Wuhan/WH04/2020 was a patient who had no direct Market exposure in the second cluster [7]. Taken together, these findings imply that the genetic pool of SARS-CoV-2 was already very diversified during the early outbreak in Wuhan as there were 18 different genotypes in total among the 34 early samples from Wuhan. The super-dominant Market lineage might have been initially transmitted to the market by a primary patient case infected with the M type virus. M type virus was rapidly propagated within the Market which had served as a big incubator of the outbreak considering its huge size (~50,000 square meters and ~1000 booths). This notion is also evidenced by the three positive environmental samples (Wuhan/IVDC-HB-envF13/2020, Wuhan/IVDC-HB-envF13-20/2020, and Wuhan/IVDC-HB-envF13-21/2020) collected from the booths and garbage truck of the Market in 1 January 2020 by China CDC. The viral genotypes of three environmental samples were also M type. In fact, 33 out of 585 environmental samples from the Market were tested positive for SARS-CoV-2 according to an investigation conducted by China CDC in January 2020.
3.1.5.2 Genetic dynamics of the cases in the United States might be attributed to early imported cases from Hubei.
In general, on the contrary to the global dominance of M type, the non-M types were much more prevailing in USA than the M type (42 vs 19) as of 17 March 2020 (Fig. 4c). It is noticeable that the earliest cases reported from USA (samples collected between January 19 to February 11, 2020) were the patients who had been to Hubei Province before the illness onset (five in M type and seven in non-M types) and all cases were scattered around in different states of USA (sample names were indicated as blue at the bottom annotation in Fig. 4c. Moreover, each of the 12 imported cases from Hubei had a distinct genotype, suggesting early imported cases in US already possessed great genetic diversity.
All the cases with no Hubei travel history in the M type cluster (14 cases) were mainly from California (8 cases), Washington (4 cases) and New York (2 cases). Four samples had one additional C9924T mutation and three samples had three concurrent mutations (C3037T/C14408T/A23403G). All of the 42 patients with the SEA type (three concurrent mutations C17747T/A17858G/C18060T) in non-M clusters were from the Greater Seattle area. The first case of COVID-19 in the United States (USA/WA1/2020) had only C18060T mutation but not the C17747T/A17858G mutations of SEA type. This patient returned to the Greater Seattle area on 15 January, 2020 after traveling to visit family in Wuhan [17].
Thus 50.1% of cases in USA were SEA type originated from Seattle and 34.8% were WE1, the most dominant genotype in Western Europe, which was also the most dominant genotype in New York City (89.7%). Taken together, it indicates that USA endured the first wave of case importation from China and the second wave from Europe, which is consistent with the recent COVID-19 study of Washington State [16].
3.1.5.3 The genotypes from two cruise ships were very distinct
As shown in Fig. 4a and Fig. 4d, all the 25 Diamond Princess cruise ship cases harbored the two M type mutations (T8782C/C28144T). While eight of them had no extra mutations, the other 17 cases harbored additional mutations but none of them were identical (Fig. 4d).
All seven Grand Princess cruise ship cases possessed the SEA genotype (three concurrent mutations C17747T/A17858G/C18060T) and presented at least two extra mutations, while three cases carried three extra common mutations (A3046G/A16467G/C23185T) (Fig. 4d). Thus, the seed patient of Grand Princess might have been from the Greater Seattle area based on the overlapping mutations with the SEA genotype.
There were 25 different viral genotypes in total among the 32 cruise ship patients. Although both Diamond Princess and Grand Princess provided an occlusive environment for COVID-19 outbreak in a short time window, the heterogeneity of viral genetic pool of both cruise ships implies that SARS-CoV-2 maintained a noticeable mutation rate during person-to-person transmission.
3.1.5.4 The cross-border virus traffic was evident among Western European countries
Patients in three Western European countries, UK, Netherlands and Germany were overwhelmingly dominated by the M type (99.4% vs 96.6% vs 97.4%) (Fig. 4a). While WE1 was the most common genotype derived from the M type in all countries (53.5 vs 56.2% vs 52.6%), and each country had distinct the second most common genotypes: SG/WE2 (23.9%) in UK, NL (25.3%) in Netherlands and DE (31.6%) in Germany. In contrast to Netherlands and Germany, the M type only accounted for 44.3% of viral genotypic composition in Spain. A novel non-M type, ES, showed comparable prevalence to M type (40.5%) were mostly reported from Spain (Fig. 4a).
While cross-border virus traffic had likely occurred among three countries that contributing to widespread of WE1 type in the early outbreak across Europe, the existence of country-specific genotypes suggested control measures after the early outbreak were to some degrees effective in those countries.
3.1.5.5 Australia endured multiple waves of imported cases
The first viral genome in Australia (sampled on 22 Jan 2020) harbored two concurrent T8782C/C28144T mutations (i.e. M type). So a first wave of M type importation from China to Australia can be speculated (Fig. 3b). A subtype derived from M type, AU1, was mostly restricted to the patients reported from Australia at the early phase of the outbreak. As of early April, 78.5% of cases in Australia were still M type, but AU1 (6.7%) was no longer the largest subtype. Instead, WE1 (42.7%) and SG/WE2 (16.0%) were the most abundant subtypes (Fig. 4a), suggesting a second wave of importation from Western Europe. In addition, a noticeable emergence of SEA type (10.7%) inferred a third importation wave from USA. The ebbing tide of AU1 coincides with the China travel ban issued by Australian government on 1 February 2020, indicating the travel restriction from China might have been efficacious.
3.1.6 Genotype matching and strain of origin
By taking into account all of the well-defined 11 major genotypes in our study, we developed an algorithm, Strain of Origin (SOO), to match a particular SARS-CoV-2 viral genome to the known genotypes based on its mutation profile. The concordance of SOO was estimated in comparison with mutation clustering by assigning each of 4,013 samples included in the study to the corresponding genotype (Fig. 5). The overall concordance of genotypes assigned by SOO with those assigned by mutation clustering was 89.8%. Within Level-1 genotypes, the concordance ranged from 84.9% to 100.0% with an overall concordance of 86.5%. All the Level-2 genotypes represented major subtypes of M type and the overall concordance with clustering results at this level was 90.5%. The most abundant genotype at Level-2, WE1 showed 93.4% concordance. Thus, SOO represents a more accurate approach to define genotypes as it only takes into consideration the specific mutations of the particular genotypes with little influence from the rest random mutations.
3.1.7 Comparison of SOO classification and GISAID phylogenetic clades
There were seven phylogenetic clades of 5139 virus genomes sampled between December 2019 and September 2020 in GISAID global analysis (https://www.gisaid.org/epiflu-applications/hcov-19-genomic-epidemiology/) (Table S2). Since genomes were equally subsampled from each admin division per month, it should be acknowledged that countries with massive viral genome submissions were underrepresented. Thus conclusions regarding the global vision of the pandemic based on the GISAID global analysis should be drawn with caution.
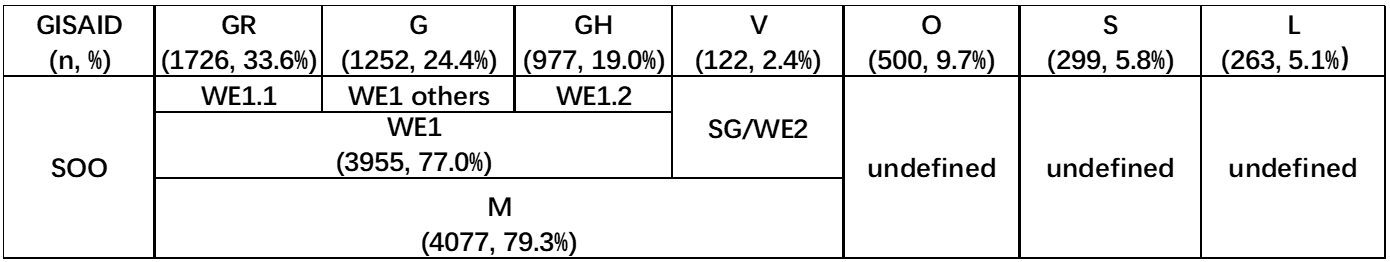
Four clades (n=4077, 79.3%) from GISAID were well defined by the SOO classification (Table S3). The three most prevalent clades GR (n=1726, 33.6%), G (n=1252, 24.4%) and GH (n=977, 19.0%) were descendent from WE1 (n=3955, 77.0%), with GR referred to WE1.1, GH referred to WE1.2, and G referred to WE1 others by SOO classification. Moreover, V (n=122, 2.4%) was referred to SG/WE2 by SOO. Two other clades can not be directly referred to any SOO genotypes although L can be vaguely inferred as ancestral type and others, S be inferred as a mixture of non-M types including SEA, ES, AU2, and GD. On the other hand, the O (n=500, 9.7%) clade can not be equivocally inferred as any SOO genotypes. It is plausible since it was not presented as a unique branch as other clades but scattered all over other branches of the phylogeny, implying it was not a well-defined unique clade.
3.2 The mutation spectrum of the subsequent global expansion of COVID-19 pandemic
We analyzed all the available SARS-CoV-2 viral genomes in GISAID database as of 25 December 2020, the second cutoff date of the study. A total of 10,392 unique nucleotide substitutions were identified from the 261,323 SARS-CoV-2 genomes (Table S4), which indicates roughly one out of three nucleotides in the viral genomes has mutated during the 12-month timespan of the viral evolution. A pedigree chart of the 100 most abundant mutations was generated to highlight the lineages of the most common concurrent mutations during the 12-month time window of the unfolding pandemic (Fig. 6, Table S5). A very tiny proportion (92 genomes, less than 0.04%) of viral genomes were ancestral type. 59 (64.1%) of them were reported from China between January and March 2020, among which seven were sampled from Wuhan in January 2020 (Table S6). Despite of the overwhelming dominance of M type (95.3%), other major genotypes at Level-1 hierarchy in the early phase gradually faded out as the pandemic unfolds (Fig. 3B, Fig. 6, Table S5). For example, SEA type was one of the most common viral genotypes in early April, accounting for 11.8% of the total samples. However, the percentage of SEA type drastically dropped to only 1.0% by the end of December (Fig. 6, Table S5). Moreover, the proportion of other non-M mutations (ES, AU2, GD and BJ/KR) at Level-1 were too small to be listed within the 100 most common mutations (Fig. 6). Similarly, WE1 (88.6%) was still the major subtype of M (accounting for 93.0% of M) while other subtypes (SG/WE2, DE, AU1, and NL) at Level-2 gradually faded out. But still, four subtypes of WE1, namely WE1.1 (34.3%), WE1.2 19.3%), WE1.3 (22.2%) and WE1.4 (6.1%) were reasonably represented. On the other hand, a subtype of WE1, named WE1.5 (19.9%) featured with additional seven concurrent mutations (T445C/C6286T/G21255C/C22227T/C26801G/C28932T/G29645T) had not emerged by early April but came to the surface during the subsequent expansion. Interestingly, one-time concurrence of more than four mutations like WE1.5 was seldomly represented in the early viral samples, but was more frequently observed in the later phase (Fig. 6).
Noteworthily, in December 2020, the authorities of the UK and South Africa reported to WHO two variant strains of SARS-CoV-2 as Variant of Concern (VOC) respectively. Both strains were featured with a novel amino acid change (N501Y) caused by A23063T. In this study, a total of 4130 viral genomes harbored N501Y by 25 December 2020. Interestingly, they were generally categorized into two strains, with 3931 genomes as a subtype of WE1.1, and 188 genomes as a subtype of WE1.2 under SOO algorithm (Fig. 7a), with the former mainly reported from the UK (98.5%) and the latter mostly reported from South Africa (96.3%). It was coherent with a recent report from WHO that the UK variant N501Y V1 (i.e. B117) was a different virus variant from the one from South Africa N501Y V2 (i.e. B1351) by phylogenetic analysis [18]. The first genome of V1 in GISAID was from Victoria, Australia on 3 June 2020. A total of 31 V1 genomes were identified in June 2020, 30 of which were from Australia. This gave rise to the first wave of V1 in June. It followed by a huge spike beginning in November which was attributed to the wide spread of V1 in the UK at that time (Fig. 7b). The first genome of V2 was from New York City, USA on 21 April 2020, and V2 was later widely spread in South Africa as evidenced by a wave of V2 in November (Fig. 7b).
3.3 Lineage analysis of SARS-CoV-2 virus in the early phase sheds light on subsequent expansion of COVID-19 pandemic
In order to virtualize the pandemic expansion patterns in the world over the last twelve months, we analyzed time-series genotypic compositions of SARS-CoV-2 at critical time points to piece the puzzle together (Fig. 8, Table S2-S3). First, to better visualize the whole story, a putative ‘patient zero’ harboring an ancestral viral genotype was added to build the first time point as 17 November 2019, on which date the earliest patient ever documented can be traced back to [19]. A total of 19 viral genomes were sampled by 1 January 2020, all of which were M type. As discussed before, M type cases had been populating at the Market for several weeks before it was shut down on 1 January 2020, resulting in an absolute overrepresentation of M type samples by this date. As the virus kept unfolding in Wuhan, the city was lock down on 23 January 2020. 80 of 104 (76.9%) viral samples by then were M type. Population mobility from Wuhan before its lockdown (e.g.: Spring Festival travel rush) caused the subsequent national-wide epidemic in China and ultimately the global pandemic. By 7 April 2020, over 80% of global cases were still M type. Noteworthily, a descendant genotype from M, WE1 type accounted for over a half of global cases. It firstly swept Western Europe in mid-February and later USA in late February, and became the most prevailing type worldwide. By 25 December 2020, 95.3% of global cases were M type and 93.0% of M-type cases were WE1. The current overwhelming dominance of M (particularly one subtype WE1), and its continuous expansion over the last 12 months were well captured and characterized throughout the study.
Thus, the M type expansion pattern well represented the pandemic expansion pattern: patient zero (17 November 2019, unknown%) à Market (1 January 2020, 100%) à Wuhan (23 January 2020, 76.9%) à World (7 April 2020, 80.9%; 25 December 2020, 95.3%).