Identification of cotton hybrids exhibiting different level of heterosis
Our previous study of 11 inbred lines and 30 intraspecific hybrids in six environments found that cotton hybrids had better and stable performance compared to inbred lines in yield traits [40]. Here, analysis of heterosis in these hybrids showed majority of hybrids had positive mid parent heterosis (MPH) and better parent heterosis (BPH) for boll weight, seed cotton yield (SCY), lint yield and lint percentage (Table S1). Later on, three hybrids with different level of yield heterosis were identified and defined as high (H), medium (M) and low (L). Notably, H-hybrid (SJ48×Z98) produced 19.9% MPH and 14.1% BPH in SCY (Fig. 1). M-hybrid (SJ48×851) had MPH of 13.3% and BPH of 2% for SCY, whereas L-hybrid (SJ48×DT) showed the only MPH of 8.8% for SCY. These three hybrids had common maternal inbred parent but paternal inbred parents all differed. H-hybrid is cross of maternal line SJ48 (A) with paternal parent Z98 (B) and M-hybrid with paternal parent 851 (C), whereas L-hybrid is cross of same maternal line with paternal parent DT (D). The differences in the level of yield heterosis suggest that these three hybrids together with their inbred parents are suitable for studying comparative transcriptome analysis and regulatory mechanism of yield heterosis in cotton.
Transcriptome profiles of 63 RNA libraries of cotton hybrids and their inbred parents at squaring stage
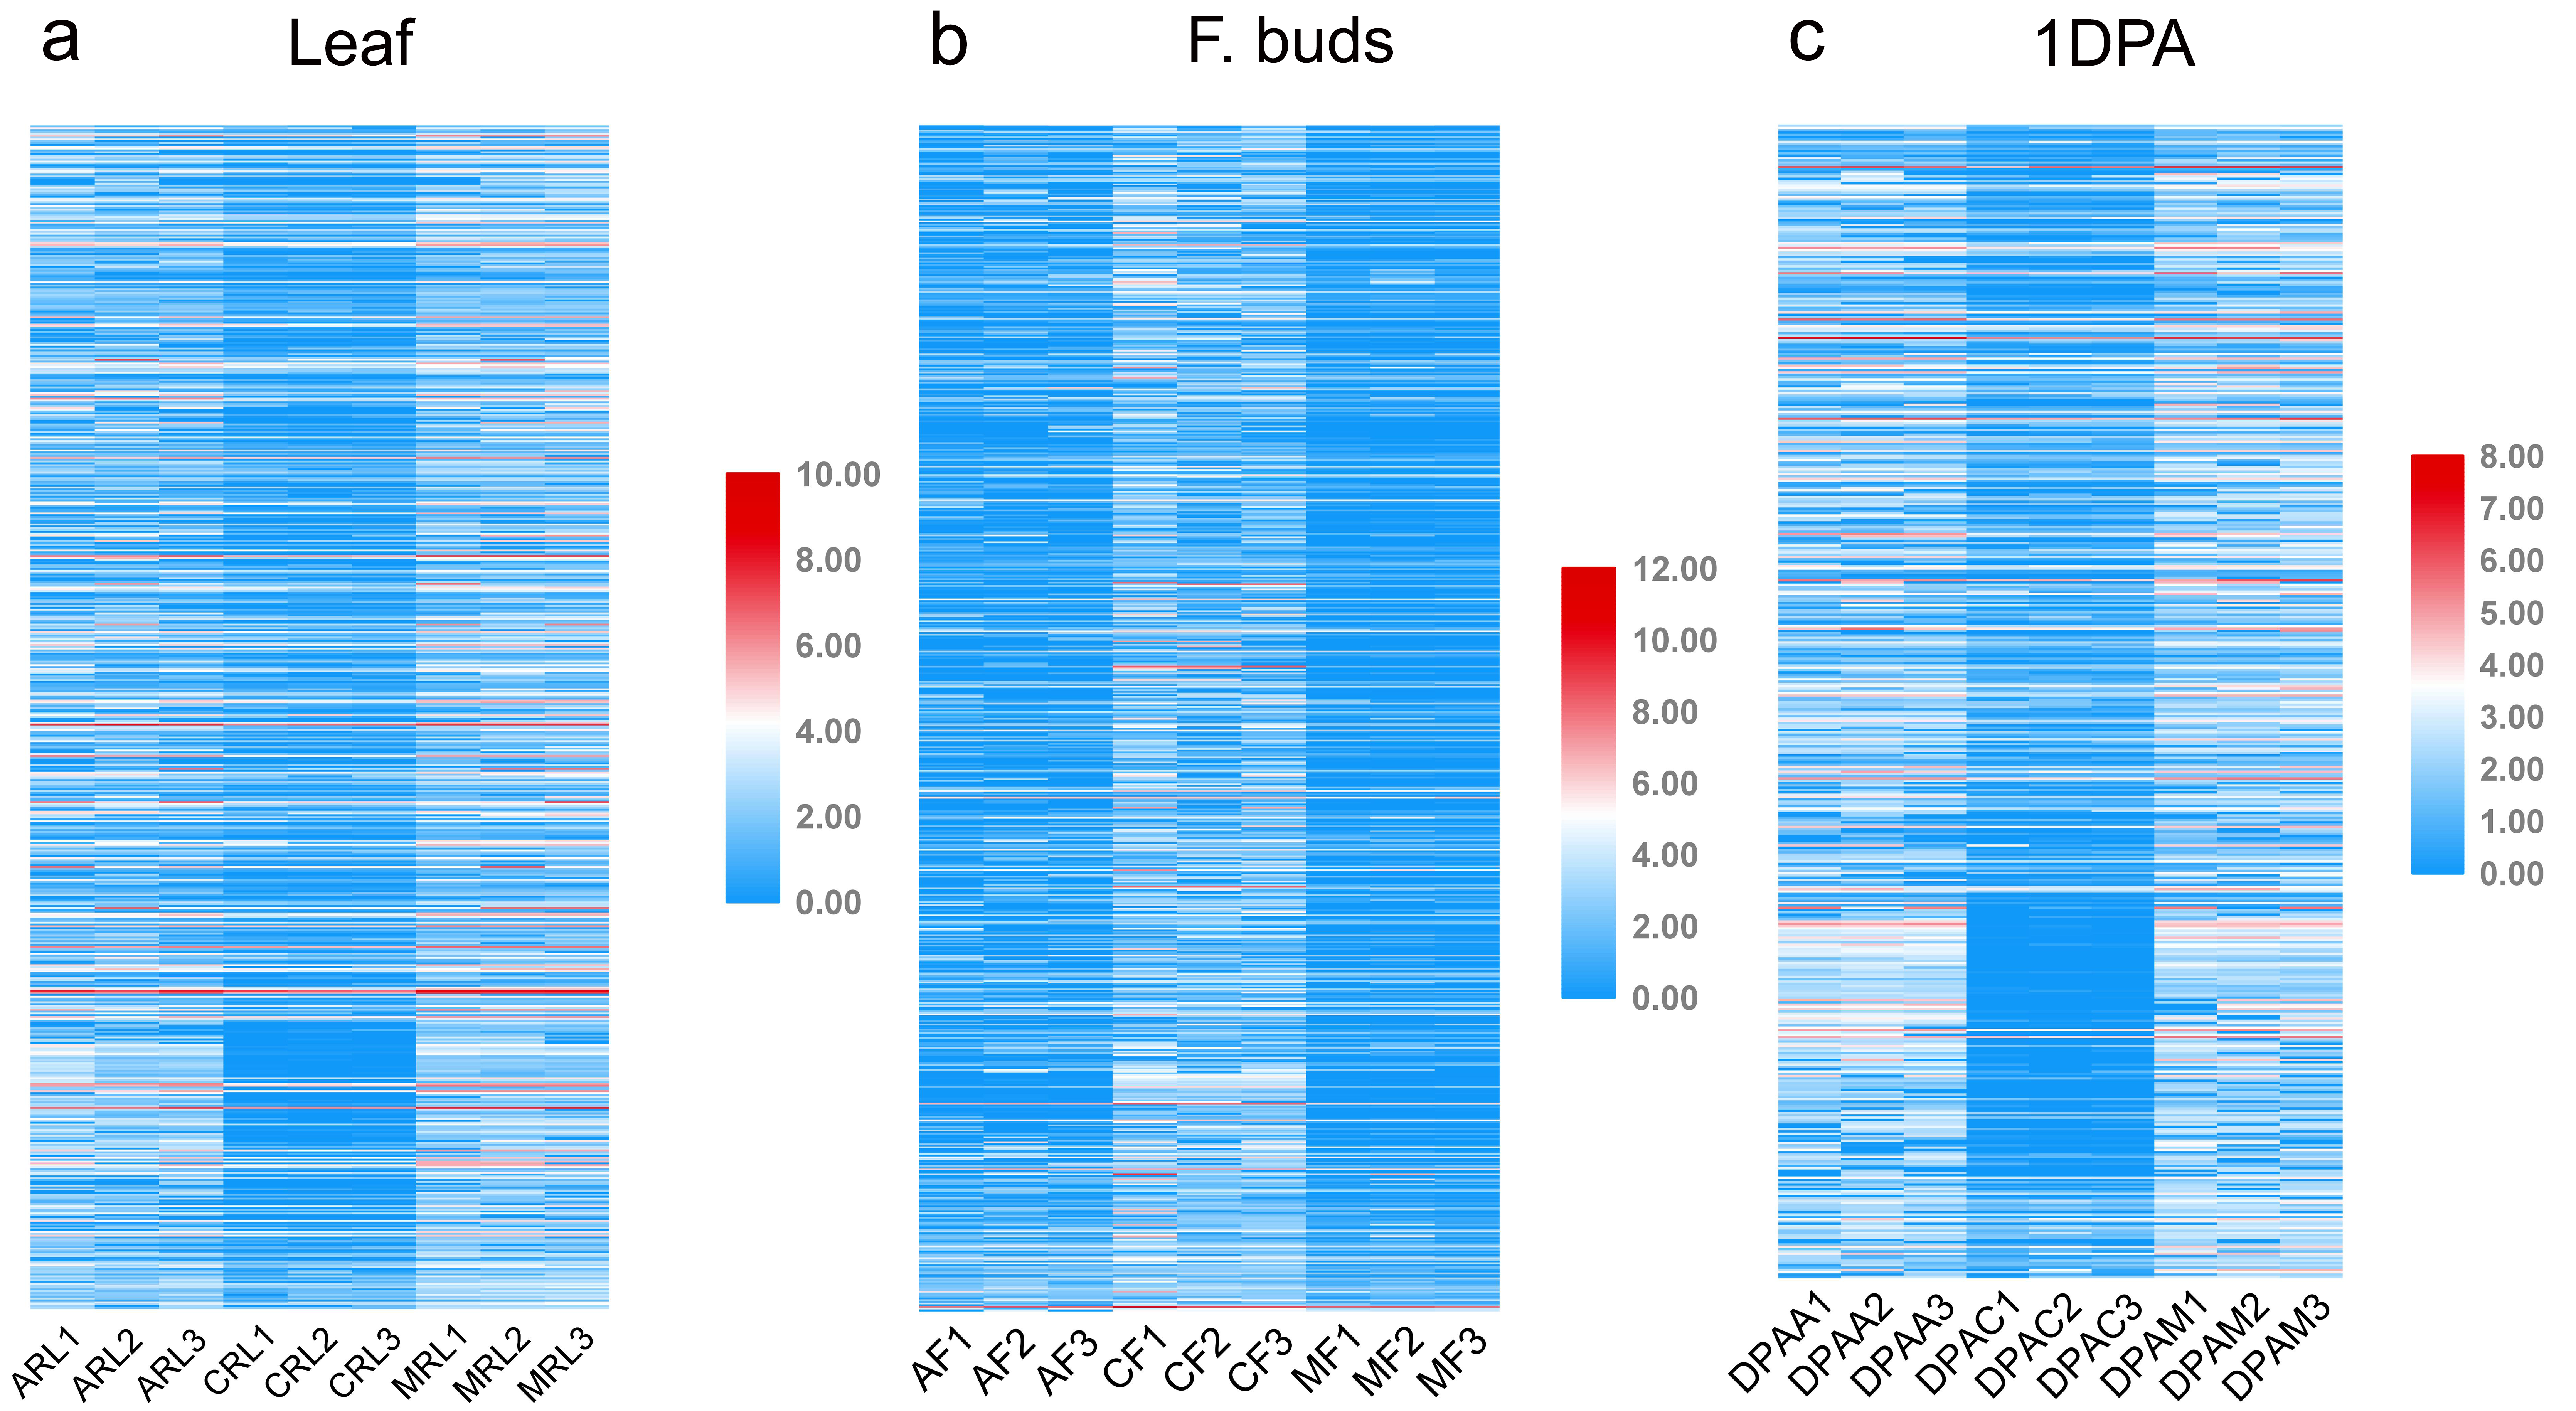
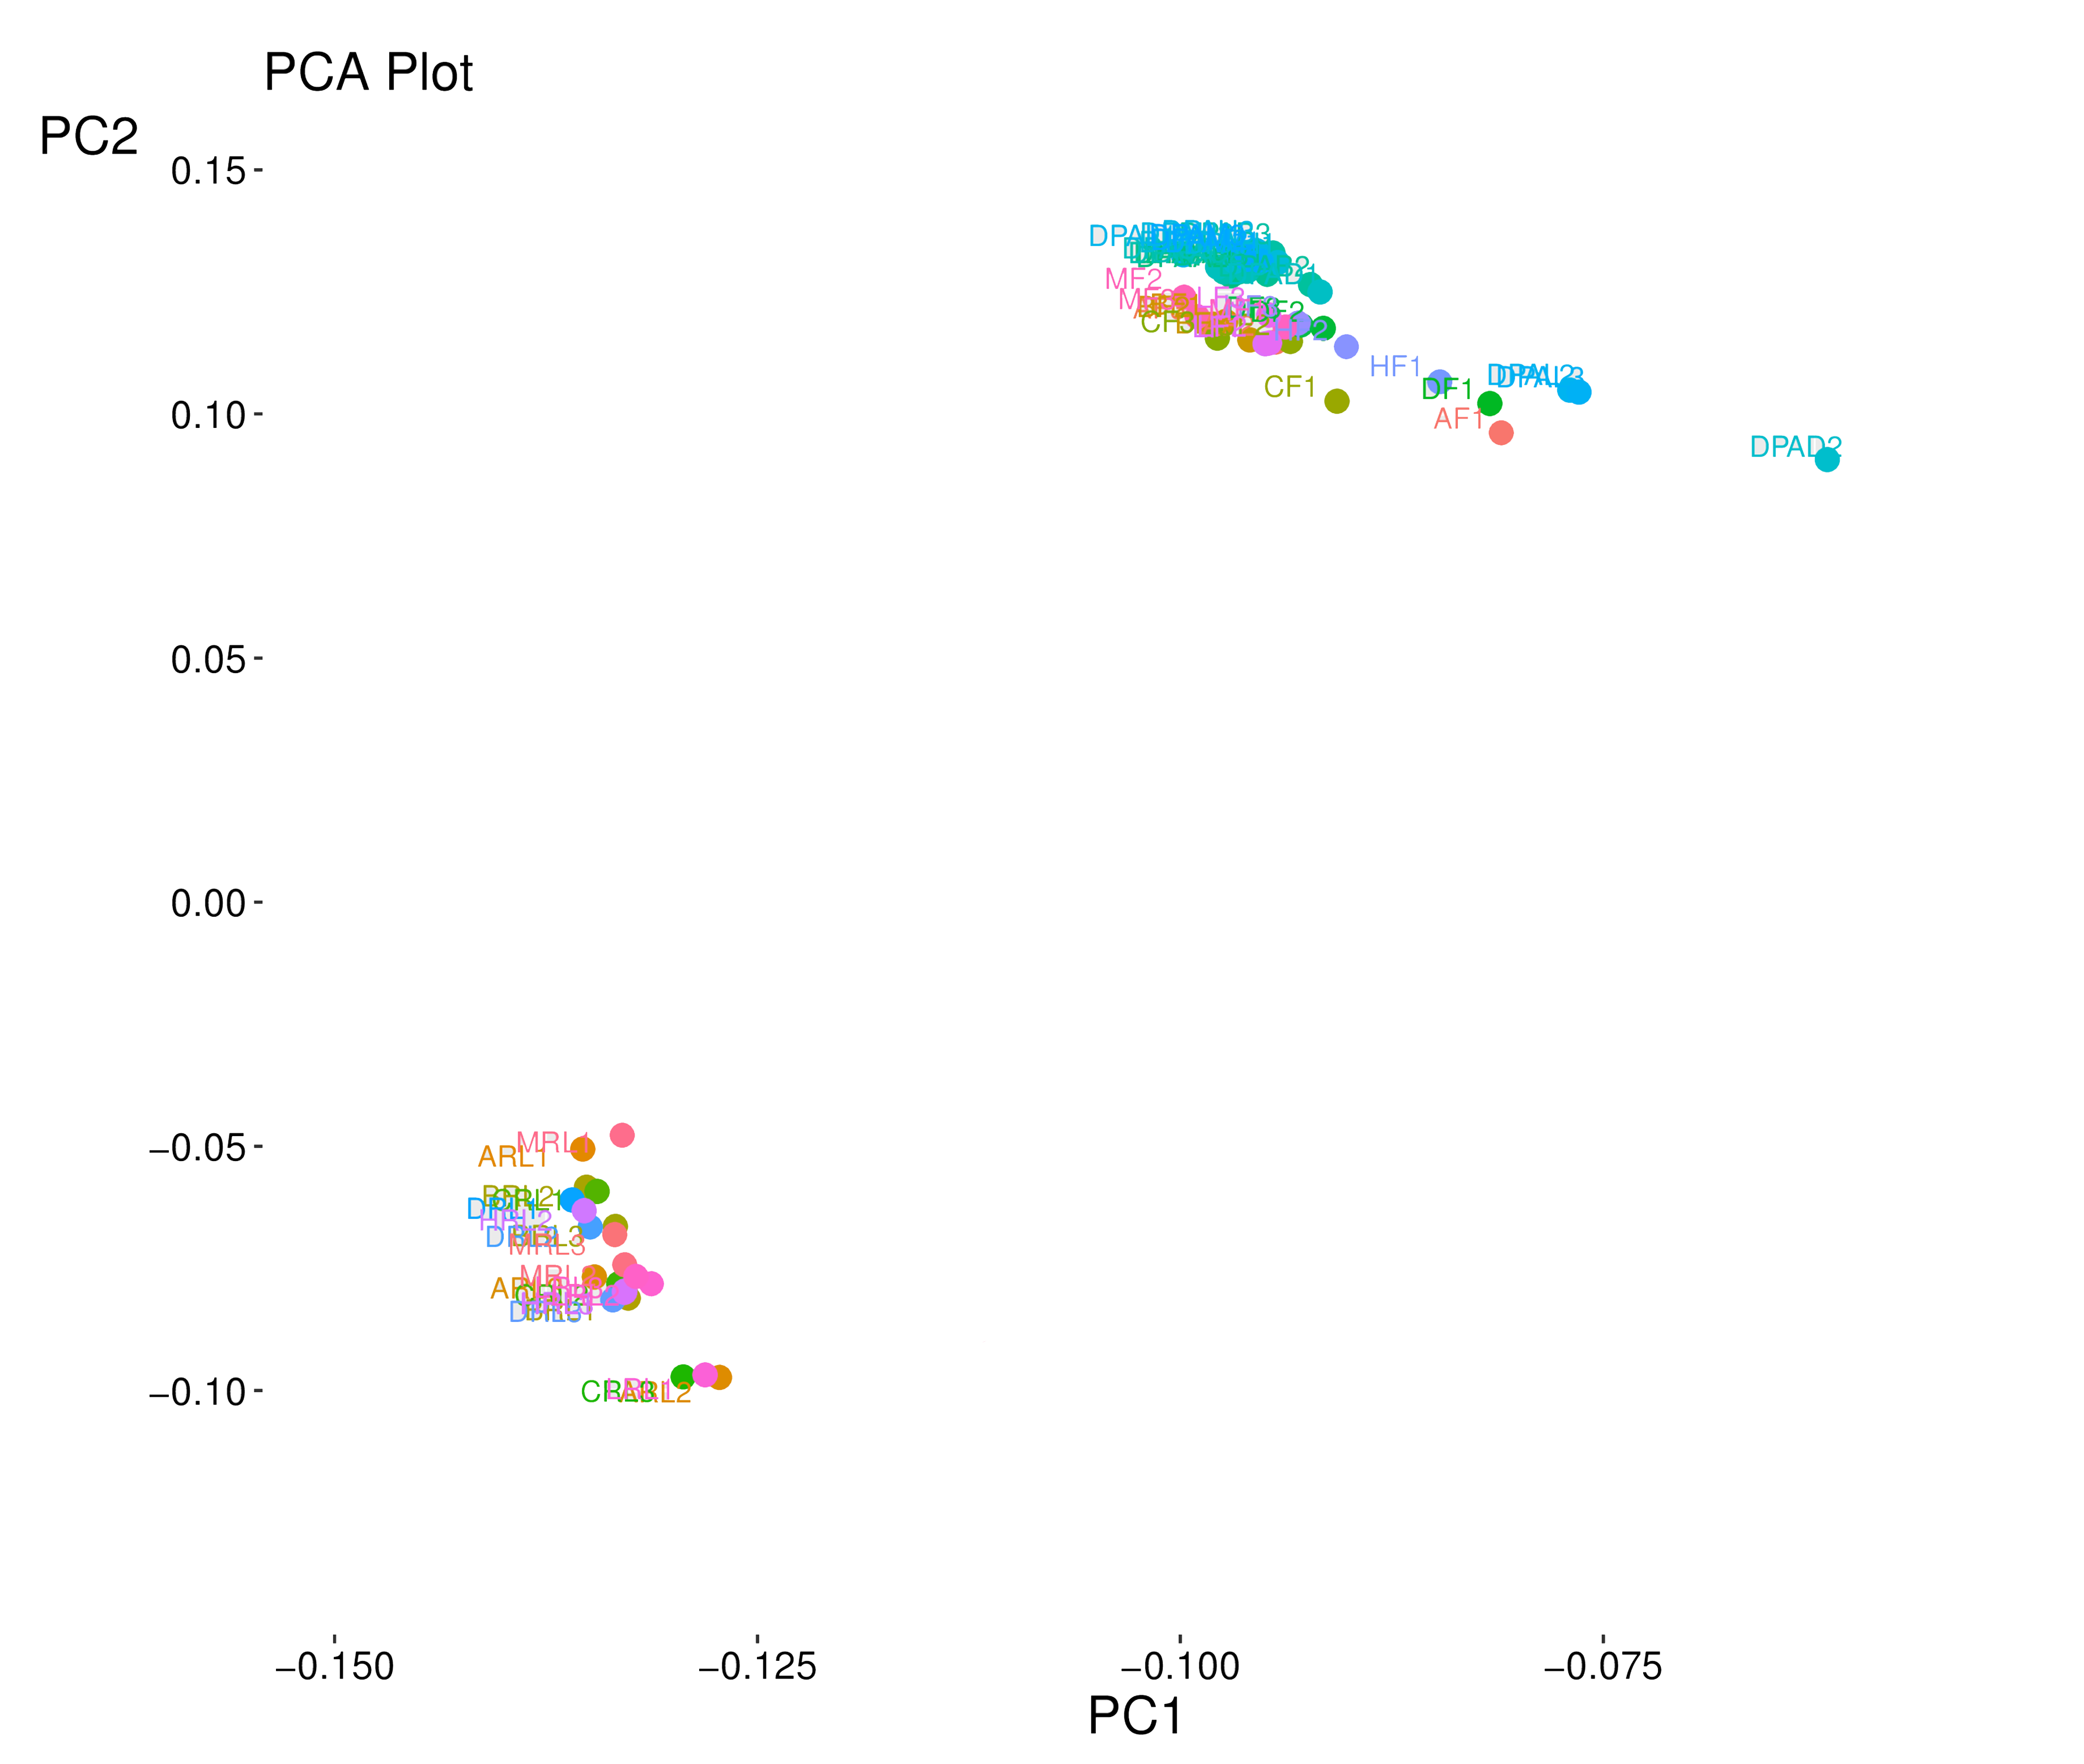
To understand global transcriptome profiles of yield heterosis in cotton, three contrasting hybrids and their four inbred parents were used to perform RNA sequencing at the squaring stage. Leaf (Hereafter RL), flower buds (F), and one day post anthesis (1 DPA) ovule tissues with three biological replications were used for each genotype. In total, 63 libraries (7×3×3) were constructed for deep Illumina pair-end RNA sequencing. A total of ~43-50 million reads were generated per library (Table S2). The average percentage of the valid read was ≥98.5 %. The value of Q30% was above 95% in this sequencing. Approximately, 94.9% of clean reads were mapped to the reference G. hirsutum genome [36]. Almost 90.5% reads were mapped to exon region in each sample and genotype. Wherein, intron and intergenic region mapping were ≤5% (Fig. S1). The brief detail of total mapped, unique mapped, multi mapped, non-splice, and splicereads for each library can be seen in Table S2. The principal component analysis confirmed variation among tissues and genotypes in this experiment (Fig. S2). Two biological replicates were concentrated in same cluster in biplot. Pearson correlation test for all replicate and genotypes exposed RL tissue had a strong correlation among each other (≥75) and weak with F and 1 DPA (≤ 50) (Fig. S3). Correlation between F and 1 DPA samples was relatively strong (~55-60).
Global transcriptome changes for cotton hybrids and their inbred parents
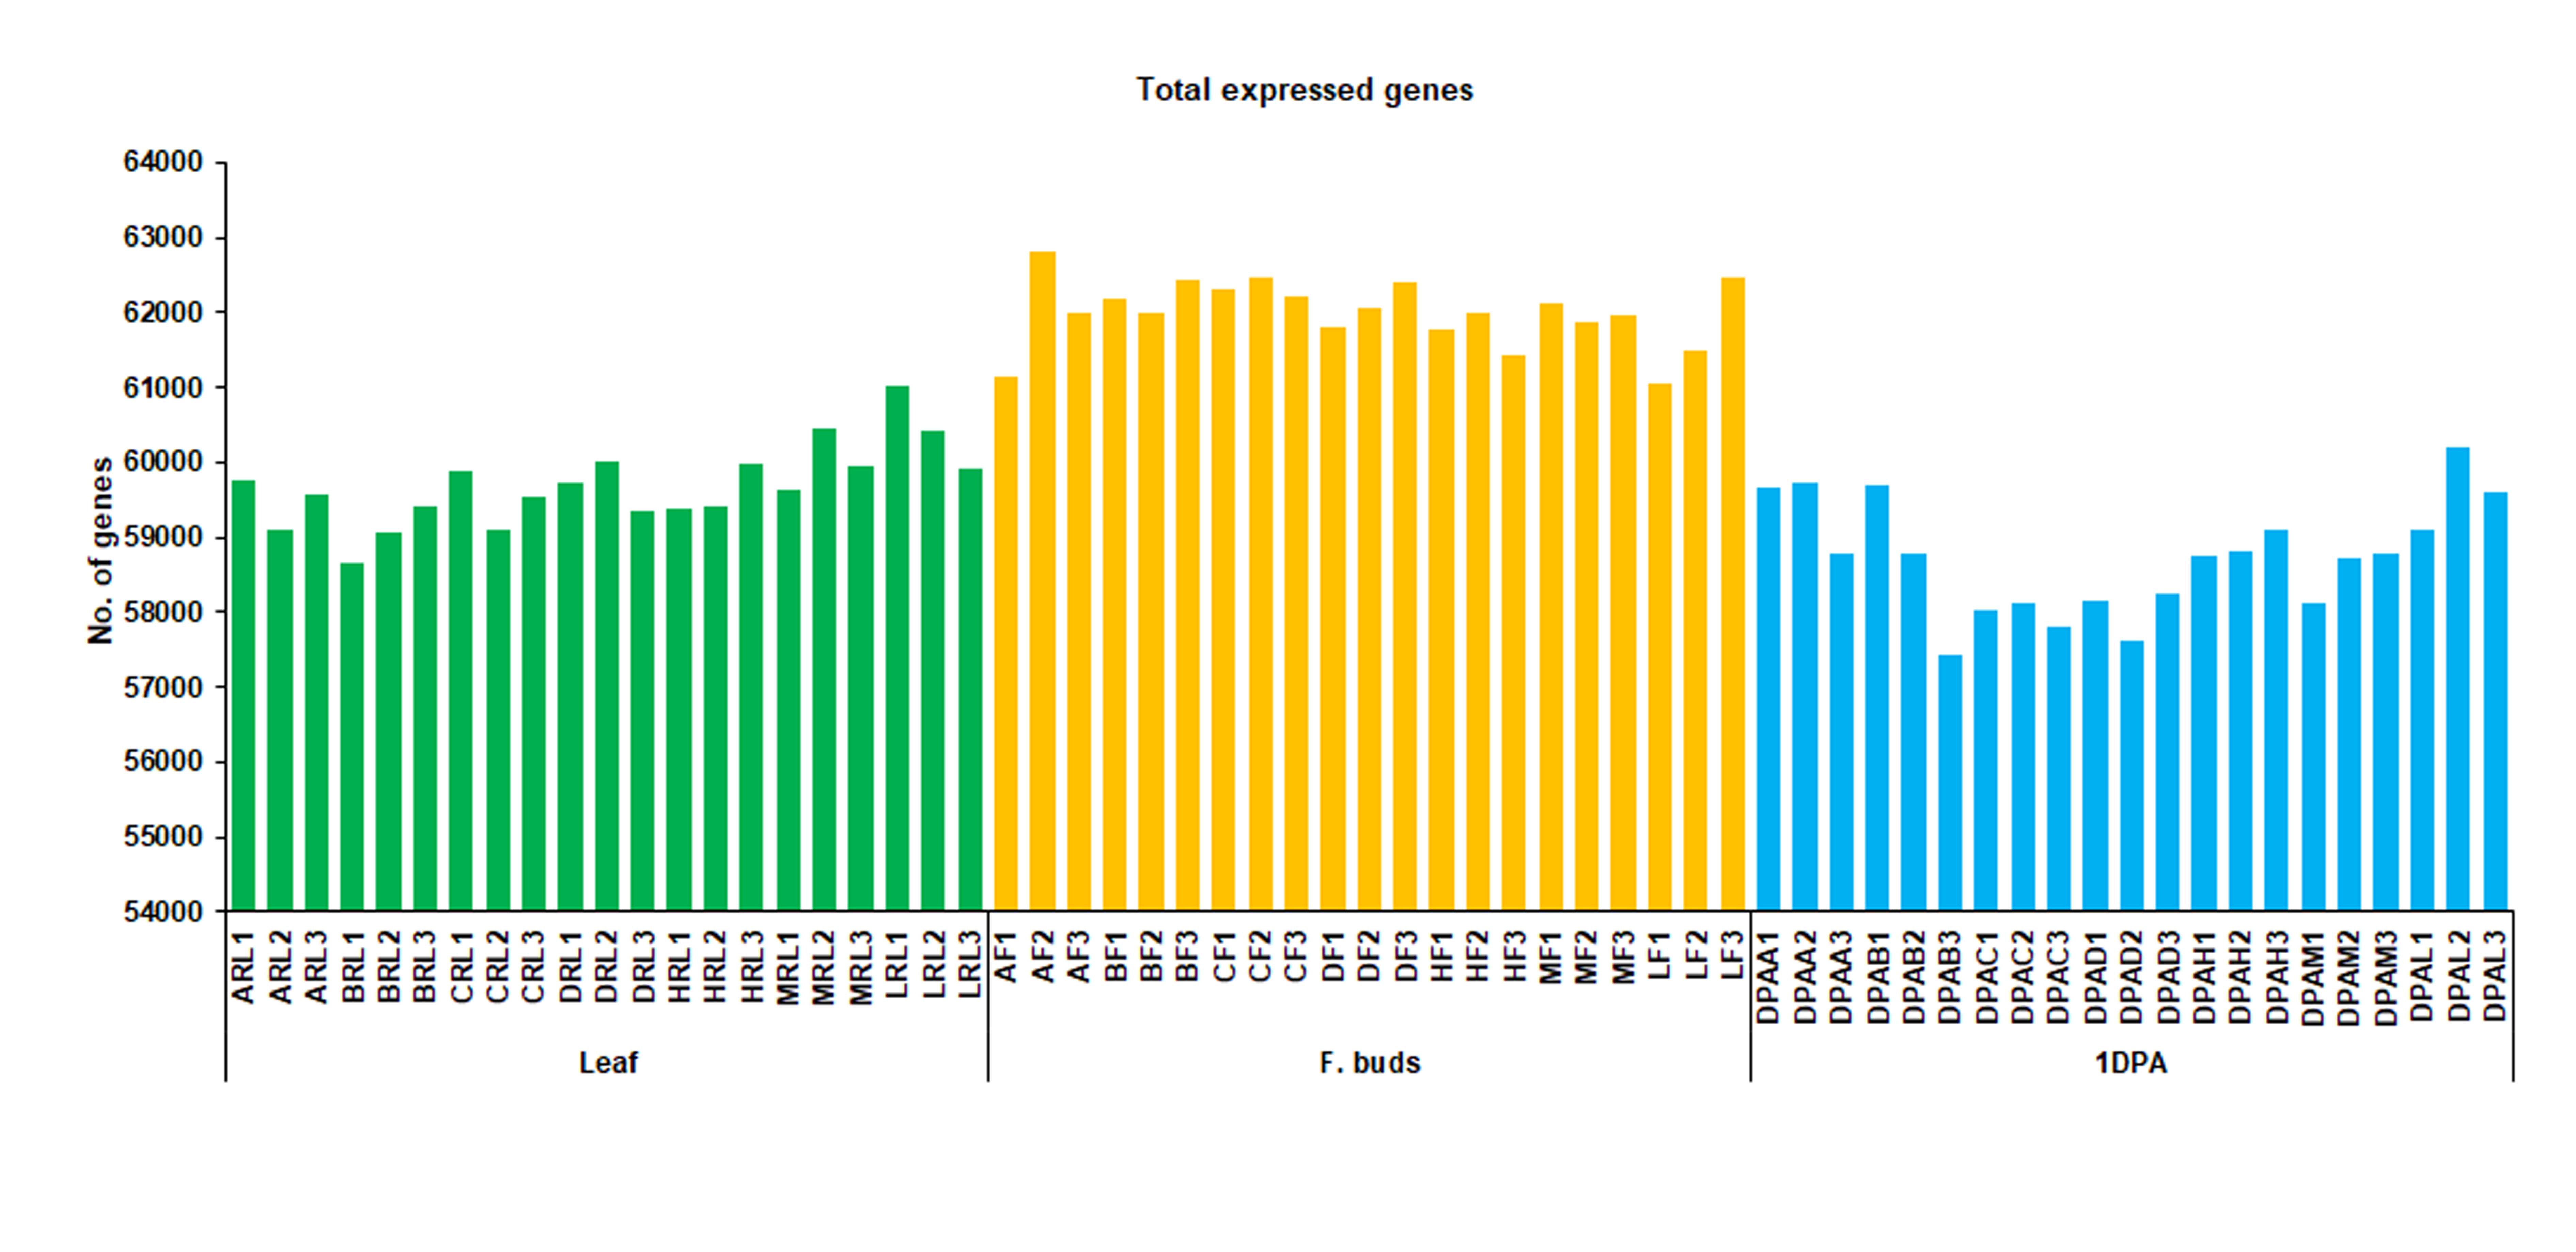
The number of total expressed genes provides an overview of the transcriptomic landscape for all datasets. The gene was considered to be expressed, if a gene has expression higher than zero in all three biological replicates of a sample. A total of ~60000 genes were expressed in each dataset (Fig. S4). Total number of expressed genes was much higher in flower buds compared to leaf and 1 DPA ovule. Different expression level for mRNA calculated as fragments per kilobase of exon model per million reads mapped (FPKM) was used to analyze the dynamic changes of transcriptomes between hybrids and their respective parents. Genes with expression levels higher than 0.5 FPKM in at least in one sample of each tissue were used for further analysis. The differentially expressed genes (DEGs) between samples were selected with log2 (fold change) >1 or <-1 and with statistical significance (p-value < 0.05). The comparison of transcriptomes was performed for each hybrid parent triad and tissue. Total number of DEGs (Up + down) and their distribution among H-hybrid parent triad is shown in Fig. 2. Comparative analysis among H and its maternal parents (A) showed highest number of total DEGs in flower buds (F), while compared with paternal parent (B), highest DEGs were respectively identified in 1 DPA (Fig. 2a). Combination of both parents A and B displayed higher number of DEGs (~2100 in all tissues) relative to H-hybrid. The results of DEGs distribution revealed that major portion of genes were common, whereas less were unique in each tissue (Fig. 2b, c, d). For instance, the combination of A with H had only 367 unique DEGs in RL.
The results revealed that M with its maternal parent (A) had lower percentage of DEGs as compared with paternal parent (C) (Fig 3a). Further, more common and less unique DEGs were identified in each tissue (Fig. 3b, c, d). Comparative analysis of DEGs for L-hybrid parent triad is summarized in Fig. 4. The result showed that L versus maternal parent (A) had 1112 total DEGs in RL, 935 in F, and 3528 in 1 DPA (Fig. 4a). The comparison of L and paternal parent (D) showed 1524, 790, and 4118 total number of DEGs in RL, F, 1 DPA, respectively. Comparison between parent A and D displayed higher number of DEGs in 1 DPA. Additionally, the results of distribution of DEGs in each tissue were similar to high and medium hybrids (Fig. 4b, c, d). Comparative transcriptome analysis in each hybrid parent triad at squaring stage determined that percentage of genetic differential expressions in hybrids was similar to those of between parents.
Analysis of expression level dominance for hybrids
Expression level dominance is a phenomenon in which offspring follow the expression patterns one of two diploids parents. In order to identify the expression magnitude and directionality in interspecific F1 cotton hybrids, DEGs were divided into 12 possible groups as described in material and methods following the conventions of Yoo et al., [41] (Fig. 5a). Results showed that the magnitude of expression of most genes in hybrids was similar to that of one parent (Fig. 5). For instance, most of the genes in leaf and 1 DPA ovule of H-hybrid displayed higher-maternal dominance expression and lower-maternal dominance expression respectively (Fig. 5b; Fig. S5a, c). Lower-paternal dominance expression had highest proportion in flower buds (Fig. 5b; Fig. S5b). Non-additive expressed genes in leaf and 1 DPA ovule of M-hybrid mostly displayed higher-maternal dominance expression (Fig. 5c; Fig. S6a, c). Wherein lower-maternal dominance expression had highest proportion in flower buds (Fig. 5c; Fig. S6b). In case of L-hybrid, most of leaf genes showed higher-maternal dominance expression (Fig. 5d; Fig. S7a), while lower-paternal dominance expression had highest portion in flower buds (Fig. 5d; Fig. S7b). Most of the genes in 1 DPA ovule displayed higher maternal dominance expression in this hybrid (Fig. 5d; Fig. S7c). In accordance with analysis of expression level dominance, most DEGs of hybrids displayed parent expression level dominance (P-ELD) at squaring stage in different tissues that probably play role for yield heterosis of cotton.
Functional annotation and pathway enrichment analysis of DEGs with P-ELD
To identify the function of DEGs with P-ELD, a total of four gene sets (3-6 groups) were pooled to perform GO and KEGG enrichment analysis for every hybrid and tissue (Table S3, S4). GO enrichment analysis for H-hybrid showed majority of genes in each tissue had functional annotation related to membrane, ATP and protein binding (Fig. S8a). Genes associated with chloroplast, extracellular region, and ATP binding had highest portion in leaf of M-hybrid (Fig. S8b). In flower buds, most of the genes were linked with biological process, molecular function, and integral component of membrane. Most abundant functional gene groups in 1 DPA ovule were biological process, chloroplast, and mitochondrion (Fig. S8b). Most enriched GO terms in leaf of L-hybrid were ATP binding, serine/threonine kinase activity (Fig. S8c). Functional annotation related to biological process, integral component of membrane, and chloroplast were abundant in flower buds, whereas gene involved in plasma membrane, regulation of transcription, and mitochondrion had highest portion in 1 DPA ovule of L-hybrid (Fig. S8c).
KEGG enrichment analysis of P-ELD genes exposed that starch and sucrose metabolism, endocytosis, and tryptophan metabolism had more significance in leaf of H-hybrid (Fig. 6a). Majority of genes in flower buds were enriched in starch and sucrose metabolism, phagosome, and pentose and glucuronate interconversions. Whereas plant-pathogen interaction and plant hormone signal transduction were more representative pathways in 1 DPA ovule (Fig. 6a). Leaf of M-hybrid showed more enrichment in metabolic pathways e.g., starch and sucrose, ascorbate and aldarate, and tryptophan (Fig. 6b). In flower buds, starch and sucrose metabolism, plant hormone signal transduction had more gene enrichment (Fig. 6b). Starch and sucrose metabolism and phosphatidylinositol signaling system was enriched and significant in 1 DPA of this hybrid (Fig. 6b). Pathway categorization showed that L-hybrid had starch and sucrose metabolism and ribosome significance in leaf (Fig. 6c), whereas starch and sucrose metabolism, plant hormone signal transduction, and ribosome were more representative pathways in flower buds (Fig. 6c). In 1 DPA ovule, plant hormone signal transduction, plant-pathogen interaction, and starch and sucrose metabolism had more gene enrichment in this hybrid (Fig. 6c).
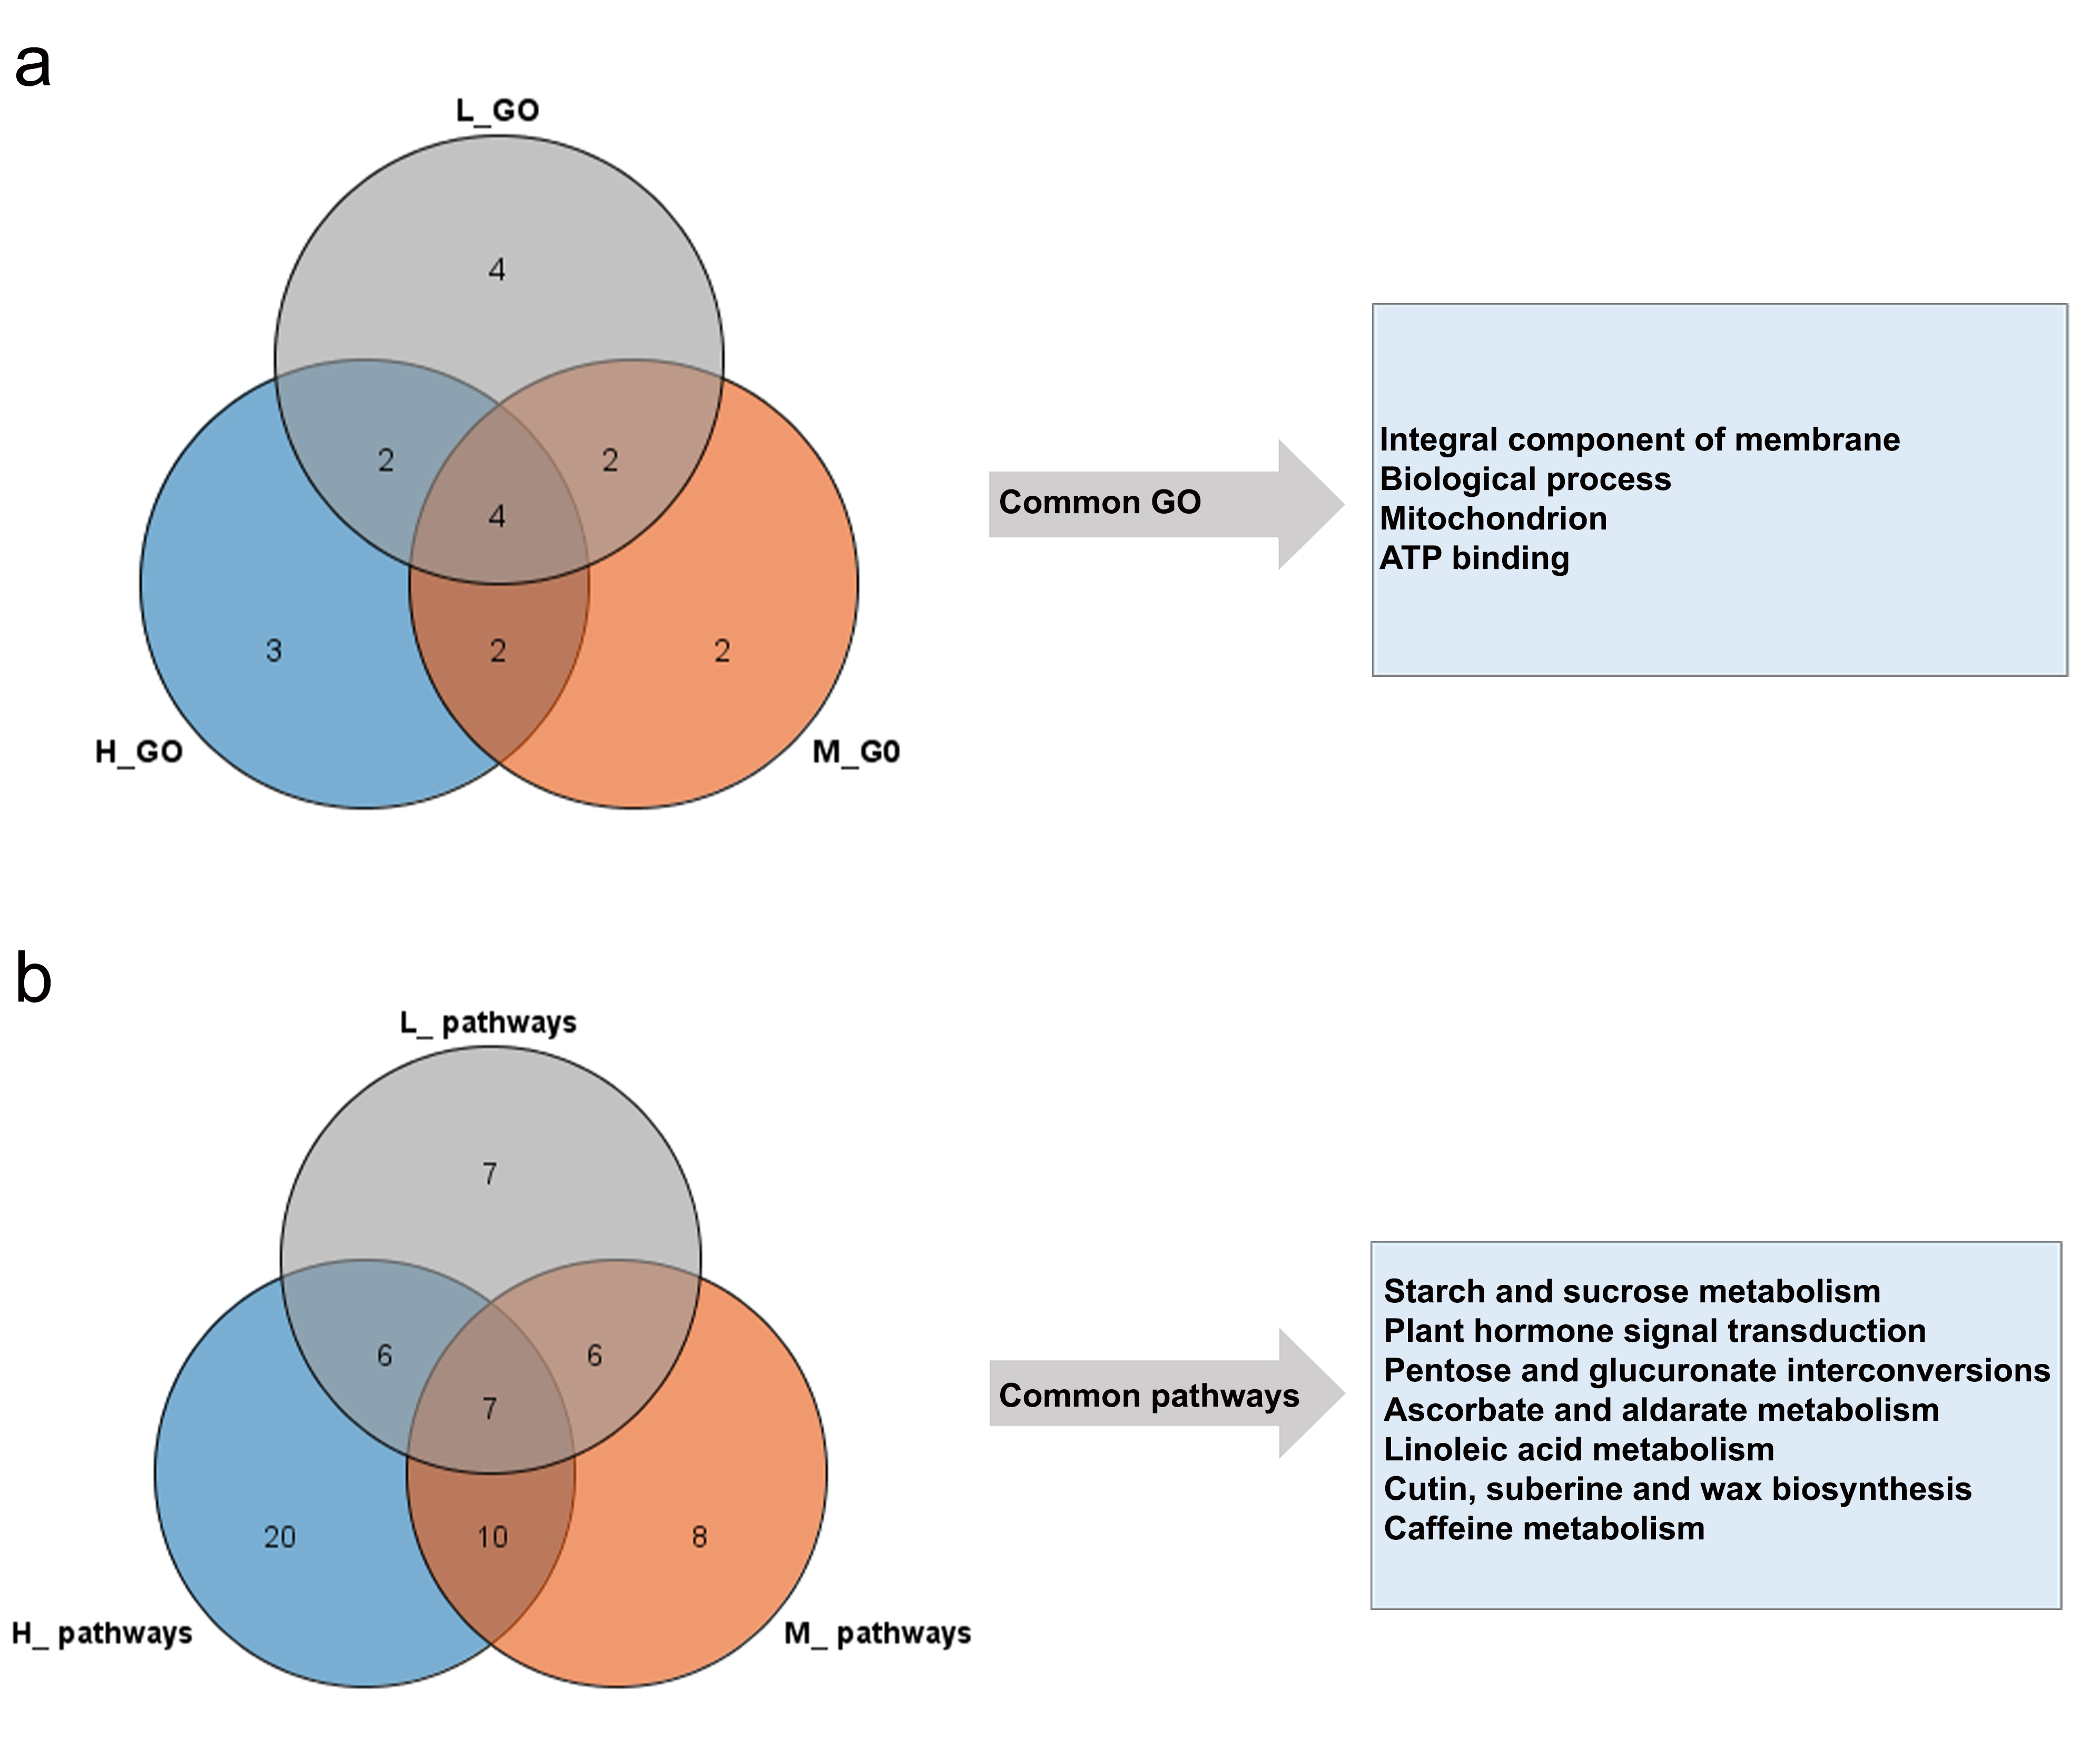
The common function of P-ELD genes in hybrids was integral component of membrane, biological process, mitochondrion, and ATP binding (Fig. S9a). Genes involved in common pathways such as sugar metabolism, plant hormone signal transduction, and wax biosynthesis had more significance in hybrids growth during reproductive stage (Fig. S9b). The nutrient assimilation and their distribution have key importance in plants during reproductive growth. Theoretically, the difference in genes expression involved in biological process of hormone and sugar metabolite may contribute to the yield heterosis of cotton.
Mapping of key pathways DEGs on known seed cotton yield QTLs
QTL provide associations between genomics and phenomics and using QTLs can be an effective approach to understand the genetic complexities of yield heterosis [42, 43]. Here, we investigated the relationship between key pathway DEGs, seed cotton yield QTLs, and yield heterosis. Hybrids DEGs involved in key pathways were used to map on already known 57 seed cotton yield (SCY)_QTLs (Table S5). Mapping results showed that 74 hybrid DEGs were mapped on 43 QTLs (Fig. 7). Interestingly, most of the genes were mapped on QTLs regions that were reported more than once (Fig. 7). Out of these DEGs, 6 genes had differential expression in all hybrids compared to their parents, whereas 13 were common between any of two hybrids. 13 DEGs were specific to medium hybrid. However, 17 and 25 DEGs were specific to high and low hybrid respectively (Fig. S10)
Co‑expression network analysis of high and low hybrids
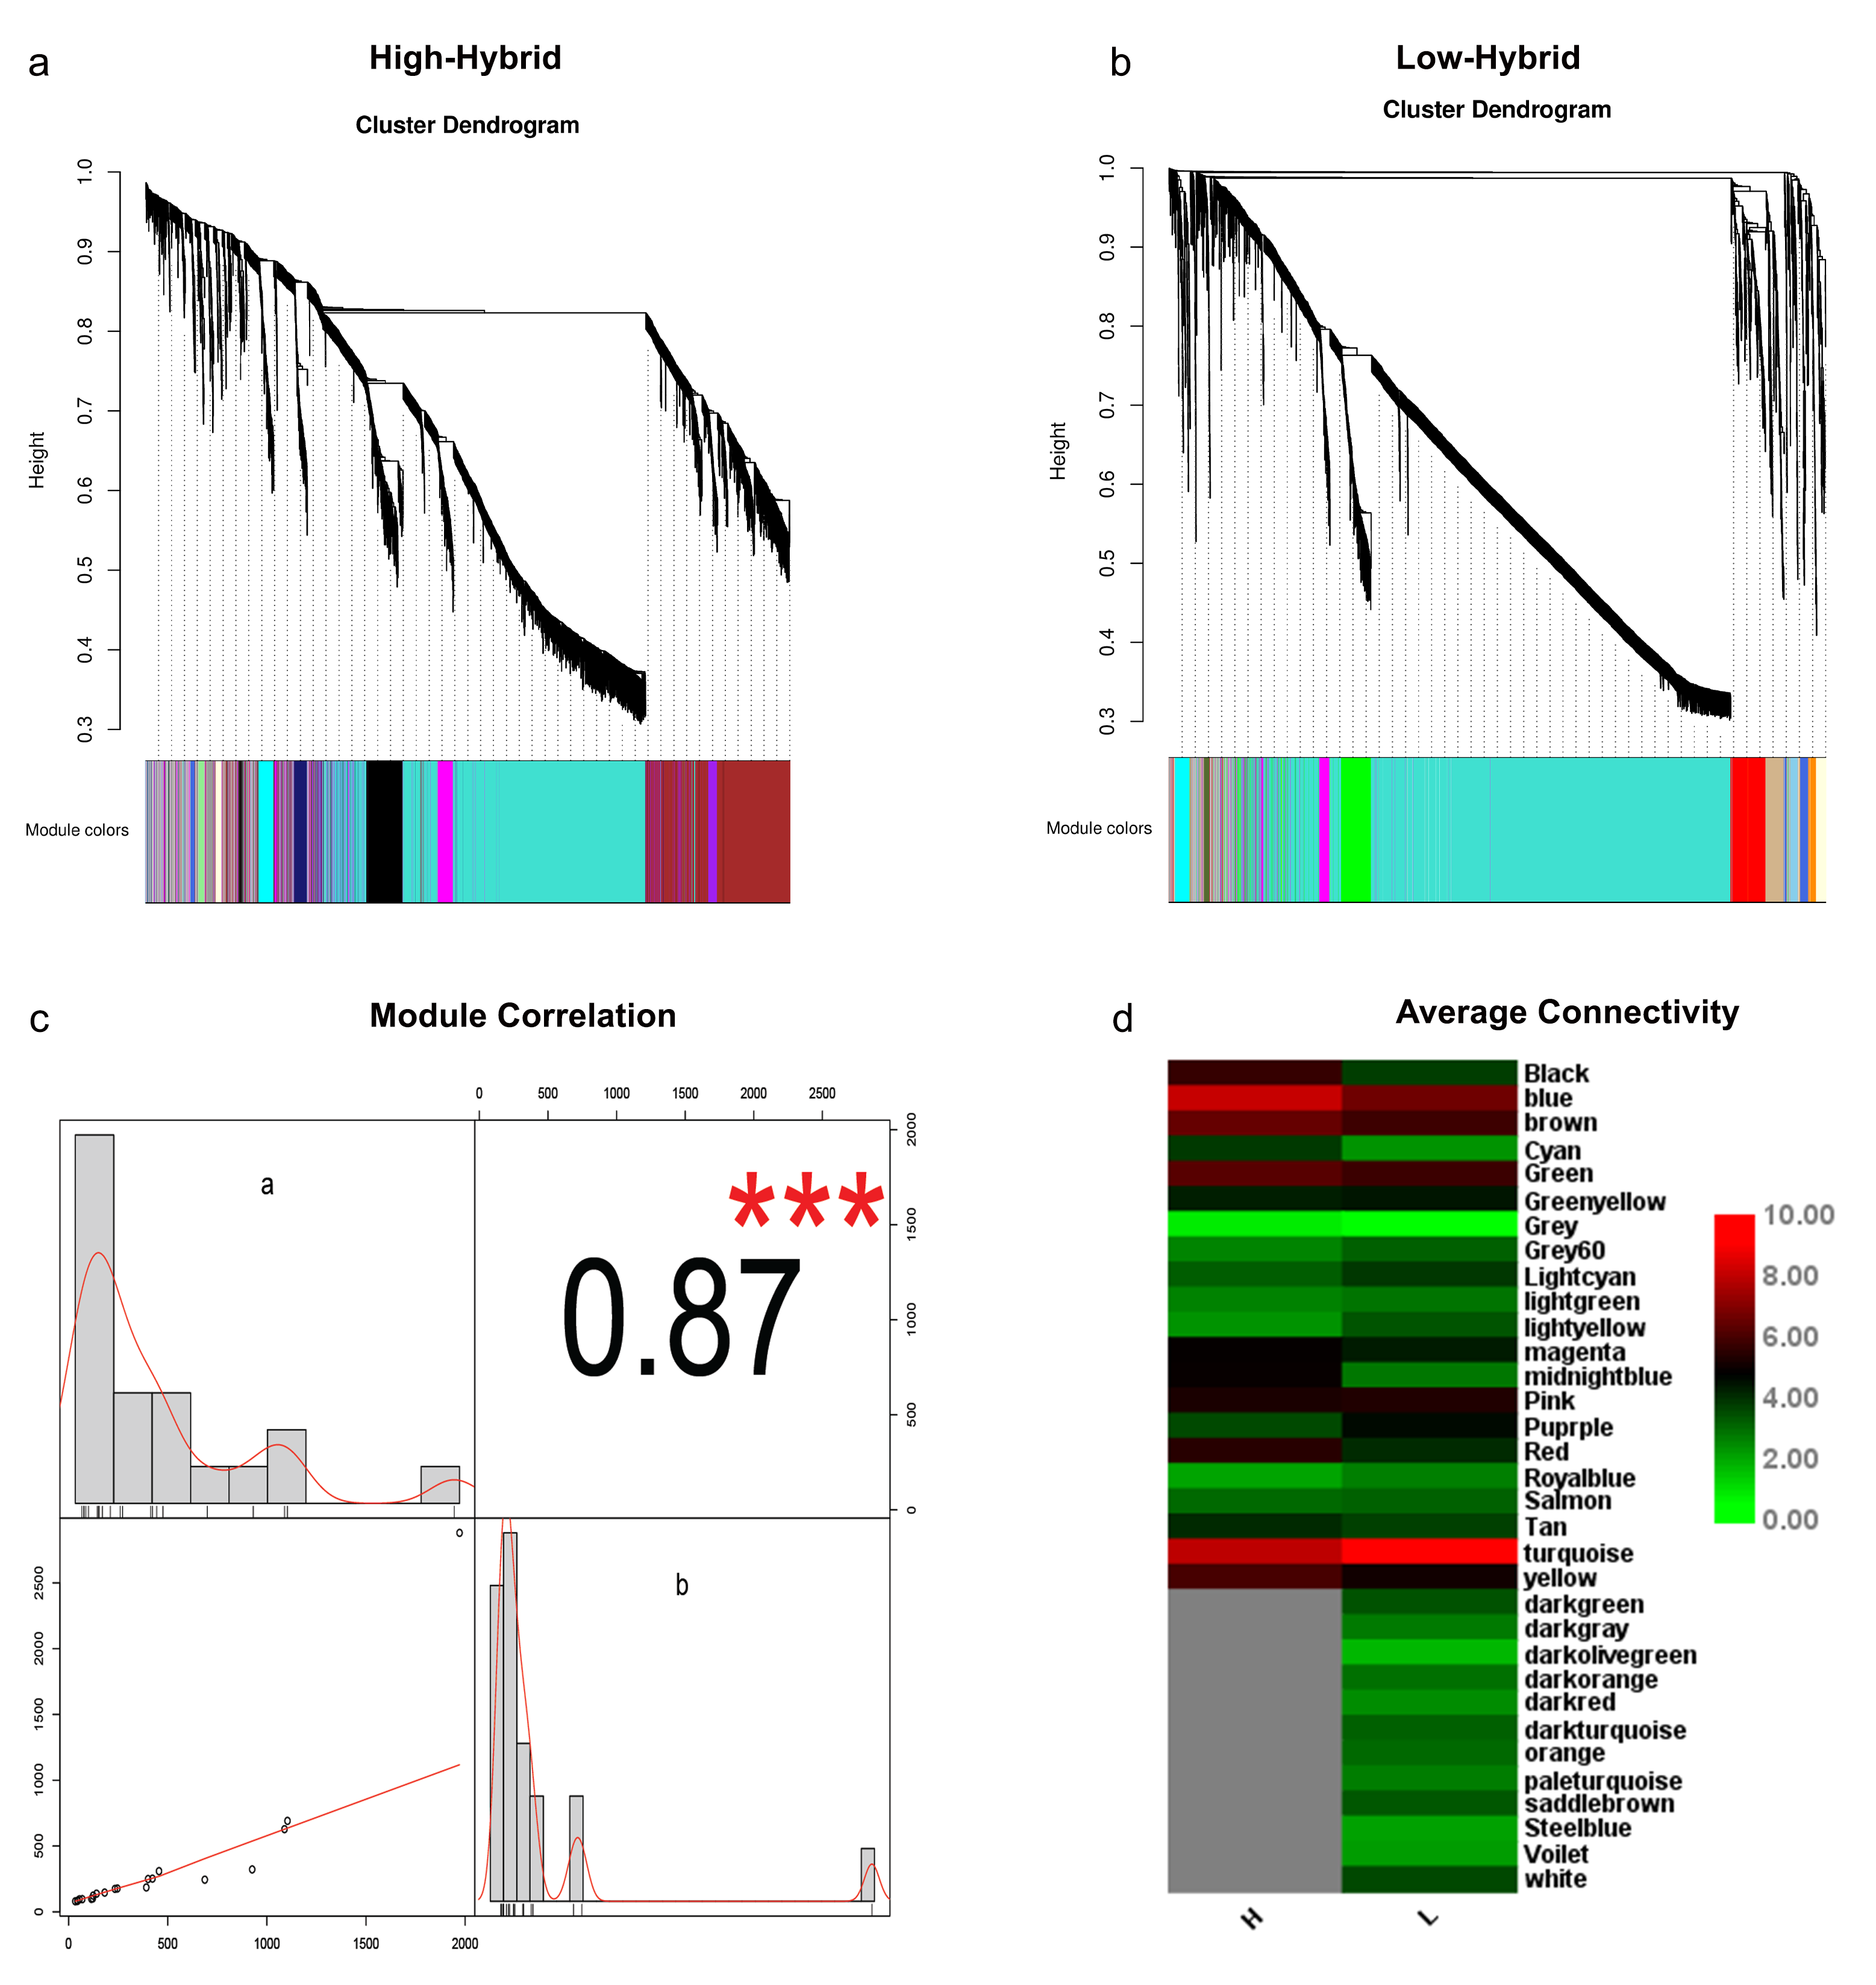
Weighted gene co-expression network analysis (WGCNA) is an important tool for inferring the potential relationships between co-expressed genes, construction of co-expression network helps to understand the functional linkage between gene groups instead of individual genes, and provides novel insight into the system-level understanding of a biological process [44, 45]. Here, co-expression network analysis was performed in high and low hybrids by using DEGs (Pooled from leaf, flower buds and 1 DPA) identified in our RNA-seq data analysis. Highly connected genes were clustered into distinct modules. Cluster dendrogram displayed that interconnectivity and size of each module was quite different in high and low hybrids (Fig. S11a, b). Interestingly, 8862 genes distributed in 21 modules with the size ranging from 34 to 1972 genes were identified in high hybrid, wherein 7863 genes scattered in 33 modules with the module size ranging from 42 to 2880 were determined in low hybrid (Table S6). The correlation analysis between high and low hybrids modules was very strong (Fig. S11c). In high hybrid, average connectivity of genes in many modules was higher as compared to low hybrid (Fig. S11d). Although turquoise and blue module had the highest connected genes in both hybrids, but correlation coefficients among different genes were much higher in blue module.
Genes regulatory co-expression network for seed cotton yield heterosis
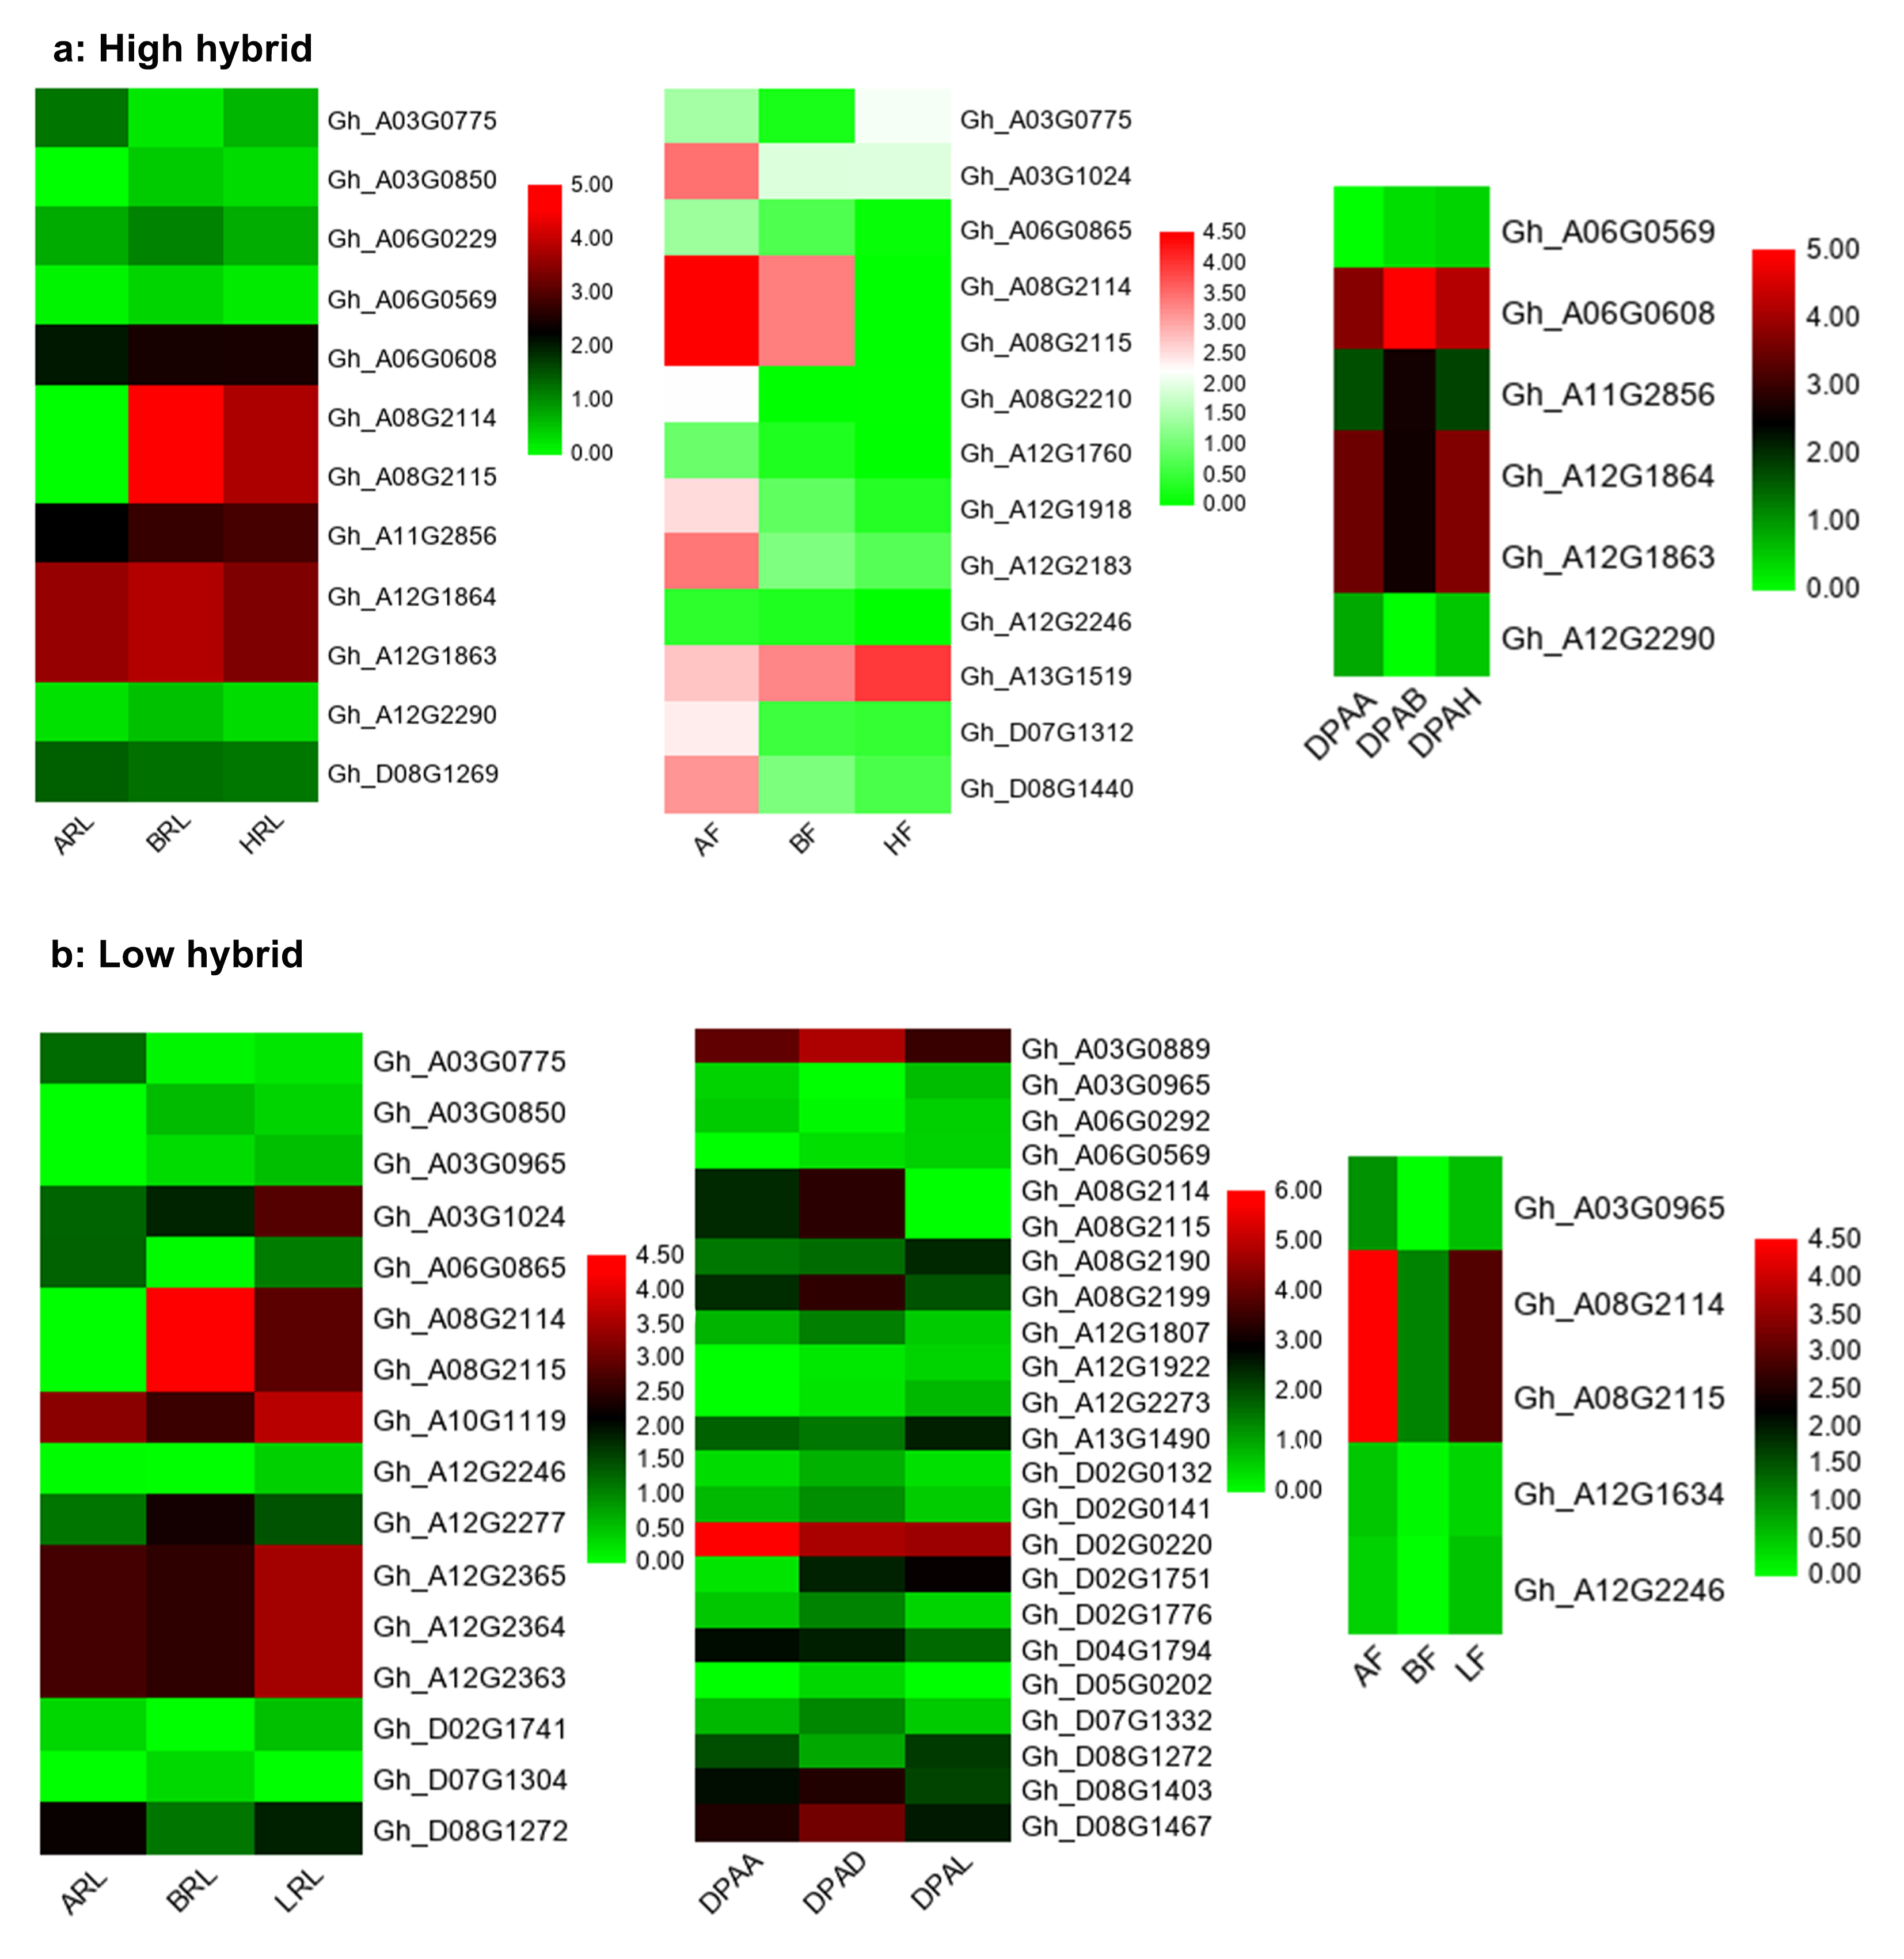
To construct the significant regulatory network for yield heterosis, first, we selected blue gene module in both hybrids. Secondly, the DEGs mapped on SCY-QTLs together with their interaction genes having weight ≥0.40 were screened (Table S7). Subsequently, our constructed gene co-expression network showed that nine SCY-QTLs genes had many interconnected genes involved in biological and molecular functions such as cell wall regulation or modification, carbohydrate metabolic processes, ion binding and transportation, biological regulation, methylation, endoplasmic reticulum, actin filament processing, catalytic activities, and protein binding or transportation (Fig. 8). We considered these nine genes as putative candidate genes for yield heterosis. These genes showed hybrid specific expression profile in RNA-seq analysis (Fig. S12). Out of nine genes, two genes Gh_A03G1024 (BZR1: Brassinazole-resistant 1) and Gh_D08G1440 (ASK8: Shaggy-related protein kinase theta) involved in plant hormone signal transduction pathway showed differential expressions in flower buds of high hybrid. Another three starch and sucrose metabolism pathway also had differential expressions in flower buds of high hybrid. These genes were Gh_A08G2210 (Endoglucanase 16), Gh_A12G2183 (GBSS1: Granule-bound starch synthase 1, chloroplastic/amyloplastic), and Gh_D07G1312 (APL2: Glucose-1-phosphate adenylyltransferase large subunit 2, chloroplastic). The remaining four had specific differential expression in 1 DPA ovule of low hybrid. Three of them denoted as Gh_D08G1467 (MPK4: Mitogen-activated protein kinase 4), Gh_A03G0889 (PHO1: Phosphate transporter PHO1 homolog 3), and Gh_A08G2199 (JAZ10: Jasmonate-zim-domain protein 10) were enriched in plant hormone signal pathway. The remaining one gene Gh_D05G0202 (CRR21: Pentatricopeptide repeat-containing protein) belonged to starch and sucrose metabolism pathway. Collectively, gene co-expression network analysis in hybrids not only helped to screen key genes but also provided novel insights into the regulatory mechanism of yield heterosis of cotton.
Quantitative real-time PCR (qRT-PCR)
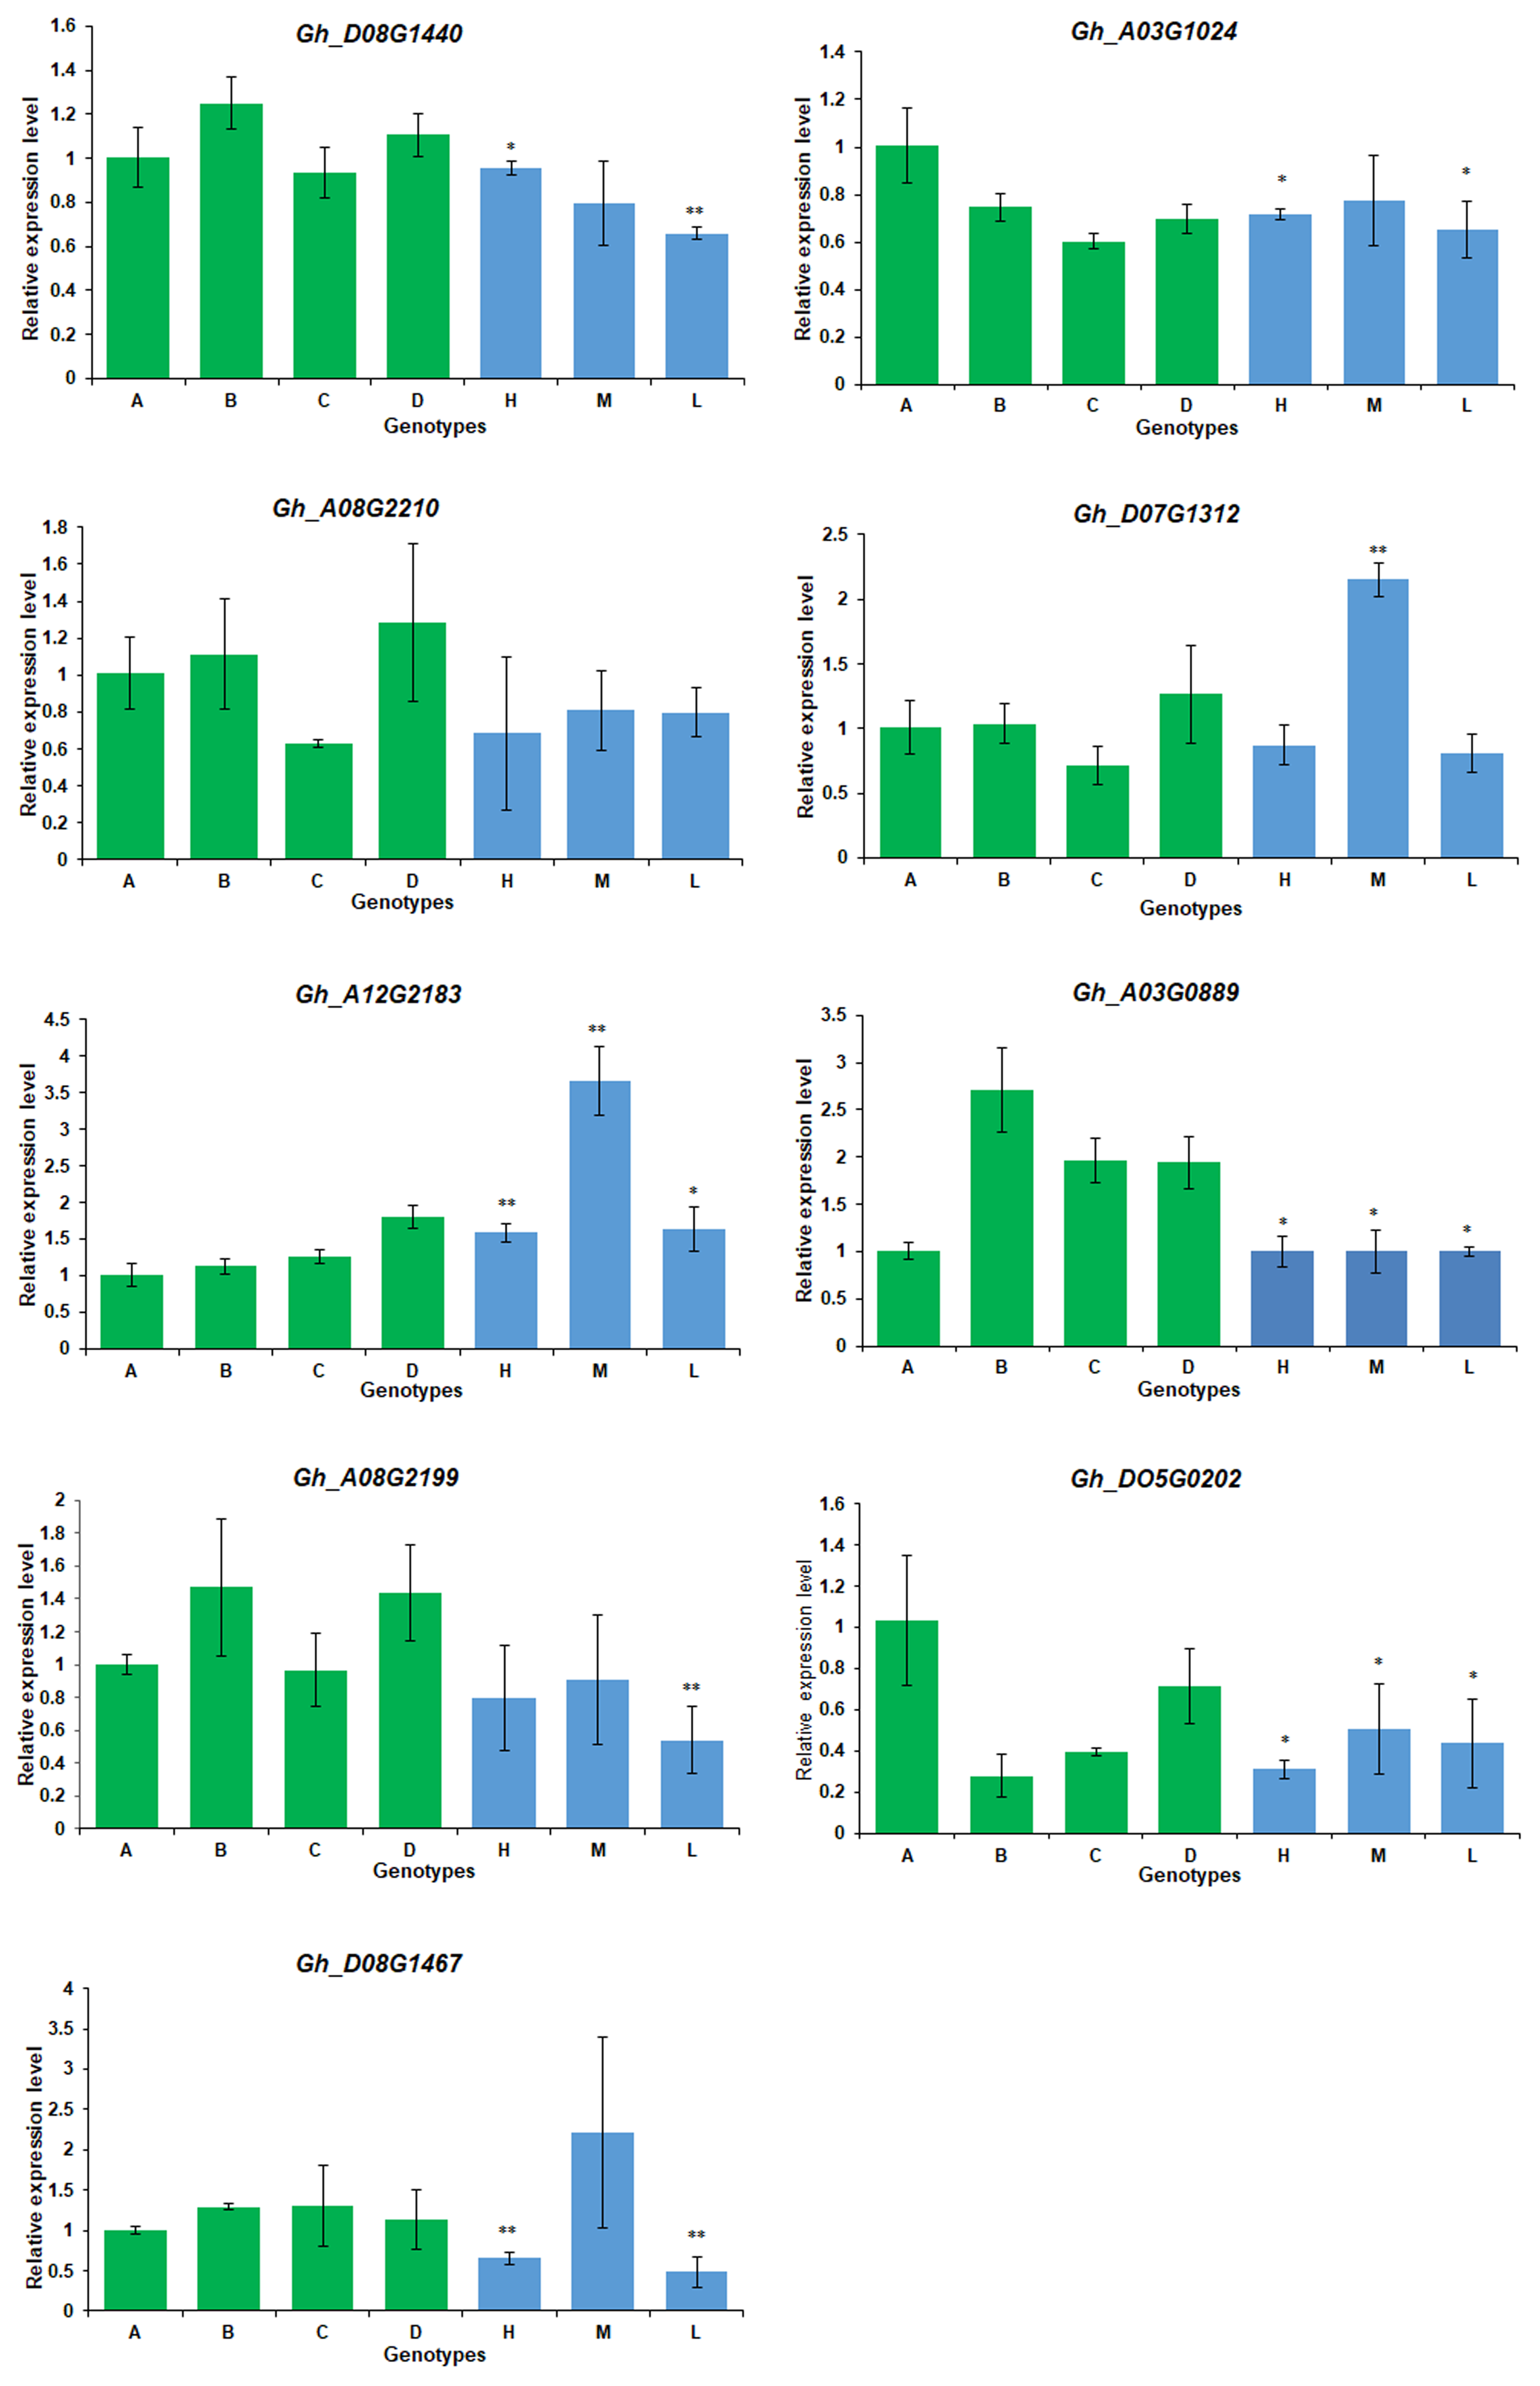
We selected nine candidate DEGs to perform qRT- PCR analysis. These genes showed hybrid and tissue-specific expression in RNA-seq, mapped on SCY-QTLs, and had the highest interconnected genes in the co-expression network. Primer was designed in gene-specific way to ensure accuracy of expression (Table S8). Analysis results showed Gh_A03G1024, and Gh_D08G1440, Gh_A12G2183, Gh_A03G0889, Gh_D05G0202, Gh_A08G2199, Gh_D08G1467 and Gh_D07G1312 displayed a significant change in each hybrid compared from their one parent or both parents (Fig. S13). However, gene Gh_A08G2210 showed no statistical difference in hybrids. More interestingly, these genes apparently showed the expression similar to their maternal or paternal parent as determined in RNA-seq results.