Insights from Descriptive Analysis
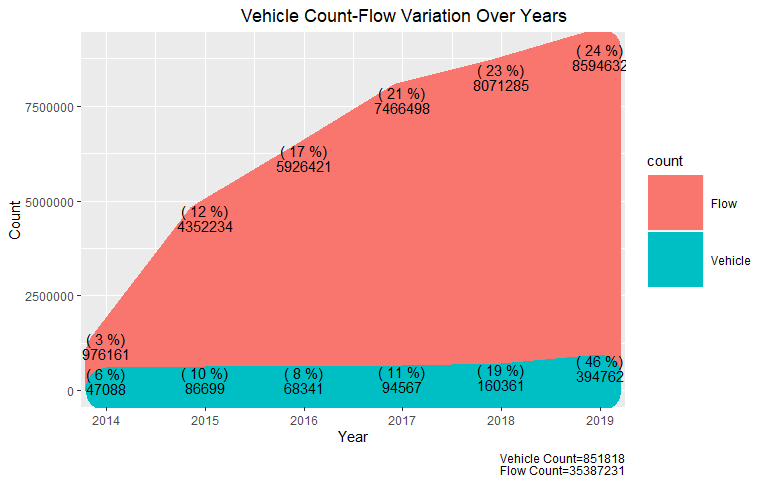
The percentage of distinct vehicles and flows on the expressway were increasing over time. However, the changes between distinct vehicles and flows differed. The average yearly percentage changes of vehicles was 8% which is approximately double as compared to the average yearly changes in vehicles flow which was found to be 4.2% [Figure S1].
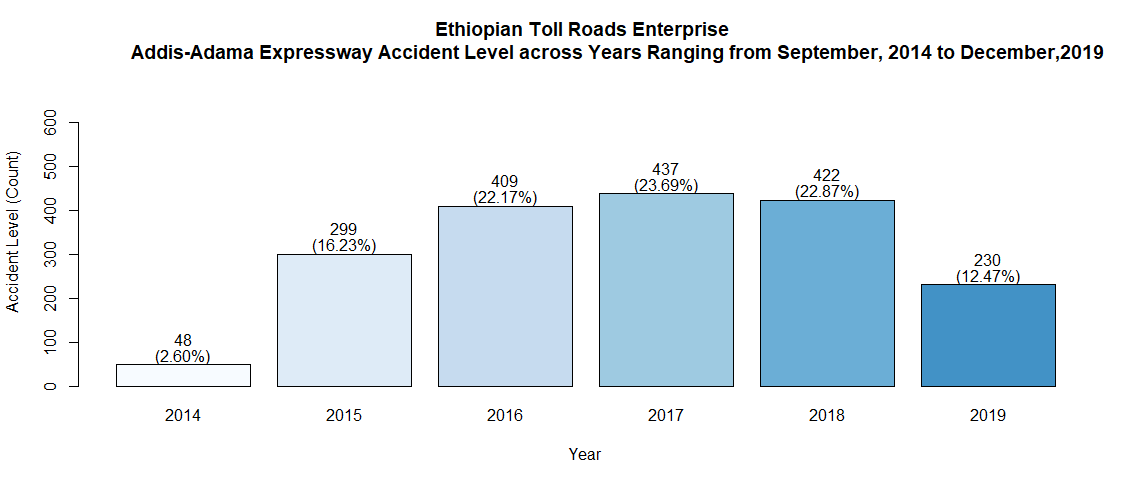
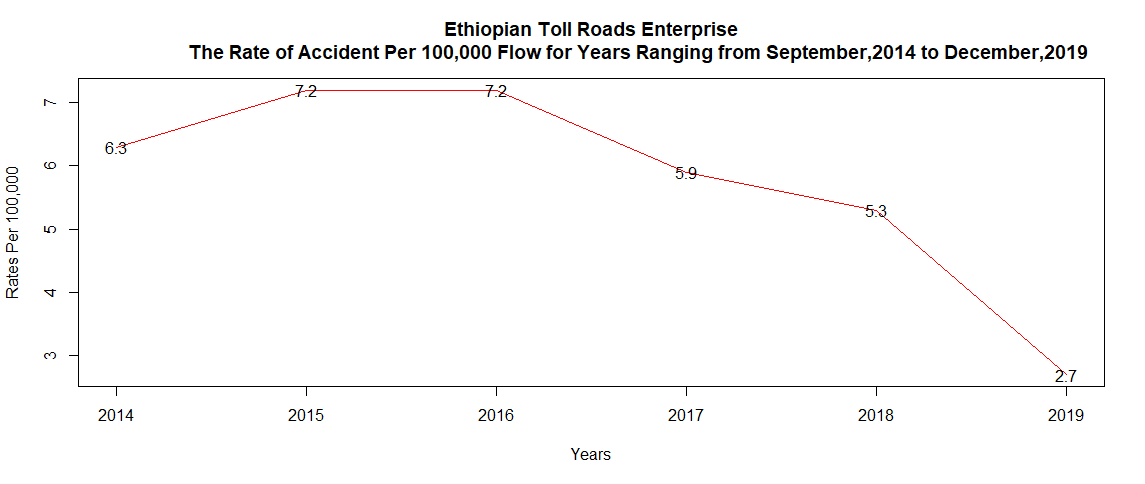
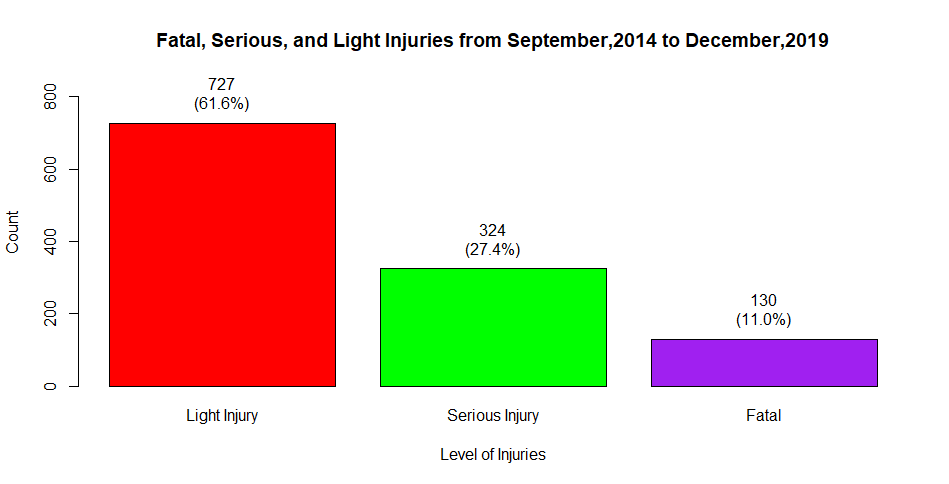
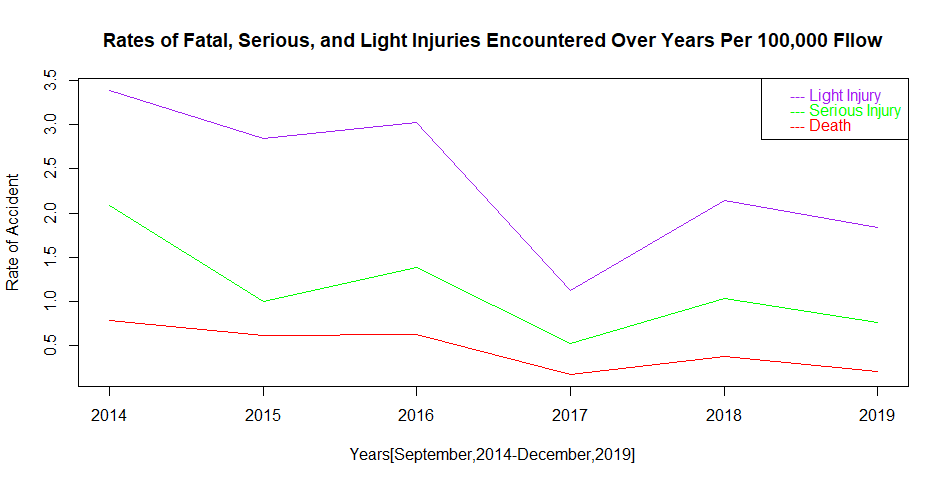
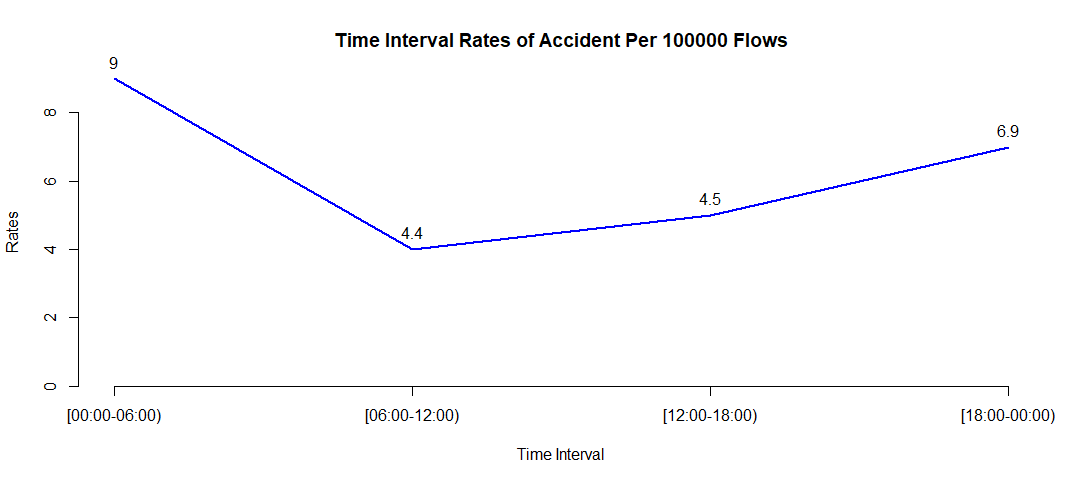
On the other hand, the average yearly changes in accident is approximately 2%. The level of accident began to decrease from 2018 forward [Figure S2]. Although the average absolute changes in accident was increasing, the rate of accidents per 100K flows was decreasing [Figure S3]. From 1824 traffic accidents, 1181(65%) of accidents caused various injuries. Among the casualties, (130)11% were dead and the remaining (324) 27% and (727) 62% suffered respectively from serious and light injuries [Figure S4]. According to [1], the rate of RTA-related injury was 163 (95% CI: 136–195) per 100,000 population. Not only the rates of accidents but also, the rates of injury levels were decreasing [Figure S5]. The rate of accident was higher at night than day times. There was 7 accidents per 100K flows at the early night and 9 at the late night. Lower rate (4 per 100K flows) observed before noon. The after noon takes the third place in which 5 accidents occurred in 100K flows [Figure S6]. However, according to [7, 5, 6], the absolute magnitude of accidents is higher in the afternoon. This study also confirmed the same regarding the absolute number of accidents but different relative to the number of traffic flows. The number of accidents depends on the number of traffic flows [6]. Therefore, regardless of the manner of interpretations, indications of results of the studies coincide.
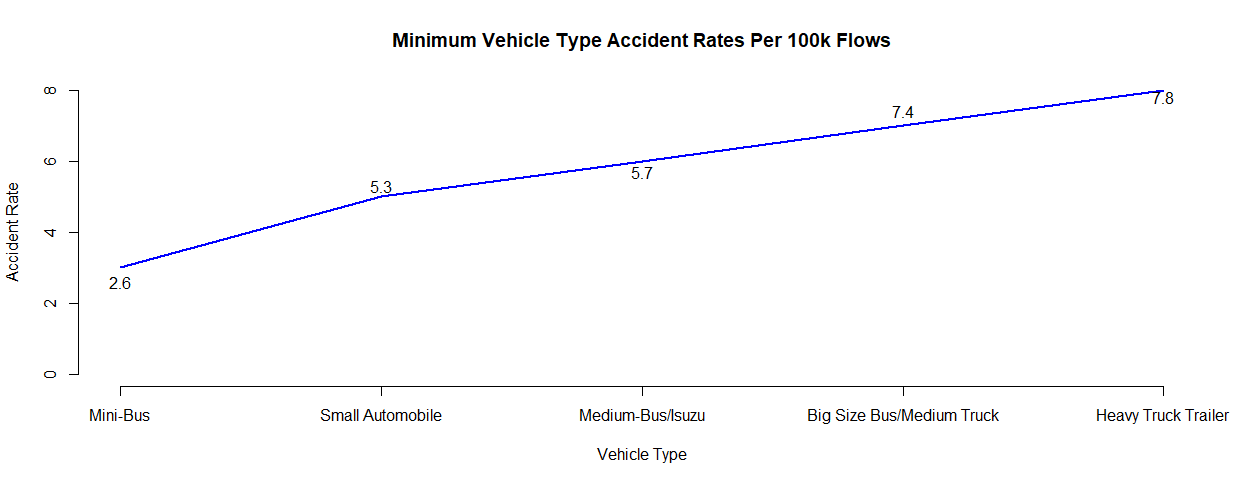
In 100K flows of heavy vehicles, there were 8 accidents. On the other hand, mini sized buses were less exposed than automobiles [Figure S7]. However, in absolute count automobiles were most frequent in both flow and accidents [5].
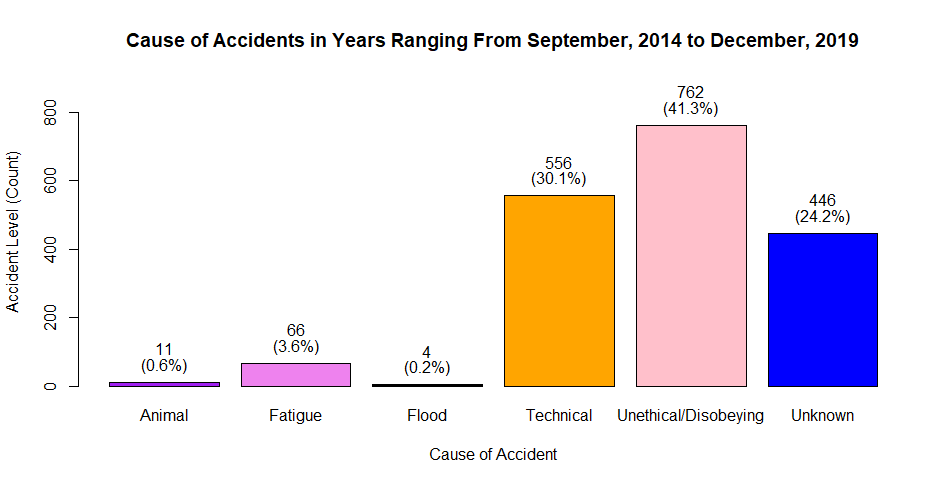
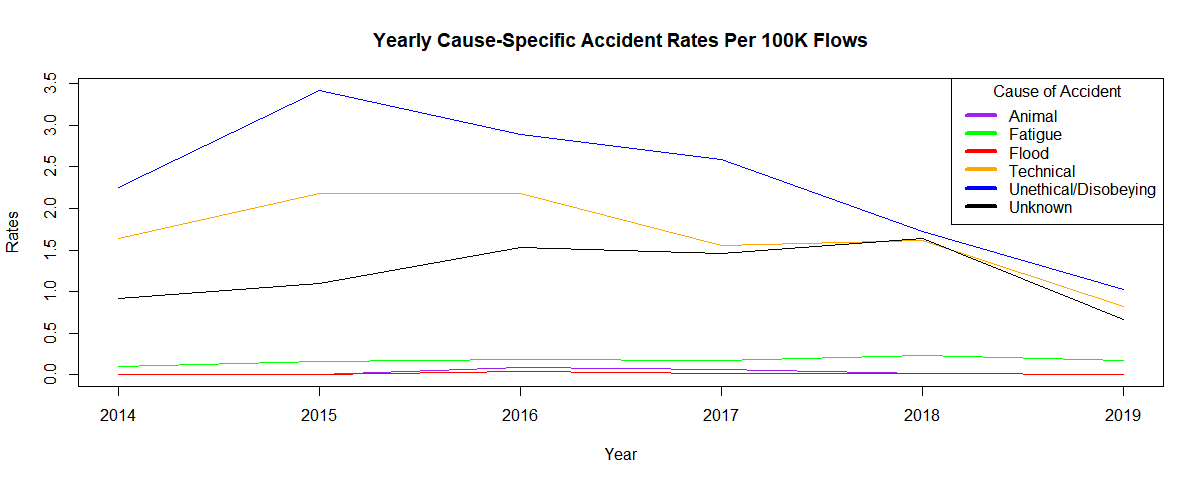
Unethical driving/disobeying road traffic rules is another issue which accounted for 41% of accidents. Speed related issue is one of unethical driving. Speed changes also affect the occurrence of accidents [8]. A study also confirmed that major causes of traffic accidents were associated with unethical driving behaviors that caused 59.8% of the total accidents [5]. Another 30% caused from technical problems on vehicles, 4% from fatigue, approximately 1% because of animals, and only small portion 0.2% of the accident was caused from flood. The reasons for the remaining 24% of accidents were unspecified [Figure S8].
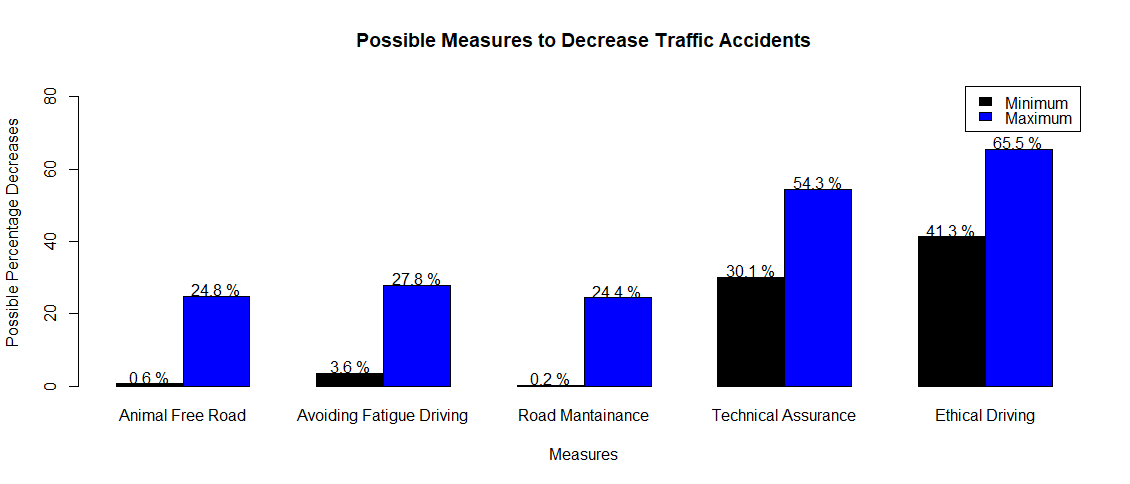
Despite the small percentage, the rate of driving without resting enough was increasing [Figure S9]. If animal intrusion, fatigue driving, flood, vehicles’ technical problem, and unethical driving were the only factors contributing to the occurrence of accident, avoiding animal intrusion decreases accidents at least by 1% [Figure S10]. It will decrease at most by 25% if all of the 24% unknown causes in [Figure S9] were animals. Similarly, ethical driving, technical assurance, road maintenance, and avoiding restless driving result in (41%-66%), (30%-54%), (0%-24%), and (4%-28%) minimum and maximum decreases in accidents respectively [Figure S10].
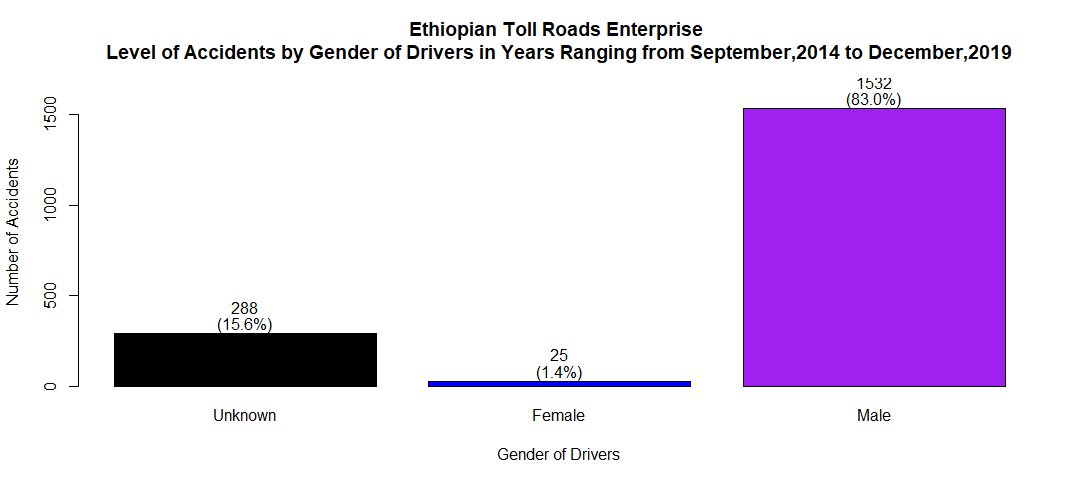
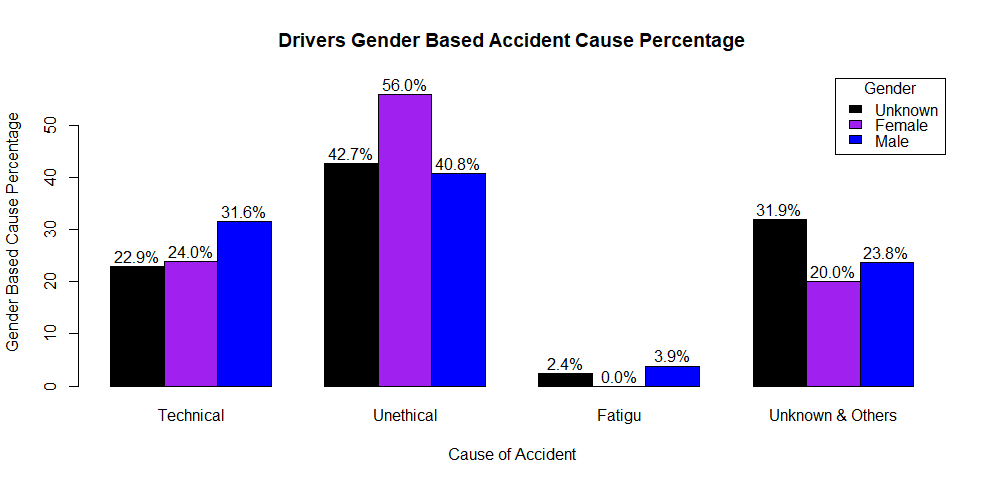
Approximately, only 1% were female drivers and 83% were males. The remaining 16% were unspecified [Figure S11]. Although females were small in number, the percentage of females driving unethical was greater than that of males [Figure S12].
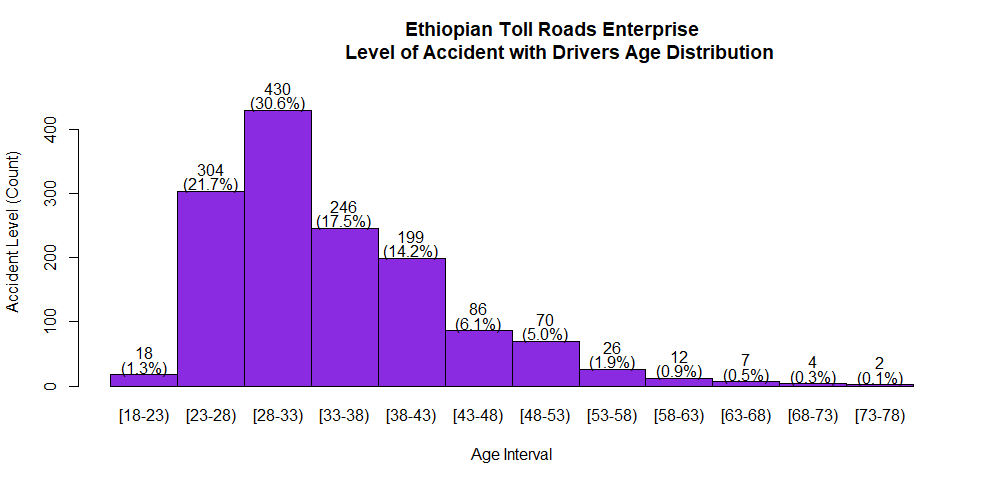
Most of the accidents were associated with drivers of young age [Figure S13]. This indicates that traffic accident affected productive man power of the country [1].
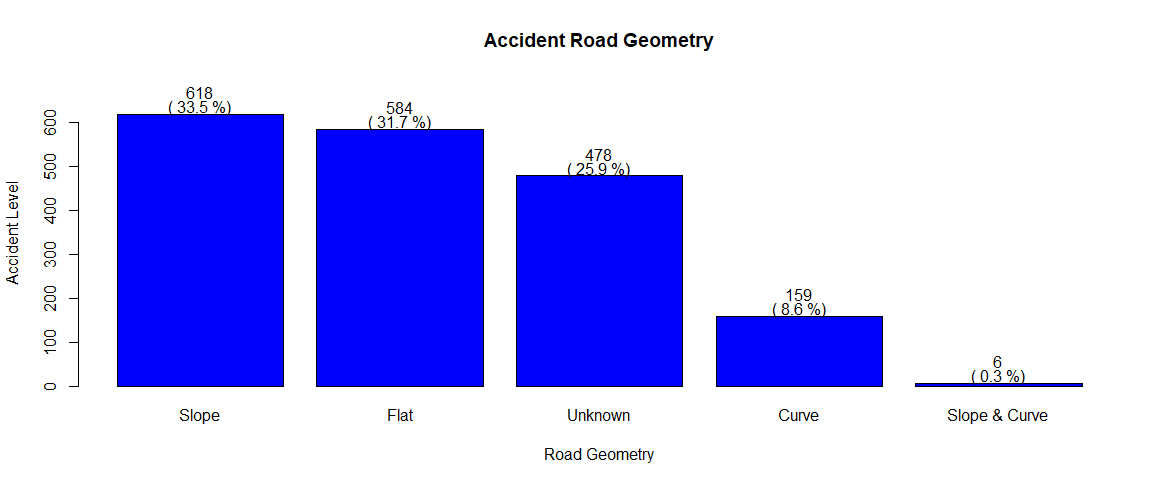
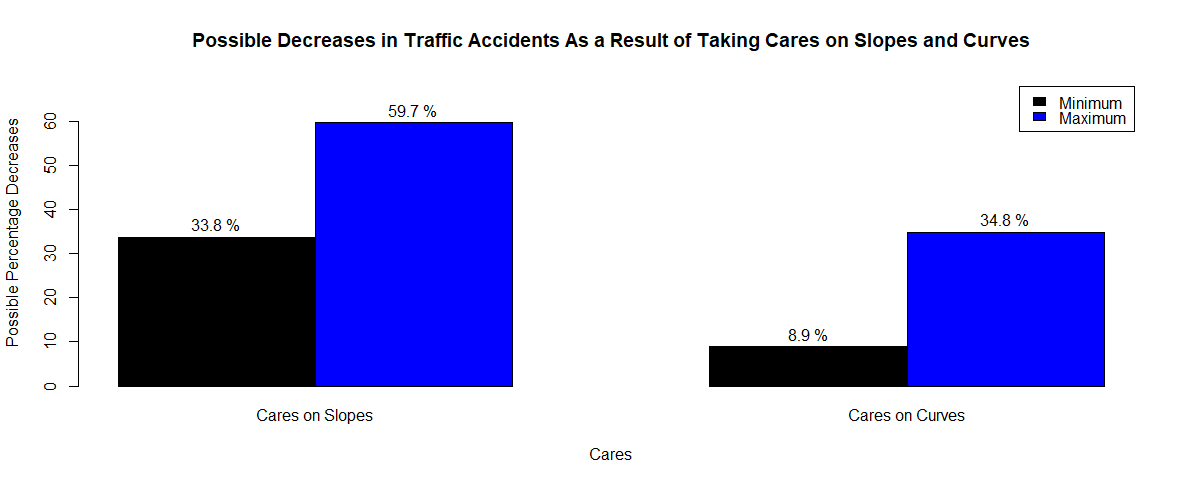
Most (34%) of the accidents occurred on sloppy road [Figure S14]. If the only factor contributing to the occurrence of accidents was road geometry, taking the most care at slopes and curves would reduce at least 9%-35% of the accidents [Figure S15].
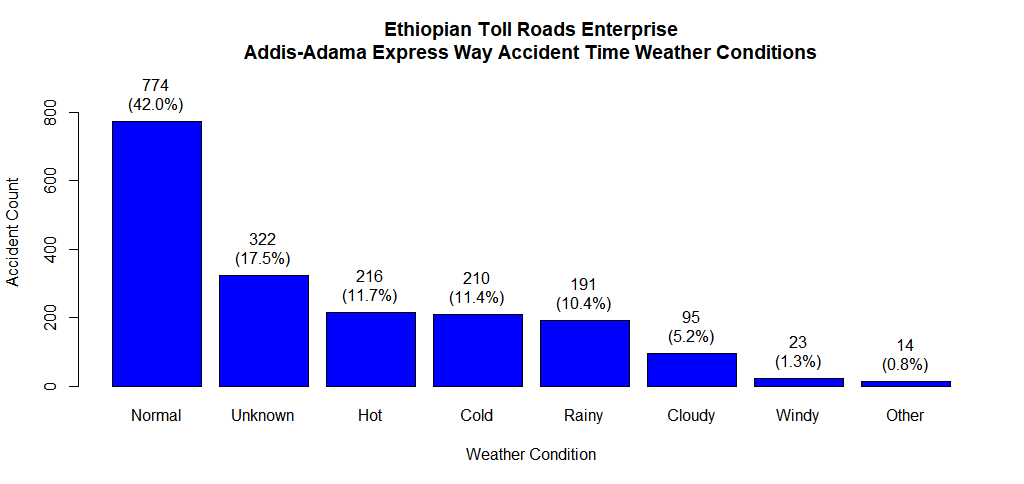
The longest duration throughout the year is normal in Ethiopia. Thus, our assessment on weather conditions revealed that larger percentage of accidents occurred at normal weather condition [Figure S16].
Estimates of NBR Model Parameters
We tested the presence of over dispersion in the data. The estimate of the dispersion parameter was 3.33238 which clearly greater than the null value 1. The corresponding Z-value was 3.7485 that resulted in a P-value of 0.00008896 which is far lower than the level of significance (0.05) [Table 1]. Thus, we rejected the null hypothesis that states the dispersion is 1 and concluded that there is over-dispersion in the data at 5% level of significance and the NBR model is more appropriate fit to the data than Poisson regression model.
Table 1: Over-dispersion test
|
Estimate of Dispersion
|
Z
|
P-Value
|
|
3.33238
|
3.7485
|
8.896e-05
|
We tested all attributes in the dataset for significance. We found that vehicle type, vehicle ownership, weather condition, driver-vehicle relation, drivers’ education level, and drivers’ age were significant determinants of number of injuries [Table 2].
Table 2: Parameter estimates of NBR model
|
Factors
|
Categories
|
Estimates
|
SE
|
Pr(>|z|)
|
|
|
Intercept
|
-2.511
|
1.061104
|
0.0179
|
|
Vehicle Type (Ref: Unspecified)
|
Big Size Bus & Medium Truck (3Axel)
|
1.293
|
1.052125
|
0.2189
|
|
Heavy Truck Trailer(>=4Axel)
|
1.386
|
1.046614
|
0.1854
|
|
Medium Bus & Small Truck (2 Axel)
|
2.346
|
1.037234
|
0.0237
|
|
Minibus
|
3.613
|
1.041141
|
0.0005
|
|
Small Automobiles &4WD
|
2.074
|
1.034441
|
0.0449
|
|
Vehicle Ownership (Ref: Company)
|
Government
|
0.009
|
0.350768
|
0.9806
|
|
Private
|
0.499
|
0.230324
|
0.0303
|
|
Unspecified
|
0.242
|
0.250862
|
0.3348
|
|
Weather Condition (Ref: Cloudy/Misty)
|
Hot
|
0.457
|
0.181940
|
0.0120
|
|
Normal
|
0.078
|
0.137193
|
0.5676
|
|
Unspecified
|
-0.365
|
0.174080
|
0.0359
|
|
Windy
|
0.172
|
0.505791
|
0.7340
|
|
Driver-Vehicle Relation (Ref: Unspecified)
|
Employee
|
-0.500
|
0.180237
|
0.0056
|
|
Other
|
-0.285
|
0.234047
|
0.2237
|
|
Owner
|
-0.607
|
0.209179
|
0.0037
|
|
Drivers’ Level of Education (Ref: Unspecified)
|
Above Secondary
|
-0.855
|
0.203963
|
2.78e-05
|
|
Primary
|
-0.790
|
0.252983
|
0.0018
|
|
Secondary
|
-0.490
|
0.176849
|
0.0056
|
|
Driver Age (Ref:Unspecified)
|
[18-23)
|
-1.193
|
0.694820
|
0.0860
|
|
[23-28)
|
-0.496
|
0.200207
|
0.0133
|
|
[28-33)
|
-0.149
|
0.179081
|
0.4070
|
|
[33-38)
|
-0.475
|
0.208279
|
0.0227
|
|
[38-43)
|
-0.417
|
0.219141
|
0.0571
|
|
>=43
|
-0.169
|
0.219206
|
0.4401
|
Ref: Reference, Pr: Probability, SE: Standard Error
The number of injuries occurred in association with small automobiles & 4WD, min-buses, and medium sized buses & small trucks (2 axel) were significantly different from that of unspecified vehicle types. On the other hand, injuries as a result of heavy truck trailers (>= 4 axel), and big sized buses & medium trucks (3 axel) were not significantly different from the reference category. Thus, accident on small automobiles & 4WD, min-buses, and medium sized buses & small trucks (2 axel) resulted in significantly different number of injuries from accident on heavy truck trailers (>=4 axel), and big sized buses & medium trucks (3 axel) and it increases the log of average number of injuries by 2.074, 3.613, and 2.346 respectively as compared to accident in unspecified vehicle types holding the effects of other factors constant at 5% level of significance [Table 2]. The significance of vehicle type was confirmed in other study [5].
In the same manner of interpretation, the log of average number of injuries due to accidents on vehicles with private ownership significantly increases by 0.499 as compared to that of vehicles with company ownership. Accidents on vehicles of government and unspecified ownership were not significantly different from vehicles of company ownership. Hot weather condition results in 0.457 increase. The log average number of injuries decrease more (by 0.607) when the driver is owner of the vehicle. Drivers’ level of education significantly contributes to the number of injuries in accidents. Drivers’ age intervals [23-28) and [33-38) were more likely associated with reduced number of injuries [Table 2].
