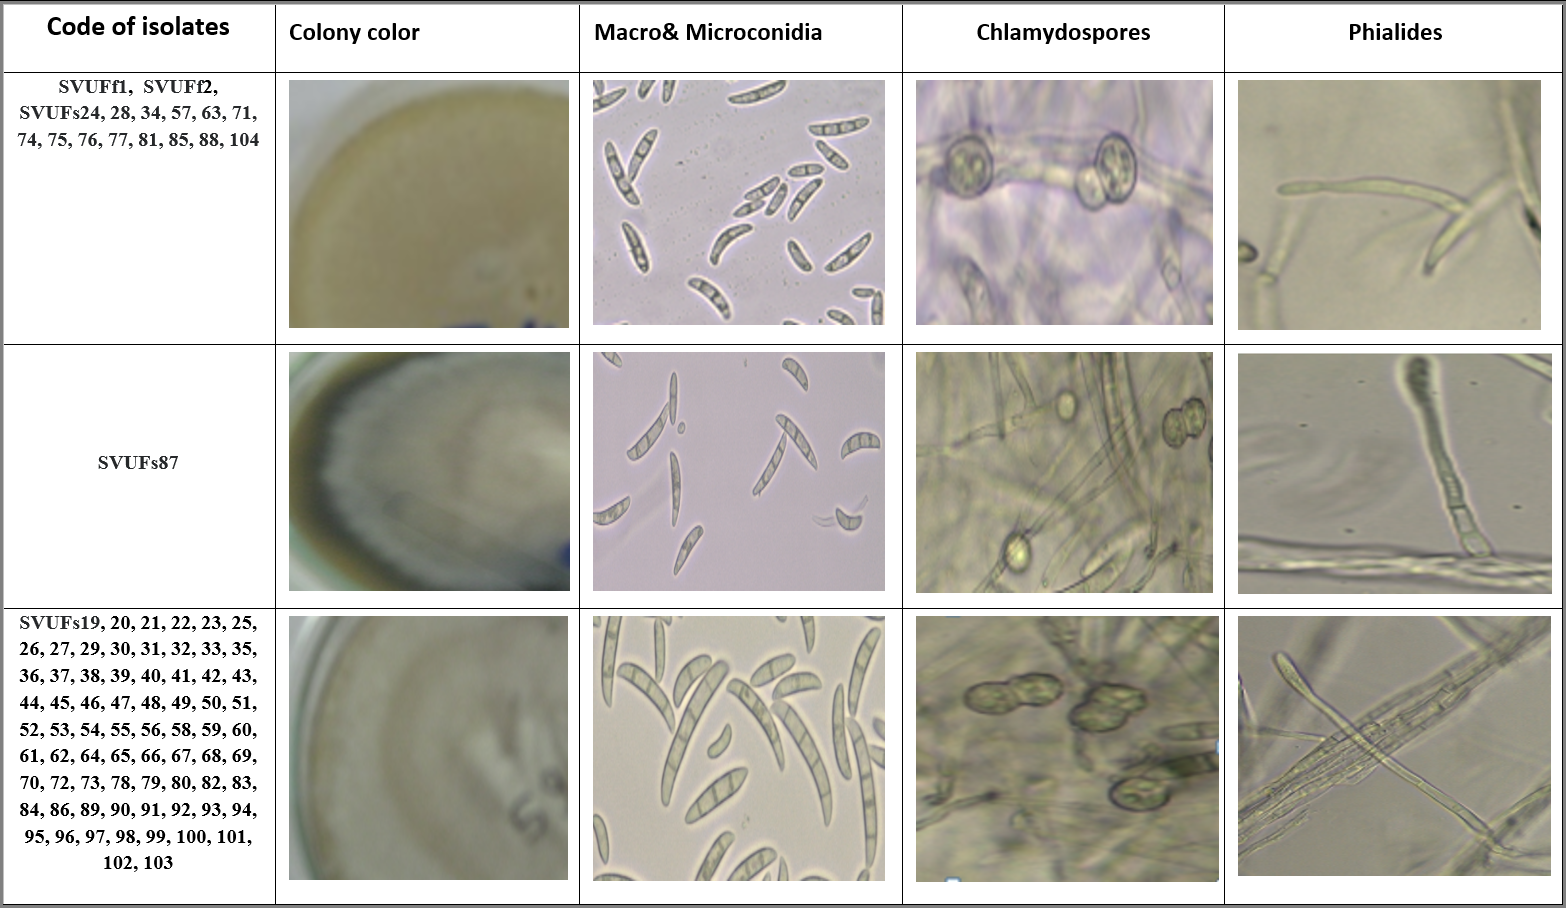
Morphological characterization of F. solani species complex
187 isolates of Fusarium solani were examined microscopically (Table 1). On PDA medium, aerial mycelia of all isolates were white at the initial stage, while the colonies became off-white, violet, purple and gray in the later stages. Single isolates of F. solani produced oval to kidney shape, microconidia measuring 9.7-23.4 x 2.9-5.6 μm. Macroconidia had 3-5 septa ranging 28.5-50.6 x 3.1-6.2 μm (Table 2& 3). On the same medium, chlamydospores were observed that appeared singly or in pairs and conidiophores were long monophialides.
The hierarchical analysis according to morphological characters of FSSC
The dendrogram was generated from 88 FSSC, the first group (16 strains) and the second group (72 strains) according to morphological properties (Figure 1).
From the hierarchical analysis, (Figure 1) the isolates which had the same morphological properties were clustered together. The dendrogram divided into two clades.
The first clade comprised SVUFf1, SVUFf2, SVUFs24, 28, 34, 57, 63, 71, 74, 75, 76, 77, 81, 85, 88 and 104, these isolates had the same colony color (Off-white to pale cream) and the shape of macroconidia are falcate shape with pointed apexes. The second clade included two sub-clades, the first sub-clade comprised 1 isolate of SVUFs87, this isolate was shorter than isolates in this clade and the second sub-clade comprised 71 isolates (SVUFs19, 20, 21, 22, 23, 25, 26, 27, 29, 30, 31, 32, 33, 35, 36, 37, 38, 39, 40, 41, 42, 43, 44, 45, 46, 47, 48, 49, 50, 51, 52, 53, 54, 55, 56, 58, 59, 60, 61, 62, 64, 65, 66, 67, 68, 69, 70, 72, 73, 78, 79, 80, 82, 83, 84, 86, 89, 90, 91, 92, 93, 94, 95, 96, 97, 98, 99, 100, 101, 102 and 103), these isolates had long macroconidia with fusiform and thick wall (the apical cell was blunt while the basal cell was foot-shaped) (Figure 1) (Table 2).
Molecular characterization of Fusarium solani by amplification of β-tubulin and TEF-1α genes
To confirm the morphological identification of the studied isolates, molecular analyses were performed. β-tubulin was successfully amplified from 88 isolates of Fusarium solani species complex recovered from potato tubers samples. A single band of 350 bp was obtained by Bt2a and Bt2b primer pairs (Figure 2). Translation elongation factor-1α (TEF-1α) was also successfully amplified from 83 Fusarium solani isolates and five Fusarium solani isolates (SVUFf1, SVUFf2, SVUFs44, SVUFs86 and SVUFs90) have short sequence by TEF-1α gene, so didn’t show in Phylogenetic analysis. A single band of 700 bp was obtained using EF1 and EF2 primer pairs (Figure 3). All the sequences of β-tubulin and TEF-1α were deposited in the GenBank and their accession numbers were indicated in Figure (4) and (5). The β-tubulin and TEF-1α sequences of Fusarium solani isolates were subjected to GenBank database using BLAST search and the results were recorded as the most closely related sequences with high percentage of homology. TEF-1α showed the highly resolution comparable to β- tubulin in identification of Fusarium solani species complex
Mega Blast analyses of the 2X consensus nucleotide sequence of β-tubulin and TEF-1α gene showed 99-100% similarity with several Fusarium species sequences of the same region deposited in GenBank. Neighbor joining tree using Mega 6 was used to study genetic relatedness of Fusarium strains (Figures 4 and 5).
β- tubulin dataset of F. solani species complex (88 F. solani) from the current study and 7 GenBank sequences (Figure 4). The phylogenic tree (Figure 4) revealed that, the strains of F. solani species complex were categorized into 3 clades. Phylogenetic analysis of this dataset resulted in the F. solani species complex clustered together in one cluster to the exclusion of out-group taxa.
SVUFs87 (F. solani) was found to be at a separate branch. The first and second clade isolates were closer to each other than the remaining clades with strong support 92% bootstrap value. SVUFf1 and SVUFf2 (F. falciforme), SVUFs 24, 28, 34, 53, 57, 59, 71, 74, 75, 76, 77, 81, 85, 88 and SVUFs104 (F. solani) clustered together with Fusarium falciforme (KY776685 and KY776684) in the first clade. Strains in this clade have the same morphological characters except isolates (SVUs53 and SVUs59), but all strains in this clade have morphological characters different from other Fusarium solani species complex in macroconidia, which was shorter than Fusarium solani species complex and these isolates gave the same results in the pathogenicity test (lesion sizes 10:16mm) and α-amylase production (level of this isolates less than ≤10 mm). The second clade comprised SVUFs102 of F. solani species complex. The third clade was divided into sub clades A, B, C and D. In the sub-clade A, SVUFs52 Fusarium solani was a base for all other Fusarium solani species complex presented in the third clade. Sub-clade B consisted from 2 strains (SVUFs62 and SVUFs72) of Fusarium solani species complex, which clustered together in one clade. Sub-clade C included strains of SVUFs91, 92, 93, 94, 95, 97, 98 and 101, these eight isolates considered as F. solani species complex. Sub-clade D included SVUs19, 20, 21, 22, 23, 25, 26, 27, 29, 30, 31, 32, 33, 35, 36, 37, 38, 39, 40, 41, 42, 43, 44, 45, 46, 47, 48, 49, 50, 51, 54, 55, 56, 58, 60, 61, 62, 63, 64, 65, 66, 67, 68, 69, 70, 73, 78, 79, 80, 82, 83, 84, 86, 89, 90, 96, 99 and 103 strains forming distinct clade with different F. solani species complex sequences (MF662654, KU938965, KT374270, KU938962 and KU938955), which were obtained from NCBI.
Phylogenetic analysis was done by TEF-1α sequences for the 83 strains of F. solani species complex under study along with 5 GenBank sequences (Figure 5). In addition to the out group sequence Acremonium sclerotigenum (KT878381). The phylogenetic tree revealed that, the tested strains could be categorized into six clades (Figure 5).
First clade comprised 2 isolates (SVUFs37and 84) of F. solani, which grouped together with F. solani MG252286. Second clade includes strains (SVUFs82, 91 and 93); these three isolates were F. solani. First clade and second clade were found to be at the base of the tree. Third clade SVUFs 39 and SVUFs72 (F. solani) clustered together in one clade with 64% bootstrap value. Fourth clade consisted from 14 strains (SVUFs24, 28, 34, 57, 63, 71, 74, 75, 76, 77, 81, 85, 88 and 104) closely related to Fusarium falciforme MH463544. Isolates in this clade have the same morphological characters and also showed the same results in the pathogenicity test (lesion sizes 10:16mm) and α-amylase production (levels of these isolates less than ≤10 mm). Isolates in this clade were previously explained that they had morphological characters different from other Fusarium solani species complex in macroconidia, which was the shortest. The tree showed a well-supported relationship (99% bootstrap) between F. keratoplasticum (KC808192), which was achieved from GenBank and isolate (SVUFs87) in fifth clade. Isolate in this clade was the same isolate (Figure 4), which was represented as a separate branch in β- tubulin phylogenetic tree (Figure 4), so it was presented in a separate group at the base of the tree (Figure 4); isolate SVUFs87 was morphologically similar with other F. solani isolates. However, the TEF-1α gene sequence of SVUFs87 was different from another F. solani isolates and was classified as F. keratoplasticum. The latter was considered partially different genetically from most F. solani species, but basically similar in terms of biological characters. The sixth clade F. solani (SVUFs19, 20, 21, 22, 23, 25, 26, 27, 29, 30, 31, 32, 33, 35, 36, 38, 40, 41, 42, 43,, 45, 46, 47, 48, 49, 50, 51, 52, 53, 54, 55, 56, 58, 59, 60, 61, 62, 64, 65, 66, 67, 68, 69, 70, 73, 78, 79, 80, 83, 89, 92, 94, 95, 96, 97, 98, 99, 100, 101, 102 and 103) grouped with the other Fusarium solani species complex (MH996883) that was obtained from GenBank.
Screening of Fusarium solani for α-amylase production
88 Fusarium solani isolates which were collected from potato tubers during this study were screened for production of α-amylase qualitative assay depending on color change of Iodine indicator from blue to colorless in culture of Fusarium solani. All results recorded in Figure 6 and 7, each sample was tested in three replicates.
It was observed that all Fusarium strains produced α-amylase and production was more than ≥ 9 mm.
High levels of amylase (≥ 15 mm) were produced by isolates of Fusarium solani SVUFs73, SVUFs93, SVUFs96 and SVUFs97.
Others isolates of Fusarium solani produced α-amylase at levels ranging from 11–14 mm. These isolates were belonging to F. solani species complex SVUFs20, 21, 23, 25, 26, 32, 35, 39, 42, 45, 47, 49, 50, 54, 56, 58, 59, 61, 62, 65, 66, 69, 89, 90 and 91 (Figure 6).
Low levels of α-amylase (≤10 mm) were produced by others isolates of F. solani species complex (SVUFf1, SVUFf2, SVUFs19, 22, 24, 27, 28, 29, 30, 31, 33,34, 36, 37, 38, 40, 41, 43, 44, 46, 48, 51, 52, 53, 55, 57, 60, 63, 64, 67, 68, 70, 71, 72, 74, 75, 76, 77, 78, 79, 80, 81, 82, 83, 84, 85, 86, 87, 88, 92, 94, 98, 99, 100, 101 and 103) (Figure 6).
Pathogenicity of Fusarium solani
Fusarium solani were evaluated for their pathogenicity on healthy potato tubers. Measurements consisted into measuring the lesion’s size in the pathogenicity test. Lesion sizes were completely variable and ranged from 0.0 mm to 35 mm (Figure 6). Lesion size less than 10 mm wasn’t pathogenic to potato tubers. The results of the pathogenicity test revealed that 88 isolates caused discoloration, necrosis and lesion of the tubers. Of the 88 isolates with putative dry rot symptom.
Tubers inoculated with F. solani SVUFs73 showed a mean lesion size of 32.7 mm, the highest average lesion size among all tested isolates Figure 6 and 8. Fusarium solani SVUFs73 showed higher pathogenicity effect than other isolates, based on average lesion sizes (Figure 8).
On the other hand, no differences were observed between the four isolates of F. solani species complex (SVUFs93, 96, 97 and 102), which showed a similar lesion size (22.7) mm (Figure 8).
Tubers inoculated with isolates F. solani species complex isolates (SVUFf1, SVUFf2, SVUFs19, 22, 23, 24, 27, 28, 29, 30, 31, 33,34, 36, 37, 38, 40, 41, 43, 44, 46, 48, 51, 52, 53, 55, 57, 59, 60, 63, 64, 67, 68, 70, 71, 72, 74, 75, 76, 77, 78, 79, 80, 81, 82, 83, 84, 85, 86, 87, 88, 92, 94, 98, 99, 101, 103 and 104) were pathogenic to inoculated potato tubers and caused lesions of 10:16 mm (Figure 8).