Study Sample and Demographic Data
If the confidence level and intervals are set at 0.05 and ±5% and applies to the population of 300 novice nurses (about 30% of nurses in hospitals are N0 and N1 in the nursing hierarchy [18]) in a hospital, 169 participants are required to fulfill adequate sample size [19,20]. We estimated the rate of refusal to respond to be around 40%. Therefore, the minimum number of participants for this study will be 282 (169/[1–0.4]).
In October 2018, we delivered 300 copies each to six medical centers in Taiwan, inviting novice nurses(i.e., nurse hierarchy at N0 and N1 only) to complete the 100-item questionnaires(Figure 1 and Additional File1) related to NIQJ[10-13]. A total of 1,104 nurses participated, with a return rate of 61.3% (Additional File2).
This study was approved and monitored by the NCKU Hospital institutional review board (06476734). All hospital and participants’ identifiers were stripped.
Featured Variables
Featured variables were extracted from these 100-item questionnaires using logistic regression with Type error set at 0.05, where the dependent variable(NIQJ as 1 and Non- NIQJ as 0) was determined by k-mean clustering method[21] on the summation scores of NIQJ(Figure 1).
Four scenarios and two models
Model accuracy(e.g.,>0.7) and stability(or, say, generatlization) (e.g. discrepancy between training and testing sets) were focused on out of various facets like model feasibility, efficacy, and efficiency. Firstly, the 1,104 participants were split into training and testing sets in a proportion of 70% to 30%, where the former was used to predict the latter. Four scenarios consisting two training and two testing sets derived from such grouping ratio: Total cases (n=1104) as a training set, its corresponding testing set (n=300), another training sets using 70% of participants (n=804), and its corresponding testing set (n=300). The higher and lower summation scores of NIQJ were used in the training sets, while the middle summation scores of NIQJ were used in the testing sets. Secondly, the accuracy (e.g., sensitivity, specificity, area under the receiver operating characteristic curve, AUC) and stability(or, generalization) ( (e.g., using the training set to predict the testing set) were verified. The data is shown in Multimedia Appendix 2.
The ANN and convolutional neural network (CNN) were analyzed with the four scenarios mentioned above. CNN has traditionally been performed on Microsoft (MS) Excel[18, 20,22] while ANN has not been paired along with MS Excel in the past. As demonstrated in figure 2 below, the ANN process involves data input in layer 1 where the data joined with two types of parameters and run through the sigmoid function algorithms in layers 2 and 3. Finally, as shown on the right side and bottom of figure 2, the prediction model was deemed complete when the total residuals were minimized through the MS Excel function of sumxmy2 and solver add-in.
Tasks for Performing ANN and CNN
Task 1: Comparison of Accuracies on Two Models and Stability across Four Scenarios
The accuracy was determined by observing the higher indicators of sensitivity, specificity, precision, F1 score, accuracy, and AUC in both models. The definitions are listed below:
True positive (TP)=the number of predicted NIQJ to the true NIQJ, (1)
True negative (TN)= the number of predicted Non-NIQJ to the true Non-NIQJ, (2)
False-positive (FP)= the number of Non-NIQJ minuses TN, (3)
False-negative (FN)= the number of NIQJ minuses TP, (4)
Sensitivity = true positive rate (TPR)=TP(TP+FN), (5)
Specificity= true negative rate (TNR)=TN(TN+FP), (6)
Precision= positive predictive value (PPV)=TP(TP+FP), (7)
F1 score=2(8)
ACC= accuracy=(TP+TN) N, (9)
N=TP+TN+FP+FN, (10)
AUC=(1- Specificity)SensitivitySpecificity, (11)
SE for AUC==, (12)
95%CI=AUC ± 1.96, (13)
The stability was determined by observing the AUC changes in both training and testing sets. The fewer AUC changes in a prediction model imply better stability. Comparisons of AUCs across four scenarios were made in both ANN and CNN models.
Task 2: App Developed for Predicting NIQJ
A self-assessment app using participant mobile phones was designed to predict NIQJ using the ANN(or CNN) algorithm with the model parameters. The result is shown as classification then appears on smartphones. The visual representation with binary (NIQJ and Non-NIQJ) category probabilities is shown on a dashboard using Google Maps.
Statistical Tools and Data Analysis
IBM SPSS Statistics 22.0 for Windows (SPSS Inc) and MedCalc 9.5.0.0 for Windows (MedCalc Software) were used to perform descriptive statistics, frequency distributions among groups, logistic regression analyses, and the computation of model prediction indicators mentioned in Eqs 1 to 13. The significant level of type I error was set at 0.05. ANN and CNN were performed on MS Excel (Microsoft Corp).
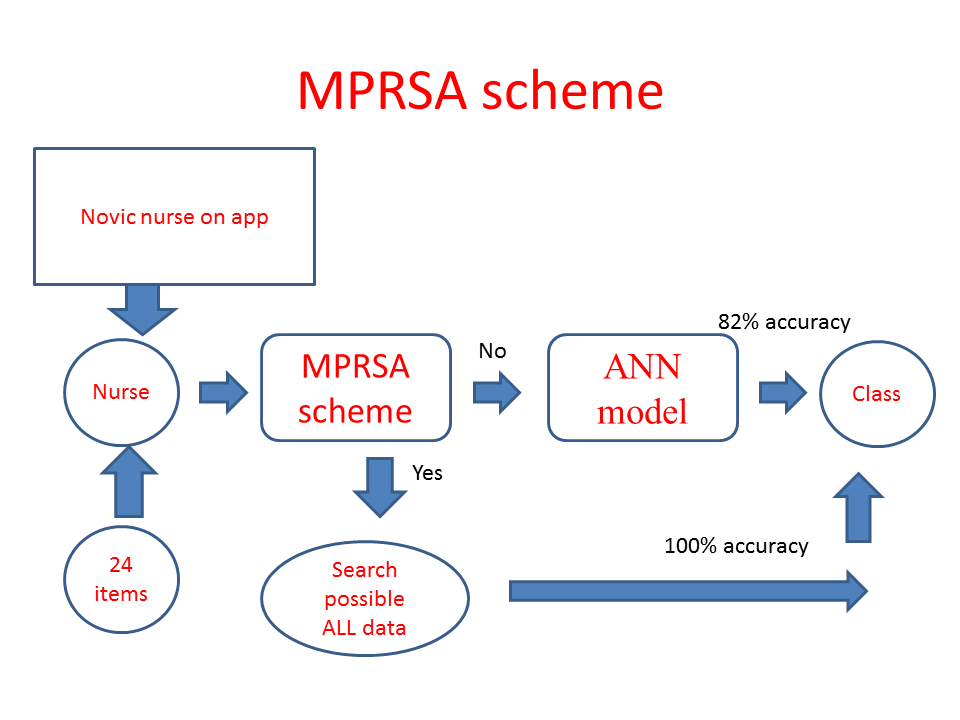
A visual representation of the classification was plotted using two curves based on the Rasch model [23]. The study flowchart and the ANN modeling process are shown in Figure 3 and Multimedia Appendix 3, respectively.