2.1. Study design and participants
We conducted a nested case-control study of the association between air pollution and dry eye disease (DED) at 17-20 years of age from He University students. He University is the third largest private medical college in China with an undergraduate population of 8,412 (regular) from 23 provinces in China, which is located in the beautiful Qipanshan forest scenic area of Shenyang, with the best air quality all year round (PM2.5: 4μg/m3, PM10: 14μg/m3, O3: 42μg/m3, SO2: 10μg/m3, CO: 0.6μg/m3 and NO2: 15μg/m3). Since 2017, we have conducted a long-term study of He Eye Health (HEH) screening among freshmen enrolled once a year. The diagnostic check of study was conducted by expert physicians. All protocols were approved by the medical ethics committee of He University [Approval number: IRB (2017) K004.01], and were in accordance with the World Medical Association Declaration of Helsinki-Ethical Principles for Medical Research Involving Human Subjects. Due to a continuing 2019-nCoV epidemic threat of novel coronaviruses, all students were forced to go home on holiday from January to July in 2020, and could not leave their respective communities under the control of the government. Until August 2020, most students were allowed to return to university. Thus, these students were exposed to air pollution from January to July in 2020, in their respective fixed areas.
We included students who lived in Liaoning and had no DED from the HEH screening visit in September 2019. We excluded students who had positive history of smoking, refractive surgery or contact lens wear, who used systemic medication, such as antianxiety, antidepressive, and antihypertensive medications. The enrolled students (n = 6407) read and signed an information and consent form before participating in this study, and attended the physical examination and completed the symptom questionnaires of the demographic information and daily custom, Qi stagnation and Ocular Surface Disease Index (OSDI). Then, we recruited 576 participants with DED (cases) and 576 without DED (controls) from 6407 students. Cases had to have at least two of the the following three signs in at least one eye: a) corneal fluorescein staining (CFS), b) tear break-up time (TBUT), c) Schirmer’s test with anesthesia. Cases included all patients newly diagnosed with active DED. Controls were selected from enrolled students without DED, were matched to cases (1:1) by age and sex. Individual air pollution exposure of participants (n = 1152) was estimated using the measurements from the municipal air monitoring station, which was located 1000 meters from each participant’s home.
2.2. Stagnant qi
The the enrolled students (n = 6407) with the Stagnant qi or Balanced constitutions were chosen through completion of a standardised questionnaire according to the constitution classification criteria (Table 1) confirmed by the Chinese Association of TCM. Then, based on Classification standard of TCM Constitution (ZZYXH/T157-2005) [15, 17-19], the Stagnant qi or Balanced constitutions were diagnosed by TCM doctors through the method of observation, hearing and questioning (main symptoms: introverted and unstable, melancholy and fragile, sensitive and suspicious, poor ability to adapt to mental stimulation, usually melancholy face, look more bored and unhappy; auxiliary symptoms: chest and hypochondriac fullness, or running pain, often accompanied by sigh, or belching hiccup, or pharyngeal foreign body sensation, or breast swelling pain, poor sleep, loss of appetite, palpitation, palpitation, forgetfulness, phlegm, more dry stool, normal urination, reddish tongue, thin white moss, fine pulse.)
2.3. Signs of DED
2.3.1. OSDI
The enrolled students (n = 6407) were chosen by using a score on OSDI confirmed by the Outcomes Research Group at Allergan Inc. (Irvin, California). The OSDI includes 12-items. Each item is scored on a scale from 0 to 4 (0 = none of the time, 1 = some of the time, 2 = half of the time, 3 = most of the time, 4 = all of the time). A score = [sum of the scores for all questions answered X 25] / total number of questions answered]. The scores indicate normal (scores 0-12), mild (13-22), moderate (23-32), and severe (33-100) DED.
2.3.2. CFS
CFS was measured by the National Eye Institute/Industry (NEI) grading scale as previously described [20]. The total CFS score ranges from 0 to 15, with higher scores indicating greater abnormality. The NEI grading scale consists of a grid that divides the corneal area into five sections, each of which is assigned a score between 0 and 3 depending of the amount and distribution of CFS.
2.3.3 TBUT
TBUT was performed using Lowther technique in each eye following a previous method [21]. A sterile fluorescein strip (Indicator, He eye Co., Shenyang, China) was moistened using nonpreserved saline. The time between a blink and the appearance of gaps in the tear film was tested in seconds. The time ranges from 0 to 7 seconds, with shorter times indicating greater abnormality.
2.3.4 Schirmer’s test
After TBUT, the participant waited for 30 min, then performed Schirmer’s test with anesthetic as previously described [22]. The Schirmer’s test is measuring the total tear secretion (basic and reflex) in each eye, ranging from 1 to 7 mm in 5 minutes . The length of wetting of paper strips placed in the inferior cul de sac of the lower eyelid, with shorter lengths indicating greater abnormality.
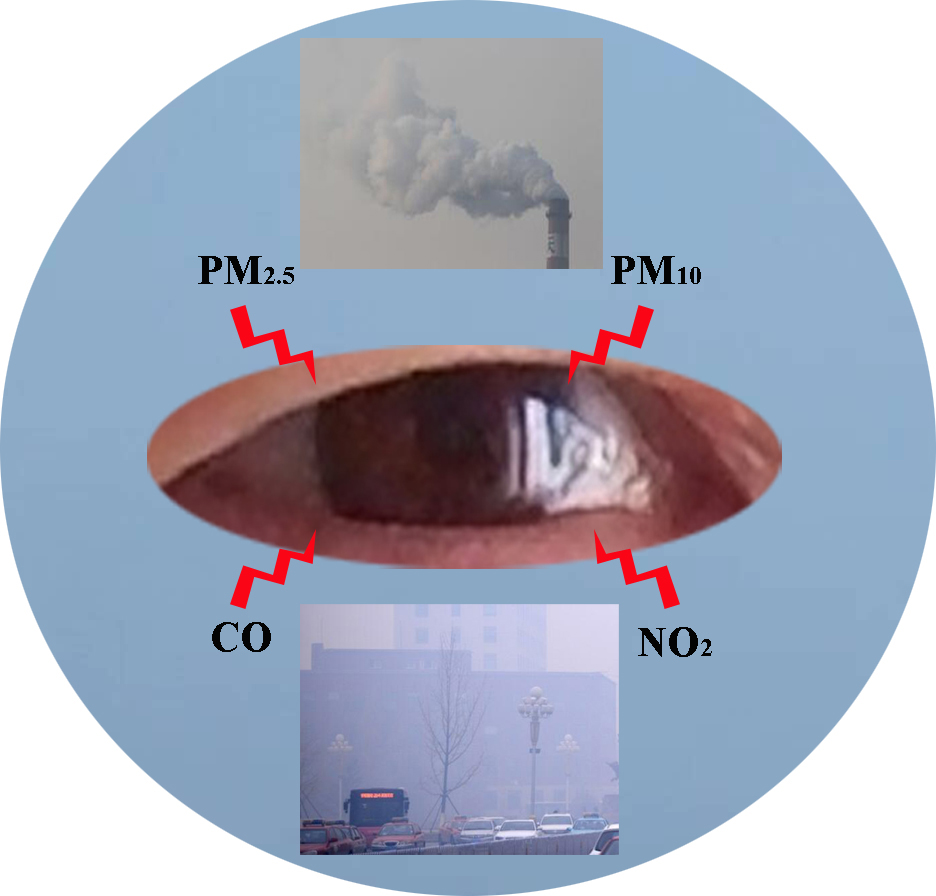
2.4. Exposure assessment
The average ambient concentrations of PM2.5, PM10, O3, SO2, CO and NO2 were obtained as previously described [23]. We obtained the average daily concentrations of these pollutants for each participant during seven months (from January 1, 2020 to July 31, 2020). The data were based on one of air pollution monitoring stations located within 1000 meters residence from each participant’s home, and obtained using air pollution monitoring stations from National Climate Center in Ministry of Ecology and Environment of China by the use of AirData (http://www.zhb.gov.cn/). We estimated the average daily exposure for usual residence of each study participant, and then added the data together to calculate the monthly mean concentrations of the aggregate exposures. In addition, we calculated average 8-hr concentrations of CO and O3 from these same monitors closest to each participant’s home address. Because the participants were in own closed communities, we ensured that these average values were available during this study period.
2.5 Confounders
We assessed potential individual-level confounders and effect measure modifiers, including demographics and socioeconomic characteristics (eg, age, sex, body-mass index, parents’ education level), lifestyle factors (eg, myopia, time spent squinting at computer and cell phone, sleep, humidity), and “constitution” (defined as the unique TCM entity exhibiting individual’s biological feature and clinical presentation). To explore the potential role of “Qi stagnation” in the association between air pollution and DED, this variable was constructed from both behavioural and temperamental information estimated.
2.6. Statistical analysis
We used Chi-square test to compare the frequencies of baseline characteristics to the status of participants with DED and controls, usedtwo-sample t-test to compare the values of OSDI score, corneal staining score, TBUT and the result on Schirmer’s test between two groups, and used 1:1 paired logistic models adjusting for all matching factors (age, and sex), to assess other influencing factors for the association between DED and each average air pollutant concentration (PM2.5, PM10, O3, SO2, CO and NO2) assigned to each participant for the 7 months before diagnosis (study entry) date. For ease of interpretation, the “Time” was recorded (1 = cases, 2 = age and gender-matched controls), and the “Status” was recorded [1 = case group (virtual censoring group), 0 = control group]. The paired pair number (“ID”) was selected into “Strata” list box, and the influencing factors were selected into “Covariates” list box. We selected exposure level below the 20th percentile as the referent category (baseline level) for each pollutant.
Potential confounders were based either on actual articles from the medical literature [11,24-26]. We assessed potential confounders using a > 10% change for these risk factors such as, body-mass index (BMI), time spent at computer or mobile phone, myopia, parental education level, sleep, humidity, which could potentially confound the relationship between air pollution and DED. There were no factors confounding the associations between air pollution and DED. Thus, the final analysis did not include the above factors. The matching factors were age and sex in this final model. Furthermore, we assessed potential effect modifier (constitution) using likelihood ratio tests (LRTs) [27]. If the LRT differed at a significance level of < 0.10, we considered effect modification to be present. The effect modifiers according with this criterion included constitution. Data were analyzed with the use of SPSS software for Windows, version 20.0 (IBM SPSS, Inc., Chicago, IL).