Acquisition of lncRNA expression datasets
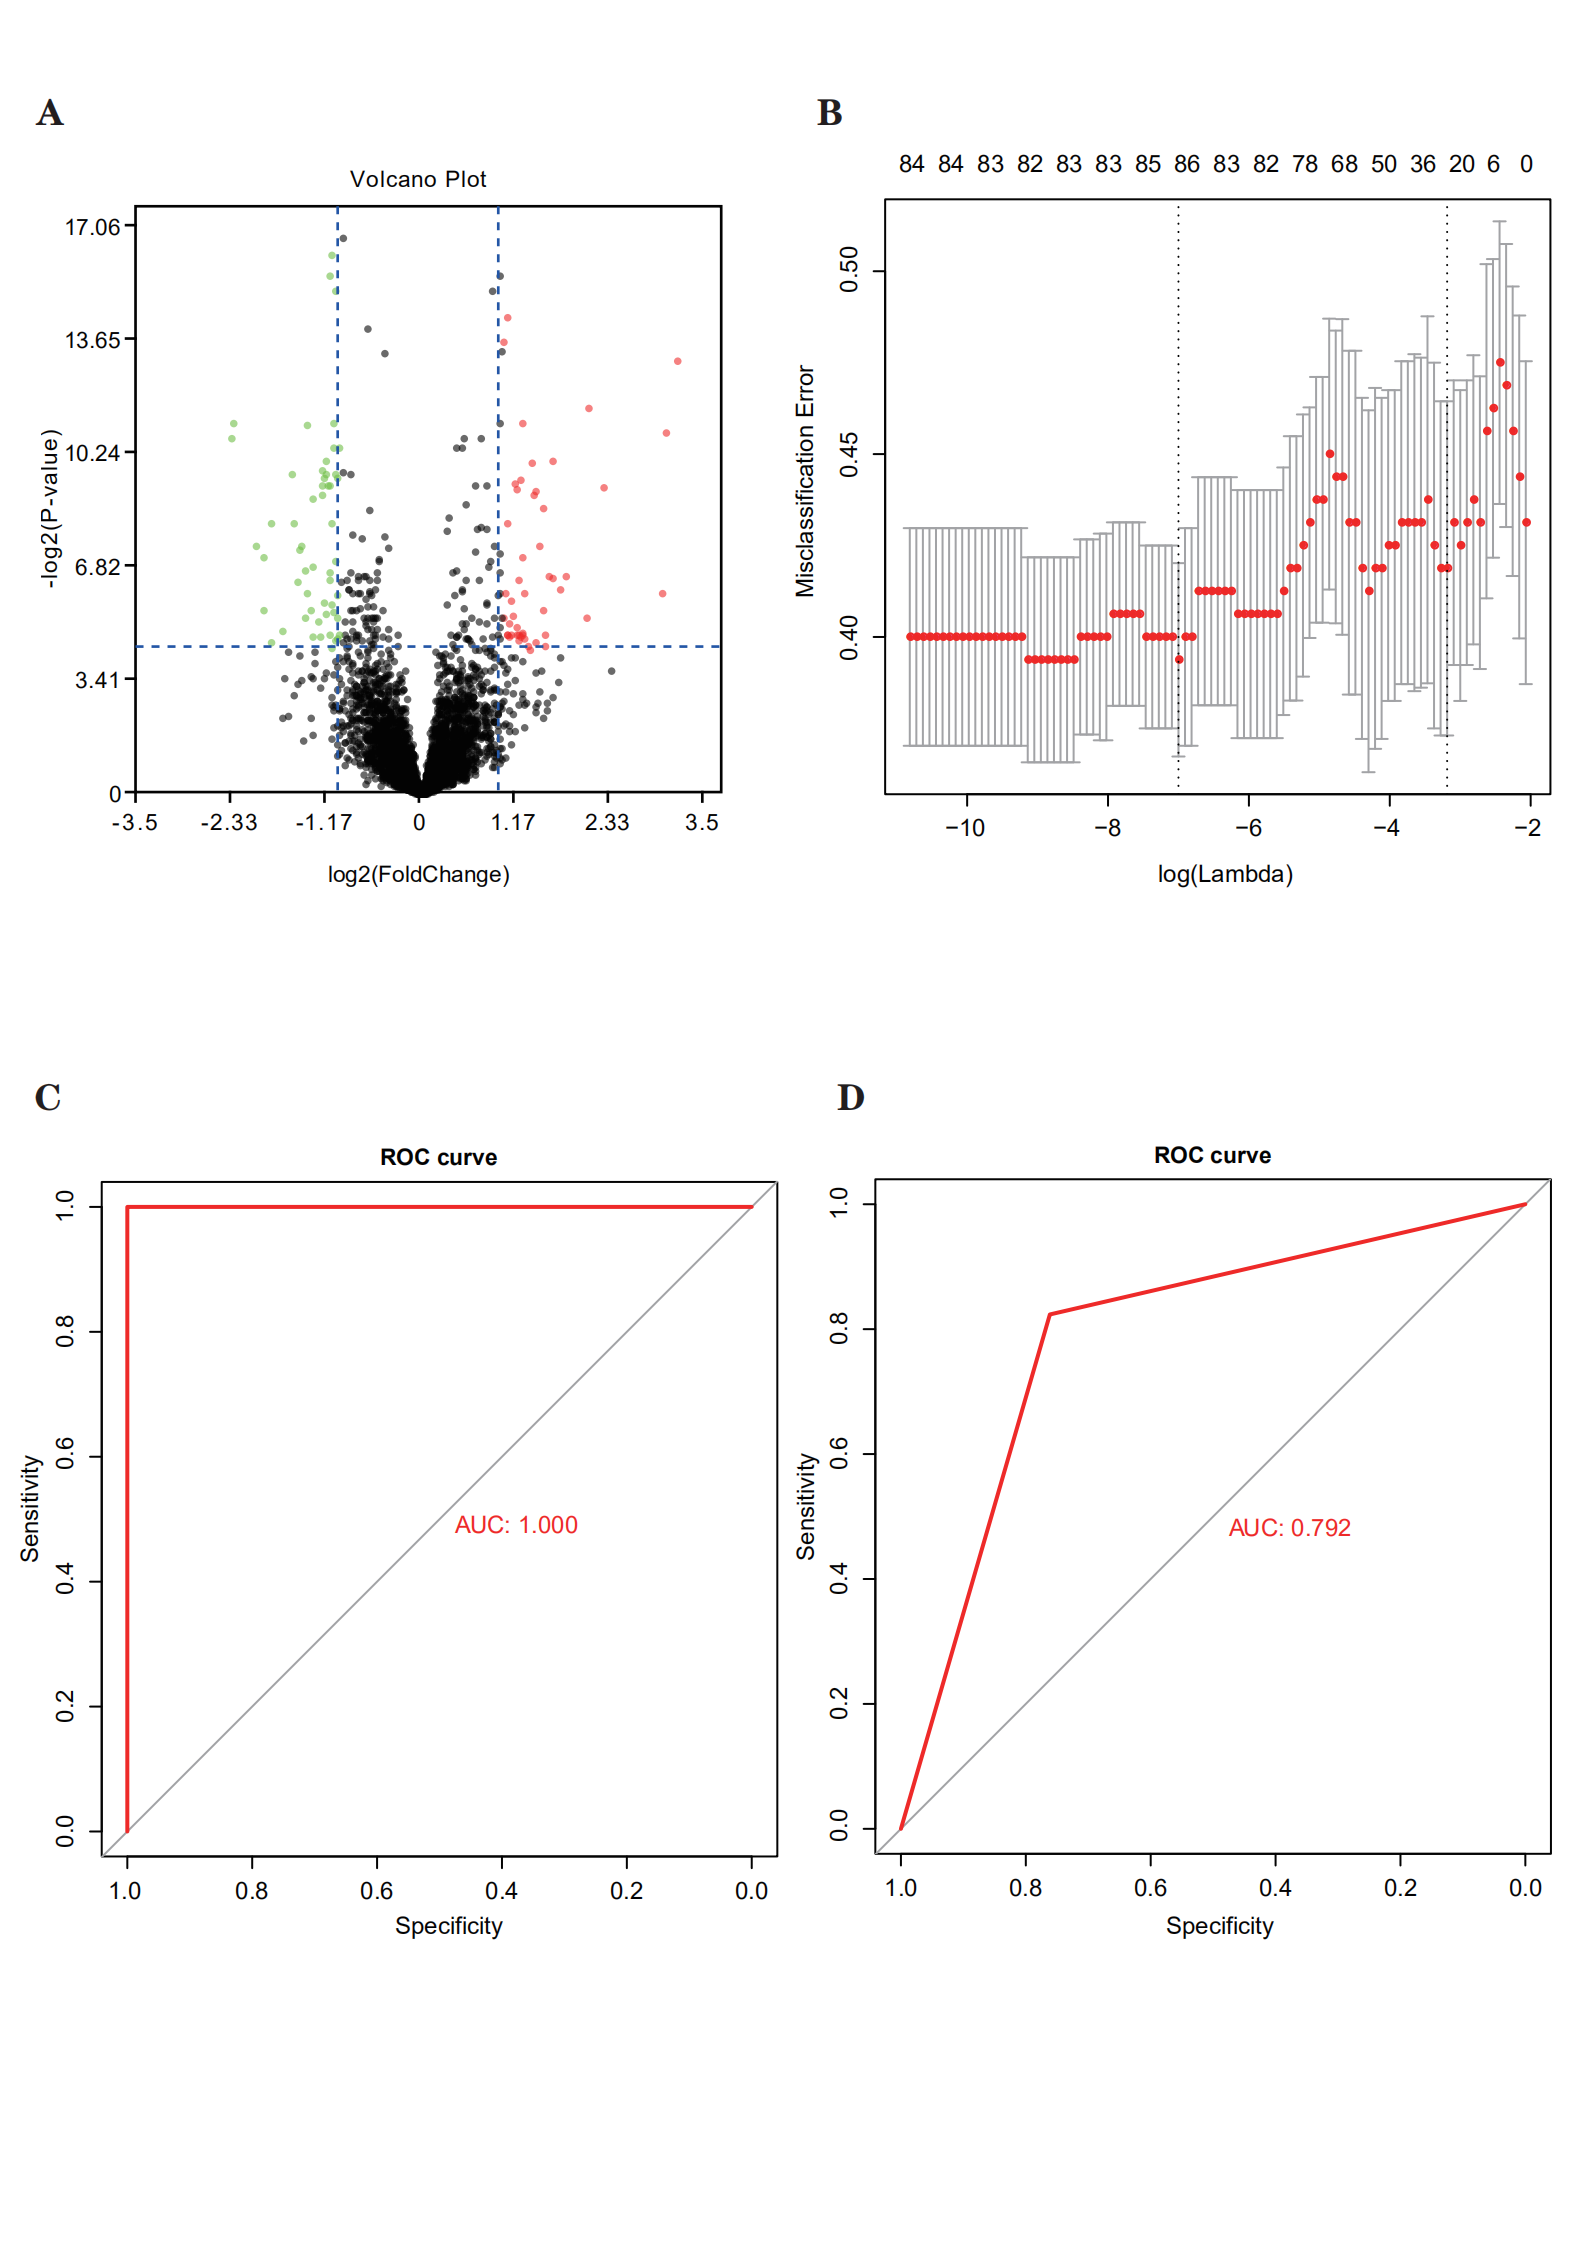
Datasets and correlated clinical data were downloaded from TCGA database. In total, 320 patients with bladder cancer and follow-up data were included (142 patients with recurrence and 178 with non-recurrence). The flow chart was shown in Fig. 1A. We compared the expression data pertaining to bladder cancer with the genome of the human v22 version of the GENCODE database, which led to the identification of 7648 lncRNAs. We then used the R package DESeq2 and applied the significance analysis of microarrays method with |logFC| > 1 and p < 0.05; consequently, from the 7648 lncRNAs, 104 were found to be differentially expressed between patients with and without recurrence. We then randomly categorized the 320 patients with bladder cancer into training (n = 160) and validation sets (n = 160). The LASSO Cox selection method was applied to select 86 lncRNAs (Supplementary Figure S1B). A ROC curve was constructed to evaluate the classification effect. The area under the ROC curve (AUC) for the training set was 1 and that for the validation set was 0.792 (Supplementary Figure S1C,D). Therefore, these DElncRNAs were considered to be candidate recurrence-associated lncRNAs.
Development and identification of the lncRNA-based recurrence prediction model and nomogram building
Using the 86 DElncRNAs, we performed univariable Cox regression proportional hazards analysis. Eight lncRNAs related to prognosis were screened out (LINC01449, MGC39584, CTD-2008P7.1, RP5-907D15.4, RP11-789C1.2, RP11-44D19.1, CTC-296K1.4, and AF015262.2; p < 0.05). A risk-score formula was derived based on the expression of these eight lncRNAs for DFS prediction: (0.03589833) × LINC01449 + (0.002352983) × MGC39584 + (− 3.231363e-05) × CTD-2008P7.1 + (0.001964683) × RP5-907D15.4 + (− 0.01417278) × RP11-789C1.2 + (0.02019916) × RP11-44D19.1 + (− 0.000741376) × CTC-296K1.4 + (0.01122571) × AF015262.2. We then calculated the eight-lncRNA signature risk score for each patient with bladder cancer and ranked them according to their risk scores. The median risk score (0.023) was considered to be the cutoff point to classify the patients into high- (n = 160) and low-risk (n = 160) groups. The patients in the low-risk group showed significantly longer median DFS than those in the high-risk group (log-rank test p = 0.0054; Fig. 1B).
Through a stepwise backward selection process based on AUC, lncScore, stage, and pT remained in the final Cox model for DFS (Fig. 1C). To develop a clinically applicable tool that could provide individualized estimation of 1-, 3-, or 5-year DFS, a nomogram was constructed on the basis of the final Cox model for DFS (Fig. 1D). The nomogram achieved a C-index of 0.719 (95% CI, 0.674–0.764), and the calibration plots showed good consistency between the actual DFS probabilities and the predicted DFS (Fig. 1E,F). Time-dependent ROC analyses also indicated the superior prognostic accuracy of the nomograms (AUC, 0.760; 95% CI, 0.697–0.807; Fig. 1G). These findings validated the importance of the proposed nomograms for DFS prediction.
Consensus classification construction using lncRNAs
Using the differential expression profiles of the 104 lncRNAs, unsupervised consensus clustering was used to derive a robust four-cluster consensus solution (Fig. 2A–C). Survival analysis of the lncRNA-based consensus clusters revealed significant survival differences among the four subtypes (Fig. 2D).
Prediction of immunotherapy and chemotherapy response for the new molecular classification system
TIDE was used to assess the clinical effects of immunotherapy in patients with bladder cancer with the four subtypes; significant differences were found in TIDE values among them (p = 1.2e− 14; Fig. 3A), which implied that there were differences in the sensitivity of the four subtypes to immunotherapy. A high TIDE predictive score is associated with a poor effect of immune checkpoint suppression therapy. Cluster 4 showed a higher TIDE predictive score and thus appeared resistant to immunotherapy. In contrast, clusters 2 and 3 showed lower TIDE predictive scores and thus appeared sensitive to immunotherapy. Thus, depending on the subtype, we could determine where immunotherapy would be effective.
“pRRophetic” was used to predict half maximal inhibitory concentration (IC50) values, which reflect the sensitivity of a sample to a drug, of two most commonly used chemotherapy drugs (cisplatin and gemcitabine) for the four subtypes. The sensitivity of the four subtypes to cisplatin (Fig. 3B) and gemcitabine (Fig. 3C) was found to be significantly different. Cluster 4 was sensitive to cisplatin and gemcitabine, while clusters 2 and 3 were resistant to them.
Immune score analysis
The gene expression data of bladder cancer samples were used to evaluate the stromal and immune scores, which represent tumor purity and can be used as indicators of tumor prognosis, using ESTIMATE. A significant difference was found between the scores among the four subtypes (Fig. 4A,B). Cluster 2 showed a high stromal score and was thus associated with low tumor purity and poor prognosis. On the other hand, cluster 4 showed a low stromal score and was accordingly associated with high tumor purity and favorable prognosis. Stromal score also increased with stage, consistent with high score, low purity, and poor prognosis (Fig. 4C). Immune score also increased with an increase in stage (Fig. 4D).
Using maxstat to determine the best cut-off point of continuous variables, the patients were classified into high and low stromal and immune score groups. A significant difference was present between these groups (p = 0.079 and 0.037, respectively; Fig. 4E, F). The patients with a high stromal score showed worse prognosis. Figure 4G depicts a heatmap that reflects relevant data.
Immunoinfiltration analysis
Using the expression (TPM) data, we predicted immune infiltrating cells in different subtypes of bladder cancer with CIBERSORT; consequently, the proportion of 22 immune infiltrating cells in each subtype of bladder cancer was obtained (Fig. 4H). Macrophages M2, T cells CD8, macrophages M0, and macrophages M0 accounted for the largest proportion in clusters 1, 2, 3, and 4, respectively.
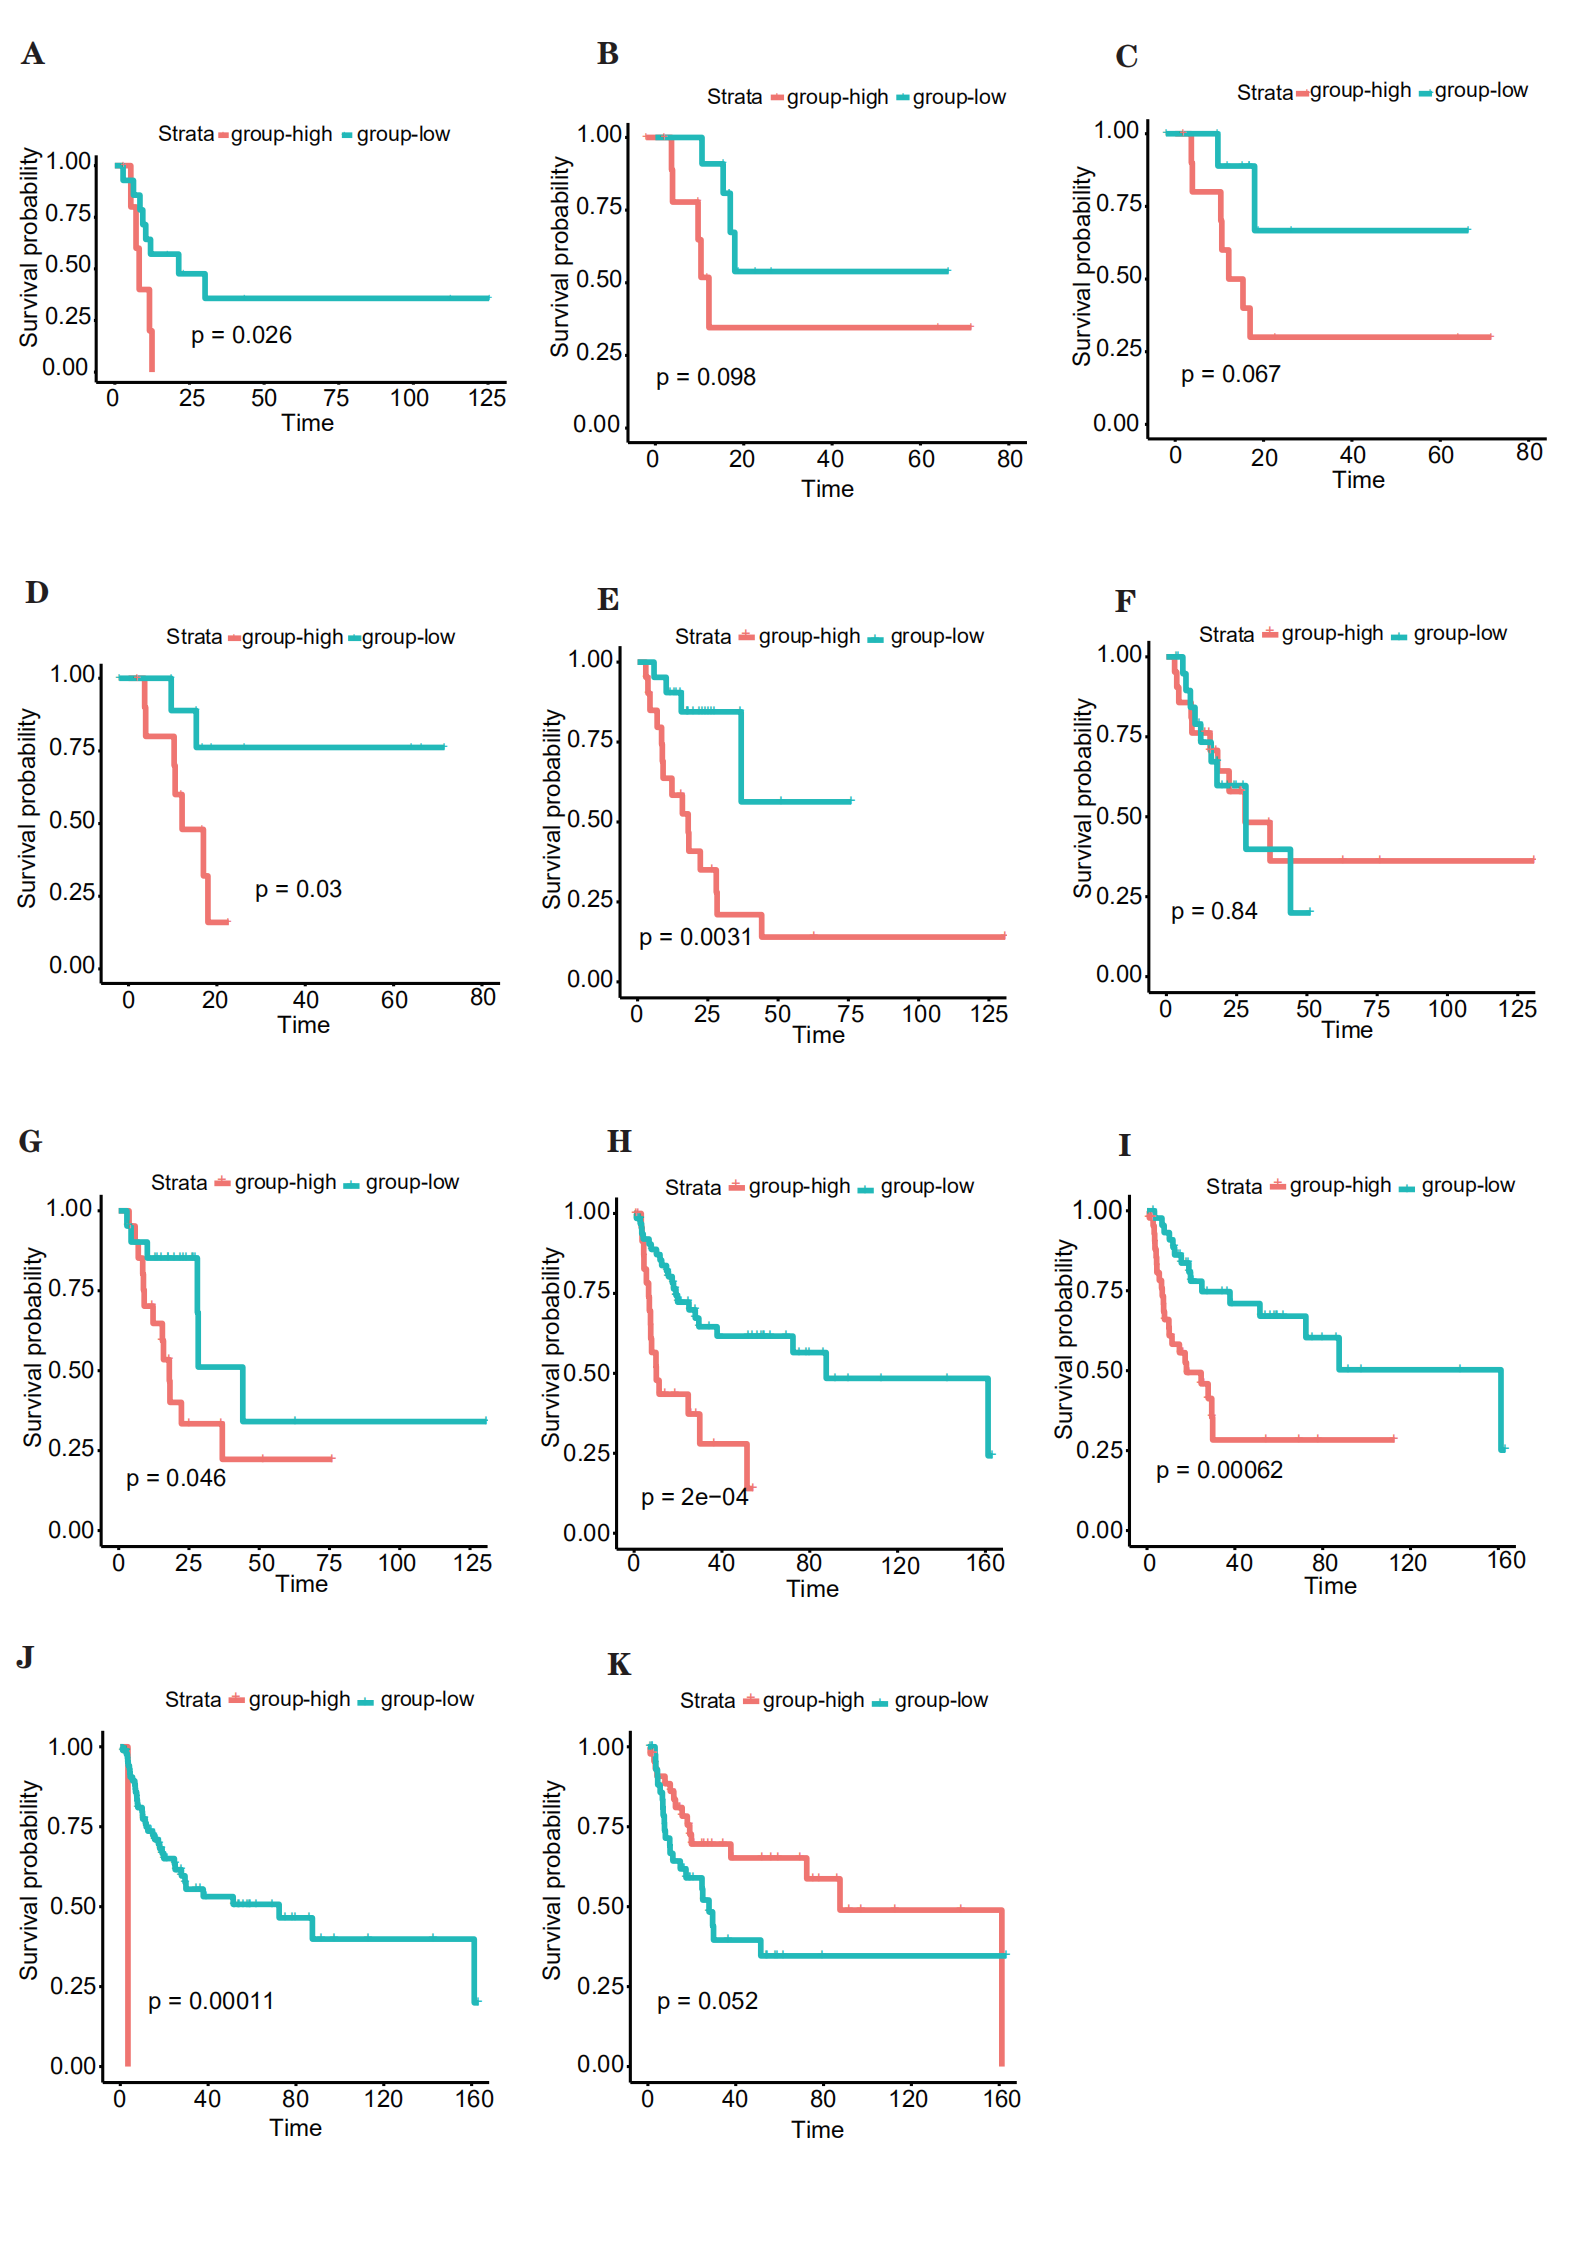
To comprehend the relationship between survival and the proportion of immune cells in the four clusters, we performed Cox regression analyses. In cluster 1, mast cells activated were related with survival. According to the median proportion of infiltrating cells, the samples were classified into high- and low-risk groups, and significant differences in survival were found (Supplementary Figure S2A). In cluster 2, mast cells resting and macrophages M1 and M0 were related with survival (Supplementary Figure S2B–D). According to the median proportion of infiltrating cells, the samples were classified into high and low groups, and significant differences in survival were found for only macrophages M0. In cluster 3, T cells CD4 memory resting, plasma cells, and mast cells resting were related with survival (Supplementary Figure S2E–G). According to the median proportion of infiltrating cells, the samples were classified into high and low groups, and significant differences in survival were found for T cells CD4 memory resting and mast cells resting. Finally, in cluster 4, mast cells activated, macrophages M0, T cells CD4 naïve, and mast cells resting were related with survival (Supplementary Figure S2H–K). According to the median proportion of infiltrating cells, the samples were classified into high and low groups, and significant differences in survival were found for mast cells activated, macrophages M0, and T cells CD4 naïve.
Mutational data analysis
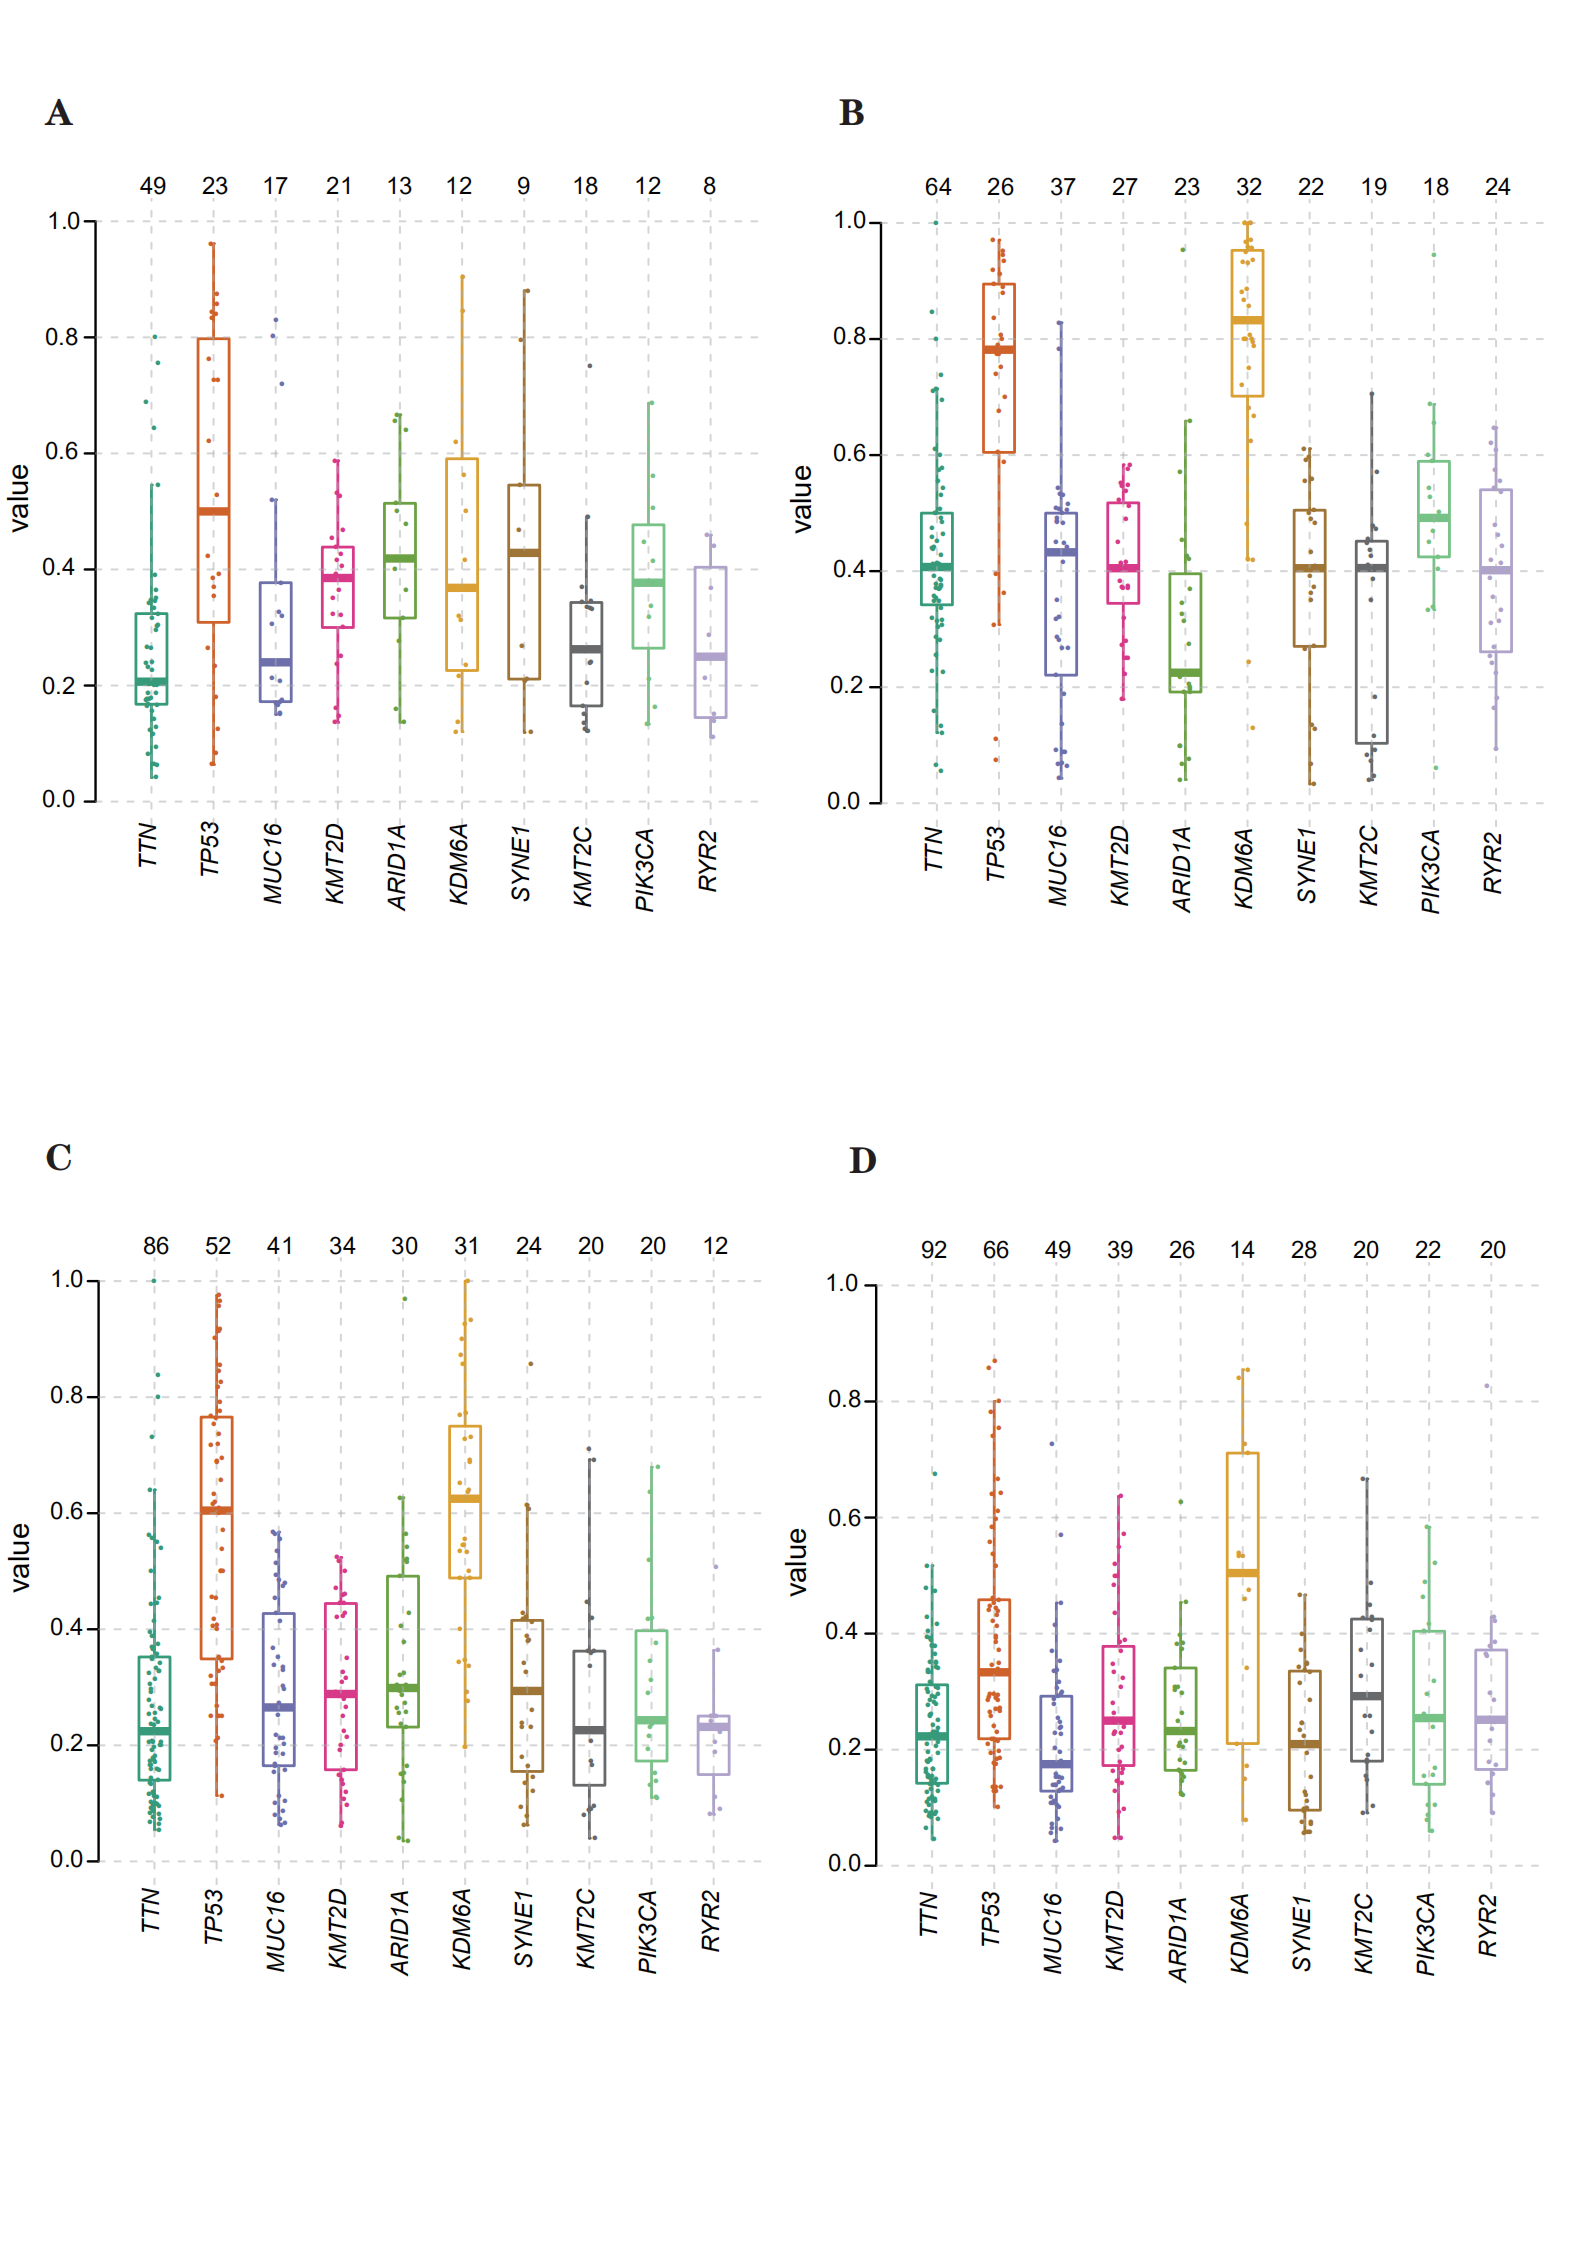
Using the mutational data in TCGA database, we performed statistical analysis using bladder cancer samples, including the type of mutation annotation, proportion of different types of base changes, top 10 mutant genes, and so on (Fig. 5A). Missense mutation is the main type of mutation in bladder cancer; single nucleotide polymorphisms are the main source of mutation, followed by DEL and INS. C > T is the most common single nucleotide polymorphism. The top 10 genes with a high incidence of mutations included, for example, TTN, TP53, and MUC16. The distribution, mutation annotation, survival status (OS, DFS), and tumor mutation load of the four BLCA subtypes (clusters 1–4) are shown in Fig. 5B–E. TTN was the gene with the highest mutation rate in cluster 1, fibroblast growth factor receptor (FGFR)-3 in cluster 2, and TP53 in clusters 3 and 4. As evident from Supplementary Figure S3A–D, the frequency of mutant genes (e.g., TP53 and KDM6A) was different in the four subtypes.
Based on the mutation site of each sample, we considered the bases at the 1-bp position upstream and downstream of the mutation site, divided the mutation into 96 types, and counted the frequency of the 96 mutation types in tumor samples belonging to the four subtypes (Fig. 6A–D).
To determine the relationship between the mutation frequency distribution and signatures collected from COSMIC, we performed non-negative matrix decomposition on the frequency matrix with rows as samples and columns with the 96 mutation types to extract 2 and 3 somatic point mutation characteristics. The similarity analysis of the extracted features and collected signatures revealed that the BLCA mutation spectrum of the bladder cancer subtype 1 (cluster 1) was mainly related to signatures 13, 2, 1, 10, and 5; that for subtype 2 (cluster 2) was mainly related to signatures 10, 2, and 1; that for subtype 3 (cluster 3) was mainly related to signatures 13, 2, and 1; and that for subtype 4 (cluster 4) was mainly related to signatures 13, 2, 6, and 5 (Fig. 6E–H). Signatures 13 and 2 were mainly related to adenosine deaminase, 1 to spontaneous deamination reaction of 5-methylcytosine, 10 to polymerase defects, and 6 to DNA mismatch repair.