MONC exhibits low expression in EC as a tumor suppressor gene
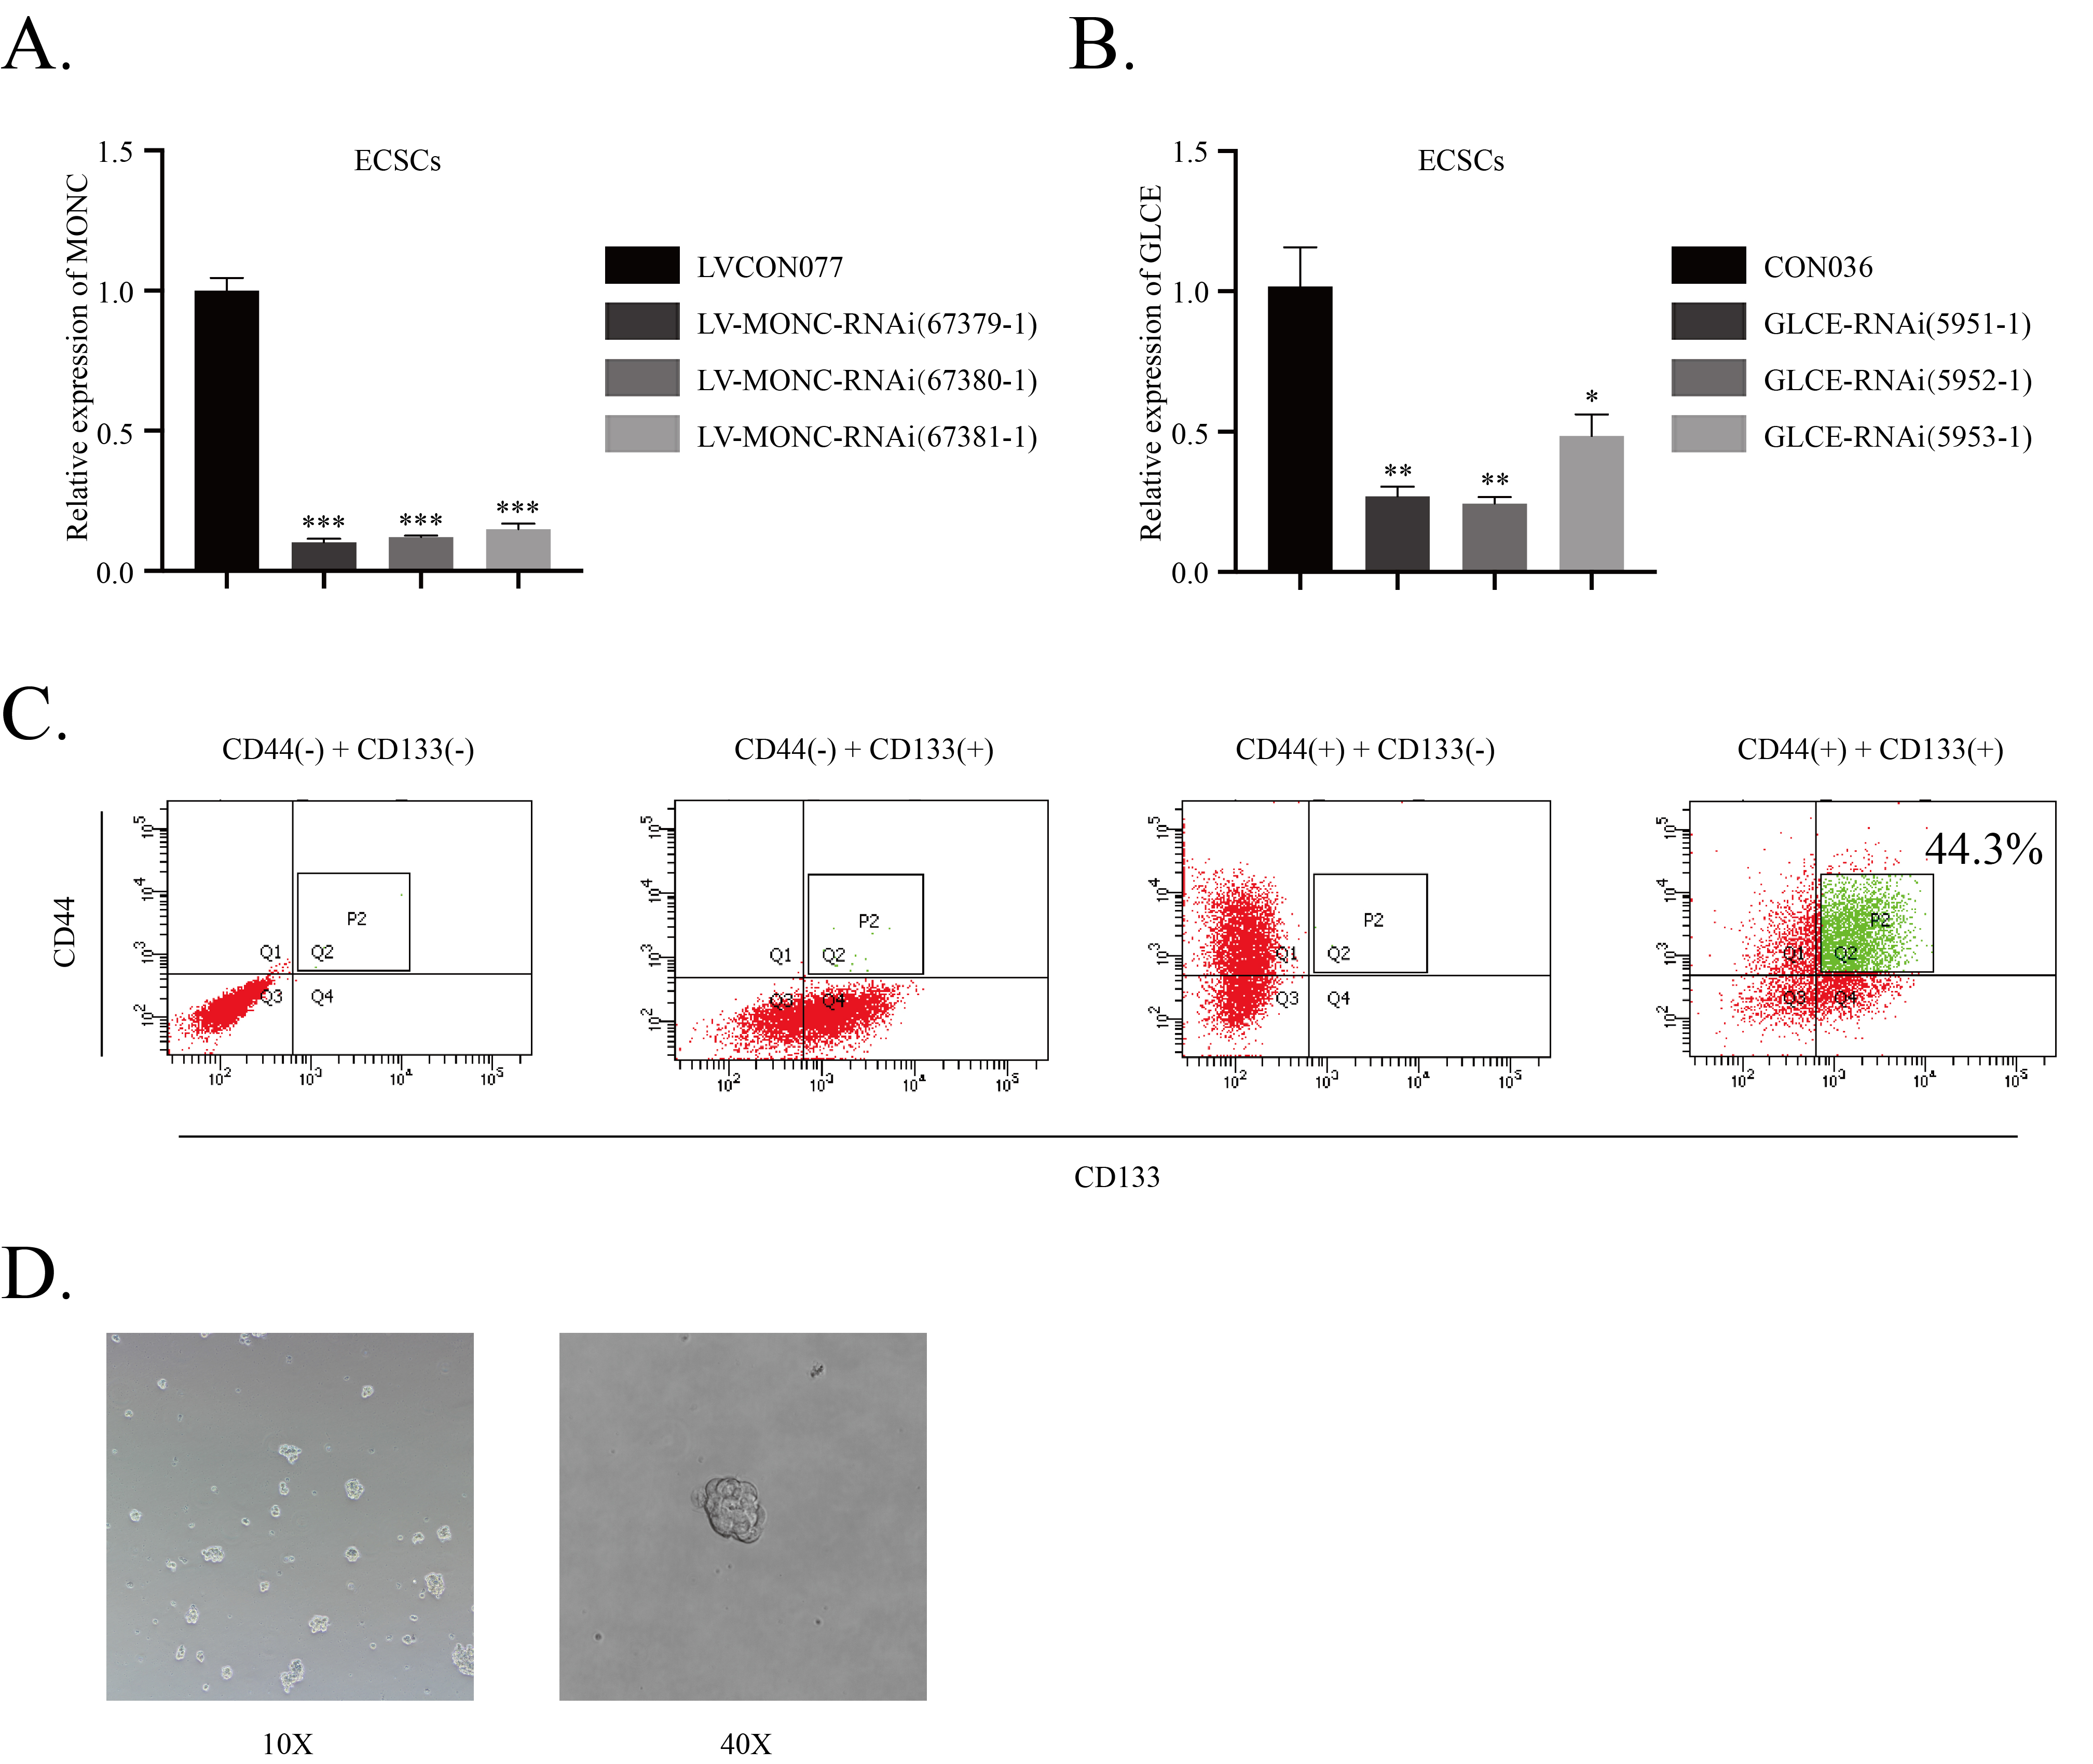
By quantitative real-time polymerase chain reaction (qRT-PCR) detection, compared with normal human endometrial tissue, MONC exhibited low expression in human endometrial carcinoma tissue (Fig. 1A). Clinical pathological analysis showed that MONC expression was related to the depth of Invasion and FIGO Stage (Table 3). To determine the effect of MONC on ECSCs, we used LV-MONC, LV-MONC-RNAi, and their corresponding negative controls to construct stable lentiviral ECSCs, and Ishikawa and HEC-1A cell lines. Transfection efficiency was verified using qRT-PCR. A lentiviral vector (LV-MONC-RNAi (67379-1)) with the best knockdown effect was selected for subsequent experiments (Figure S1A).
Table 3
Relationship between MONC expression and pathologic tumor parameters
|
Clinical parameters
|
n
|
The expression of MONC (Mean ± SEM)
|
P
|
|
Differentiation
|
|
|
0.098
|
|
High + High-Middle
|
35
|
0.360 ± 0.036
|
|
|
Middle + Middle-Low + Low
|
25
|
0.467 ± 0.056
|
|
|
Invasion depth
|
|
|
0.002 *
|
|
<1/2
|
40
|
0.473 ± 0.041
|
|
|
≥ 1/2
|
20
|
0.268 ± 0.035
|
|
|
FIGO Stage
|
|
|
0.007 *
|
|
I
|
52
|
0.438 ± 0.032
|
|
|
II + III + IV
|
8
|
0.189 ± 0.088
|
|
|
Age, y
|
|
|
0.241
|
|
<60
|
34
|
0.438 ± 0.046
|
|
|
≥ 60
|
26
|
0.362 ± 0.042
|
|
Based on previous research by our team, in order to extract ECSCs from endometrial carcinoma cells (ECCs), we used DMEM/F12 (1:1) serum-free medium containing 2% B27 supplement, 20 ng/ml EGF, 20 ng/ml bFGF, and 1% penicillin-streptomycin for Ishikawa cells to form mammospheres. Post-sphere formation, Ishikawa cells were labeled with CD44 (PerCP-Cy7M5.5 Mouse Anti-Human) and CD133 (APC Mouse Anti-Human), ECCs positive for both CD44 and CD133 were obtained using flow cytometry cell sorting. We obtained ECSCs via flow sorting, and these were used in subsequent experiments (Figure S1C-D).
In the CCK-8 cell proliferation assay, we observed reduced proliferation rates in the MONC overexpression group, while the MONC knocked down group appeared increased (Fig. 1B). In the ECSC sphere formation assay, we found that the growth rate of ECSC spheroids in the MONC overexpression group slowed down, while the growth rate of ECSC spheroids in the MONC knockdown group accelerated (Fig. 1C). Thereafter, the Transwell cell invasion assay revealed that overexpression of MONC inhibited the invasion of ECSCs, and Ishikawa and HEC-1A cells. Conversely, knockdown of MONC promoted the invasion of ECSCs, and Ishikawa and HEC-1A cells (Fig. 1D). Next, we examined the effects on overexpression and knockdown of MONC on the cell cycle and apoptosis of ECSCs, and Ishikawa and HEC-1A cells using flow cytometry. The results showed that MONC overexpression induced cell cycle arrest in the G0/G1 phase, while knockdown of MONC exerts the opposite effect (Fig. 1E). Overexpression of MONC promotes apoptosis, and knockdown of MONC inhibits apoptosis (Fig. 1F).
Therefore, MONC exhibits low expression in endometrial carcinoma as a tumor suppressor gene.
Mir-636 exhibits high expression in EC as an oncogene, while MONC binds and negatively regulates miR-636
qRT-PCR revealed that miR-636 was highly expressed in human endometrial carcinoma tissue compared with normal human endometrial tissue (Fig. 2A). Clinical pathological analysis showed that the expression of MONC is related to invasion depth and FIGO Stage (Table 4). In addition, the expression of miR-636 was negatively correlated with the expression of MONC (Fig. 2B, Pearson’s rank correlation method: r2 = 0.0945, P = 0.0169).
Table 4
Relationship between miR-636 expression and pathologic tumor parameters.
|
Clinical parameters
|
n
|
The expression of miR-636 (Mean ± SEM)
|
P
|
|
Differentiation
|
|
|
0.339
|
|
High + High-Middle
|
35
|
6.400 ± 0.779
|
|
|
Middle + Middle-Low + Low
|
25
|
7.525 ± 0.844
|
|
|
Invasion depth
|
|
|
0.037 *
|
|
<1/2
|
40
|
6.027 ± 0.601
|
|
|
≥ 1/2
|
20
|
8.552 ± 1.167
|
|
|
FIGO Stage
|
|
|
<0.001 *
|
|
I
|
52
|
6.039 ± 0.526
|
|
|
II + III + IV
|
8
|
12.260 ± 1.710
|
|
|
Age, y
|
|
|
0.987
|
|
<60
|
34
|
6.877 ± 0.818
|
|
|
≥ 60
|
26
|
6.858 ± 0.800
|
|
We used qRT-PCR to determine the expression of miR-636 in ECSCs, Ishikawa cells, and HEC-1A cells stably transfected with MONC overexpression and knockdown. The results showed that the expression of miR-636 decreased in the MONC overexpression group, while miR-636 expression increased in the MONC knockdown group (Fig. 2C). Next, we transfected ECSCs, Ishikawa cells, and HEC-1A cells with AgomiR-636, miR-636 antagomir, and corresponding negative controls. We detected the expression of MONC using qRT-PCR. The results showed that MONC expression decreased in the AgomiR-636 group and increased in the miR-636 antagomir group (Fig. 2D).
The double fluorescence in situ hybridization (D-FISH) showed that MONC and miR-636 were relatively co-localized in the cytoplasm of Ishikawa cells (Fig. 2E). A bioinformatics database (RNAhybrid) was used to predict the binding site between MONC and miR-636. In order to further study whether MONC is a functional target of miR-636, we co-transfected HEK-293T cells with MONC-WT and NC, and MONC-WT and miR-636. Thereafter, we performed a dual-luciferase reporter assay. The results showed that the relative luciferase activity of the MONC-WT + miR-636 group was lower than that of the MONC-WT + NC group, suggesting that there is a binding site between MONC and miR-636 (Fig. 2F). A MONC mutant vector was constructed, based on the predicted binding sites of the bioinformatics database (RNAhybrid). Next, we co-transfected HEK-293T cells with MONC-Mut and NC, and MONC-Mut and miR-636. Detection of the dual-luciferase reporter assay verified the binding site between MONC and miR-636 (Fig. 2F).
Therefore, we speculate that miR-636 is overexpressed in EC as an oncogene, MONC binds and negatively regulates miR-636, and there may be a feedback loop of mutual inhibition between MONC and miR-636.
Knockdown of miR-636 mediates the tumor suppressive effect of MONC overexpression in ECSCs and ECCs
To determine whether miR-636 mediated tumor suppression via MONC overexpression, we first transfected miR-636 antagomir into ECSCs, Ishikawa cells, and HEC-1A cells stably overexpressing MONC. AgomiR-636 was transfected into MONC knocked down ECSCs, Ishikawa cells, and HEC-1A cells. We divided the experiments into six groups: Control, MONC (+), miR-636 (-), Stable NC, MONC(+) + miR-636(-), and MONC(-) + miR-636(+).
The CCK-8 cell proliferation assay indicated that the MONC(+) + miR-636(-) group exhibited the lowest proliferation rate, while the MONC(-) + miR-636(+) group exhibited the highest proliferation rate (Fig. 3A). The sphere formation assay demonstrated that miR-636 knockdown can inhibit the growth rate of ECSC spheroids. The MONC(+) + miR-636(-) group displayed the most obvious inhibitory effect on the growth rate of ECSC spheroids. The ECSC spheroids in the MONC(-) + miR-636(+) group displayed the fastest growth rate (Fig. 3B). According to the Transwell cell invasion experiment, we found that knockdown of miR-636 inhibited the invasion of ECSCs, Ishikawa cells, and HEC-1A cells. The MONC(+) + miR-636(-) group displayed the strongest invasion inhibitory effects in ECSCs, Ishikawa cells, and HEC-1A cells, while the MONC(-) + miR-636(+) group displayed the weakest invasion inhibitory effects (Fig. 3C). Thereafter, we employed flow cytometry to observe the cell cycle and apoptosis of ECSCs, Ishikawa cells, and HEC-1A cells after transfection. The results showed that AntagomiR-636 can induce cell cycle arrest at the G0/G1 phase, the MONC (+) + miR-636(-) group had the strongest ability to induce cell cycle arrest in the G0/G1 phase, and the MONC(-) + miR-636(+) group had the weakest ability (Fig. 3D). MiR-636 can inhibit apoptosis, and the MONC(+) + miR-636(-) group exhibited the strongest inhibitory effect on apoptosis, while the MONC(-) + miR-636(+) group exhibited the weakest (Fig. 3E).
Therefore, we believe that miR-636 can mediate tumor suppressive effects of MONC overexpression in ECSCs, Ishikawa cells, and HEC-1A cells, and that knockdown of MONC combined with overexpression of miR-636 have significant carcinoma-promoting effects in ECSCs and ECCs.
GLCE exhibits low expression in EC as a tumor suppressor gene, and participates in the malignant progression of ECSCs induced by MONC-miR-636
qRT-PCR and western blot experiments revealed low expression of GLCE in human endometrial carcinoma tissue compared to normal human endometrial tissue (Fig. 4A). Clinical pathological analysis showed that the expression of GLCE is related to differentiation, invasion depth, and FIGO Stage (Table 5).
Table 5
Relationship between GLCE expression and pathologic tumor parameters.
|
Clinical parameters
|
n
|
The expression of GLCE (Mean ± SEM)
|
P
|
|
Differentiation
|
|
|
0.003 *
|
|
High + High-Middle
|
35
|
0.193 ± 0.033
|
|
|
Middle + Middle-Low + Low
|
25
|
0.371 ± 0.050
|
|
|
Invasion depth
|
|
|
0.023 *
|
|
<1/2
|
40
|
0.316 ± 0.039
|
|
|
≥ 1/2
|
20
|
0.170 ± 0.042
|
|
|
FIGO Stage
|
|
|
0.012 *
|
|
I
|
52
|
0.297 ± 0.033
|
|
|
II + III + IV
|
8
|
0.076 ± 0.021
|
|
|
Age, y
|
|
|
0.104
|
|
<60
|
34
|
0.311 ± 0.042
|
|
|
≥ 60
|
26
|
0.210 ± 0.043
|
|
Using the bioinformatics database (miRDB), we observed that GLCE is a downstream target gene of miR-636. Therefore, we co-transfected HEK-293T cells with GLCE-WT and NC, and GLCE-WT and miR-636. We conducted dual-luciferase reporter tests and discovered that the relative luciferase activity of the GLCE-WT + miR-636 group was lower than that of the GLCE-WT + NC group, suggesting that there is a binding site between GLCE and miR-636 (Fig. 4D). A GLCE mutant vector was constructed based on the predicted binding sites of the bioinformatics database (miRDB), followed by co-transfection of GLCE-Mut and NC, and GLCE-Mut and miR-636. The dual-luciferase reporter test verified the binding site between MONC and miR-636 (Fig. 4D).
In order to investigate whether MONC could regulate miR-636 in EC as ceRNA of GLCE, western blot was used to determine the expression level of GLCE in ECSCs, Ishikawa cells, and HEC-1A cells transfected with MONC. MONC overexpression promotes expression of GLCE at the protein level. Simultaneously, transfection with AgomiR-636 rescued MONC from promoting GLCE protein expression (Fig. 4C).
To explore the effect of GLCE on the malignant biological behavior of ECSCs, we first transfected ECSCs, Ishikawa cells, and HEC-1A cells with GLCE overexpression plasmids, GLCE knockdown plasmids, and corresponding negative controls. The transfection efficiency was verified using qRT-PCR. A plasmid with the best knockdown effect (GLCE-RNAi(5952-1)) was selected for subsequent experiments (Figure S1B). Next, we performed a CCK-8 cell proliferation experiment and found that the proliferation rate in the GLCE-overexpressed group decreased, while the proliferation rate in the GLCE-knocked-down group increased (Fig. 5A). The sphere formation assay indicated that the growth rate of ECSC spheroids in the GLCE overexpression group slowed down, while that in the GLCE knockdown group accelerated (Fig. 5B). We observed that the overexpression of GLCE inhibited the invasion of ECSCs, Ishikawa cells, and HEC-1A cells. Conversely, knockdown of GLCE promoted the invasion of ECSCs, Ishikawa cells, and HEC-1A cells (Fig. 5C). Next, we used flow cytometry to examine the effects of GLCE knockdown and overexpression on the cell cycle and apoptosis of ECSCs, Ishikawa cells, and HEC-1A cells. The results showed that overexpression of GLCE can induce cell cycle arrest at the G0/G1 phase, while knockdown of GLCE exerts the opposite effect (Fig. 5D). Overexpression of GLCE promotes apoptosis, and GLCE knockdown inhibits apoptosis (Fig. 5E).
Therefore, we speculated that GLCE expression is low in EC as a tumor suppressor gene and participates in the malignant progression of ECSCs and ECCs induced by MONC-miR-636. Among them, MONC can regulate miR-636 as the ceRNA of GLCE.
Overexpression of MONC inhibits the Notch signaling pathway and inhibits the EMT process in ECSCs and ECCs, while miR-636 rescues the inhibitory effect of MONC overexpression
In order to explore the molecular mechanism of the downstream signaling pathway regulated by MONC and miR-636, we first constructed ECSCs, and Ishikawa and HEC-1A cell lines stably overexpressing MONC. AgomiR-636 was transfected into ECSCs, Ishikawa cells, and HEC-1A cells stably overexpressing MONC. We divided the experiment into three groups, namely, Control, MONC(+), and MONC(+) + miR-636(+). The protein levels of EMT-related indicators were detected using western blot. The results showed that MONC overexpression inhibited the expression of Snail1, Vimentin, and N-cadherin, and promoted the expression of E-cadherin. miR-636 can rescue the inhibitory effects of MONC overexpression on EMT process (Fig. 6A).
Therefore, we speculate that the knockdown of MONC overexpression in combination with miR-636 inhibits the EMT process in ECSCs and ECCs.
Overexpression of MONC inhibited the growth of EC tumors in nude mice. miR-636 rescued the inhibitory effect of MONC overexpression on the growth of EC tumors.
We conducted nude mice tumorigenesis experiments to investigate the effect of MONC combined with miR-636 on tumor growth in nude mice. MONC(+) and MONC(+) + miR-636(+) ECSCs, Ishikawa cells, and HEC-1A cells were injected subcutaneously into nude mice.
The results are shown in Fig. 7. In the MONC(+) group and the MONC(+) + miR-636(+) group, the tumor volume and weight are smaller than that of the control group, and the MONC(+) group exhibits the smallest tumor volume (Fig. 7A). Further, we detected the expression of GLCE in the tumor using western blot. The expression of GLCE in the tumors of the MONC(+) group and the MONC(+) + miR-636(+) group increased, while GLCE expression is highest in the MONC(+) group (Fig. 7B). Results indicate that MONC can inhibit the growth of EC tumors, and miR-636 rescued MONC from inhibiting the growth of EC tumors.