Advances in the genomic research of peanut are limited and advanced molecular techniques are underutilized to manage available germplasm and landraces. However, the elucidation of genetic relationships and genetic diversity among the germplasm or other breeding lines can lead to the precise use of genetic resources for crop improvement and for designing the breeding program [45, 46]. Recent developments in peanut genomic research, especially after the availability of its reference genome [7] and different SNP arrays [38, 40] for high throughput genotyping of peanuts, provide a great opportunity for accessing different genetic resources at the genetic level and for advancing the breeding program via multiple strategies.
SNP-based genotyping is widely used due to its accuracy, abundance, and high throughput. In this study, initially, a pseudomolecule-reference genome was identified based on the genomes of two diploid subspecies of cultivated peanut, A. duranensis (A genome) and A. ipaensis (B genome) as described previously [19, 38]. Furthermore, pseudomolecule-reference genome-wise distribution of SNP arrays and genome-wise polymorphic SNPs were identified (Fig. 1A, Table S3). This analysis was more or less similar to the previously reported studies [19, 38]. We yielded a total of 47,837 SNPs from the ‘Axiom_Arachis’ array, from which 19,554 SNPs belonged to A subgenome, while 21,876 SNPs belonged to B subgenome (Fig. 1A, Table S3). Further, the genetic diversity and the population structures of the Korean set of peanut genotypes (n = 96) were analyzed using 9947 high-resolution SNPs after excluding SNPs with a missing rate > 10%, a minor allele frequency (MAF) < 0.05, and a heterozygous call rate > 10%. At the same time, data related to mini-core US 111 genotypes were extracted from the public domain and combined with the Korean set of peanut genotypes to generate a Merge set. This Merged set was also used in the analysis of genetic diversity and population structure based on the 4448 polymorphic SNPs. Results of genetic diversity analysis for the Korean set of genotypes showed a mean major allele frequency (MAF) of 0.837, a PIC of 0.375, a He values ranged from 0.020 to 0.500 (mean: 0.229), while the Ho values ranged from 0.00 to 0.979 (mean: 0.048). Likewise, the genetic diversity of the Merge set showed a MAF of 0.99, a PIC of 0.375, the He values ranged from 0.005 to 0.499 (mean: 0.333), while the Ho values ranged from 0.00 to 0.845 (mean: 0.061) (Table 1). These average values of PIC, He, and Ho of the Merge set were were slightly higher than those of the Korean set but not significantly higher than those of the Korean set. These results suggested that the Korean set and the Merge set of peanut genotypes were not very diverse. F-statistics (Fis) of both sets (Korean and Merge) of genotype revealed a high inbreeding coefficient (Table 1). Thus, it could be considered that the genetic diversity for these peanut genotypes (Korean and Merge) was low (Table 1). These study results for genetic diversity were highly comparable to those of some recent studies conducted using SNPs markers for peanuts [19, 38, 47, 48].
To investigate the optimal number of population (K) subsets in STRUCTURE, LnP(D) and ΔK were selected [19, 49]. In the STRUCTURE, LnP(D) representing the maximum likelihood can be obtained based on the K value. It is generally considered as an optimal number of a subpopulation [50]. The structure analysis of the Korean set of peanut genotypes (n = 96) yielded the highest ΔK value (810.773) at K = 2 (Fig. 2A). Based on such results, the Korean set of peanut genotypes (n = 96) were categorized into two subgroups (GI and GII) (Fig. 2B). Population structure analysis at K = 3 was also performed (Fig. 2A). When K = 3 at the second largest value (ΔK = 50.114), these genotypes were divided into three groups (GI, GII, and GIII) (Fig. 2B). Likewise, the Merge set of genotypes based on 4475 SNPs showed the maximum K value (22778.77) at K2 (Fig. 3A) followed by K3. Based on the represented population structure, the Merge set of genotypes were divided into two groups (GI and GII) at K = 2. Further at K = 3, all 207 genotypes were separated into three groups (GI, GII, and GIII) (Fig. 3B). However, STRUCTURE analysis did not indicate correspondence with subspecies, botanical variety, or origin. Thus, is indicated seeds of Arachis hypogaea L. might have been dispersed with a wide geography from the center of origin.
Based on phylogenetic analysis, the Korean set of peanut genotypes (n = 96) were divided into two major clusters (CI and CII). CII was manually subdivided into CIIa and CIIb clades (Fig. 4). These Korean origin genotypes were distributed over all clusters (Fig. 4). Similarly, phylogenetic analysis for the Merge set of 207 genotypes showed two major groups (Fig. 5). As expected, Cluster CI (n = 96) genotypes belonged to the Korean set whereas clusters CIIa and CIIb comprising 111 genotypes were derived from the US mini-core set that formed a separate cluster (Fig. 5). More than 50.0% of Korean genotypes in the cluster CI had a close genetic distance with genotypes from the USA and China. Thus, these Korean peanut genotypes might have been derived from China and the USA. Other Korean genotypes were located in the CIIa cluster, showing 18.30% similarities with genotypes from different parts of the world (India, China, USA, Argentina, Taiwan, and Zimbabwe). Similarly, 31.0% of Korean genotypes from cluster CIIb showed similarities with a single Indian genotype, indicating that these genotypes belonging to this cluster might have been originated from India. These results indicate that germplasm exchange between Korea and other parts of the world might have occurred. Different peanut genotypes in both sets (Korean and Merged) across the globe were separated into two major groups, although individuals in groups were mixed without any correlation with subspecies, botanical variety, or origin. However, the phylogenic results were in agreement with the results of the model-based population structure analysis at K = 2 for both the Korean set and the Merge set of peanut genotypes. Besides, the clustering and grouping patterns of genotypes of different origins could be explained precisely using an SNP array. They were comparable to those reported in previous studies [18, 19, 51–53].
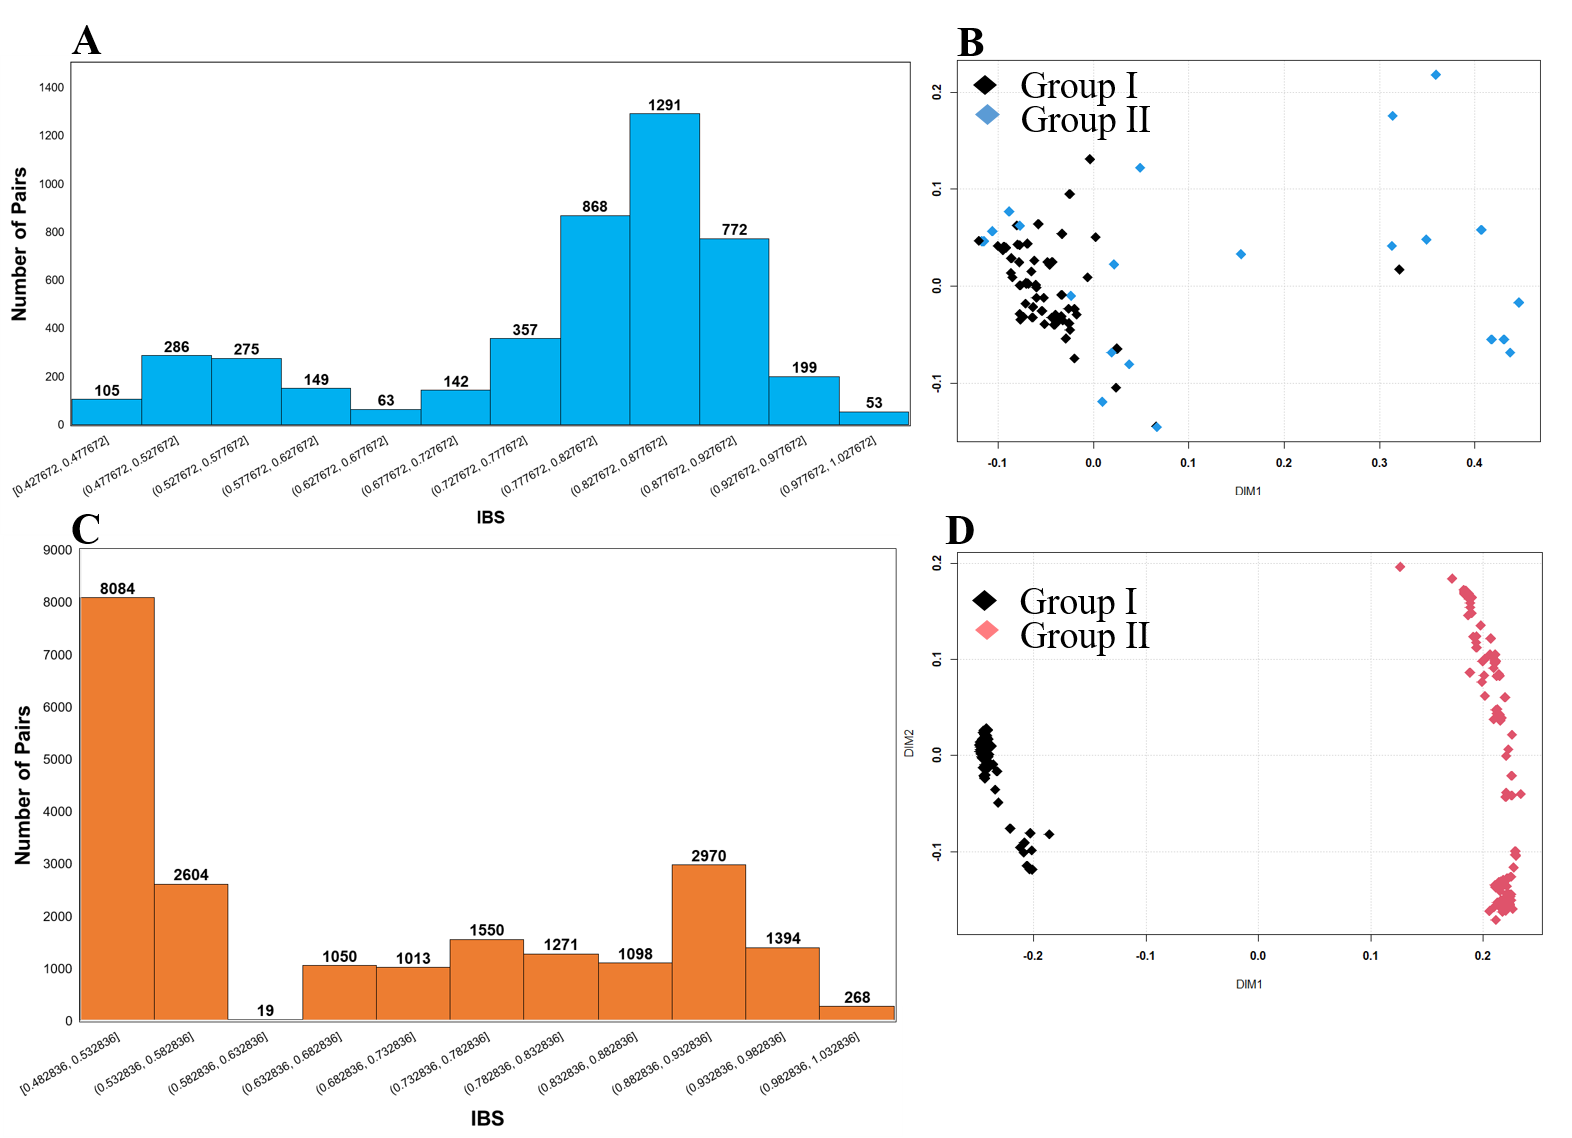
Moreover, the clusters derived from both sets of genotypes were further validated by PCA (Fig. 6). Results were consistent with relationships indicated by phylogenetic tree analysis and structure analysis. AMOVA results explained the differential variation between the Korean set and the Merge set of populations (Table 2). Population variation among the Korean set was 10.34%, whereas a difference of 89.66% was found in individual samples within the population of the Korean set (Table 2). Likewise, a variation of 65.61% was found among the populations of the Merged set and a variation of 34.39% was observed within the individual population samples of the Merge set (Table 2).
Overall, this study suggests that the high inbreeding coefficient and less variability in tested genotypes might be due to the self-pollination and repetitive selection of these peanut lines over the years during cultivar development and breeding process, which might have consequently reduced the genetic diversity. Therefore, the higher similarity and low genetic variability were observed in tested genotypes of the current study. This observation is in line with the pollination system and the history of peanut cultivation.
The increasing number of individuals and the routine use of population studies in genetics and breeding programs require flexibility and precision in genotyping methods. KASP marker assay is one such genotyping method that has emerged recently. It offers several advantages such as flexibility, robustness, multiplexing, cost-effectiveness, and rapid genotyping of small to large populations with hundreds of markers [54–56]. Thus, we developed KASP marker assays to validate and distinguish important pre-breeding genotypes using a unique SNP set that showed high-resolution calls on the Axiom 48K SNP assay and polymorphism between selected genotypes. Although the number of markers used for validation was small, the viability and usefulness of these markers were analyzed by selecting fewer SNPs to distinguish Korean origin peanut genotypes (n = 17). Our results were similar to those using Axiom array genotyping, thus confirming and validating results of SNP array (Table S5). Validation using KASP markers suggested that a newly developed marker set could be utilized to identify varieties or analyze hybrid purity. In addition, these sets of markers could be used in marker-assisted selection or marker-trait association studies. Our results were consistent with previous studies reporting the application of KASP assays in legume species including peanuts [52, 54, 55, 57].