4.1.Biology
4.1.1. Cell line and culture condition
MCF7 cells was purchased from American Type Culture Collection (ATCC, USA) and were preserved in Roswell Park Memorial Institute Medium (RPMI-1640 Gibco, USA) supplemented with 10% fetal bovine serum (Gibco, USA) and penicillin/streptomycin (Gibco, USA). Incubation was performed at 37 °C in a humidified atmosphere of 5% CO2.
4.1.2. Biochemical HDAC assay
The effect of compounds on HDAC1–HDAC9 enzymes was carried out in vitro using an optimized homogenous assay performed in 384-well plate format as previously reported 47. In brief, reactions were performed in assay buffer (50 mM HEPES, 100 mM KCl, 0.001% (v/v) Tween-20, 0.05% (w/v) bovine serum albumin, 200 μM tris(2-carboxyethyl)phosphine (TCEP), pH 7.4) and followed for fluorogenic release of 7-amino-4-methylcoumarin from substrate upon deacetylase and trypsin enzymatic activity. Fluorescence measurements were obtained approximately every 5 min using an Envison multi-label plate reader and plate stacker (Perkin-Elmer, USA). Data were analyzed on a plate-by-plate basis for the linear range of fluorescence over time. The first derivative of data obtained from the plate capture corresponding to the mid-linear range was imported into analytical software (Spotfire DecisionSite and GraphPad Prism). Data was analyzed using logistic regression with calculation of IC50 and s.d. (Spotfire DecisionSite, USA and GraphPad Prism, USA). Ki values were calculated based on the Cheng-Prusoff equation, Ki = IC50/(1 + ([S]/Km)), with IC50 values derived from nonlinear curve fit of the dose response data using an outliers exclusion, variable slope model (Prism, Graphpad). Ki, inhibition constant; [S], substrate concentration; Km, Michaelis constant. Bidirectional hierarchical clustering was carried out on biochemical profiling data (Ki) for HDAC1–HDAC9 by creating a pairwise distance matrix using the unweighted pair group method with arithmetic mean and a Euclidean distance similarity measure (Spotfire DecisionSite, USA). Replicate experimental data from incubations with inhibitor were normalized to controls.
4.1.3. Chemo sensitivity assay
The effect of the new compounds on the proliferation of MCF7 and A549 cells was studied using the SulphoRhodamine-B (SRB) assay as previously described 48. Doxorubicin and SAHA (Sigma, USA) were used as positive controls. Cells were seeded in a 96-well plate at a density of 104 cells per well. After overnight incubation, cells were treated with HDAC inhibitors, doxorubicin or vorinostat (SAHA) (0.001 - 10 µmol L-1), DMSO was added to the control cells and each treatment was performed in triplicate. After 48 hours, cells were fixed and washed several times with water, and then stained with 0.4% SRB for 30 min and washed several times with 1% acetic acid solution. The retained dye was dissolved in 10 mM Tris base (pH 10.5) and color intensity was measured at 564 nm using an ELISA microplate reader (Thermo Scientific, USA). IC50 values were calculated using the sigmoidal concentration–response curve-fitting model (Graph Pad, Prism software).
4.1.4. Measurement of caspase activity17, 49, 50
Effect of the new compounds and the positive control vorinostat (SAHA) on caspase7 activity was studied in MCF7 cells using the Caspase-glo 3/7 assay kit purchased from Promega (Madison, USA). The assay was carried out according to the manufacturer’s procedure. In brief, exponentially growing 50% confluent cells were treated with the new compounds or the positive control vorinostat (1 and 3 μM). After 48 h, cells were collected and cell density was adjusted to 106 cells/ml. The cell pellet was re-suspended in cell lysis buffer and the supernatant was collected by centrifugation at 4 oC. The cell extract was used to measure caspase activity by mixing in a 96-multiwell plate with a substrate. To calculate caspase activity, the absorbance was measured at 405 nm in an ELISA microplate reader (Meter tech. 960, USA).
4.1.5. Western blot
Effect of the new compounds on protein expression was measured by Western blot as previously described 49. Exponentially growing, 50% confluent MCF7 cells were treated with 1 or 3 μM of the new HDAC inhibitors or vorinostat for 48 h. Control cells were treated with DMSO. Adherent cells were lysed using lysis buffer (1 mM Tris–HCl [pH 6.8], 2% w/v SDS, 10% glycerol, 2 mM PMSF), and a commercial protease inhibitor mixture (Complete Protease Inhibitor Mixture; Roche Molecular Biochemicals, Germany). Lysates were sonicated on ice, and the protein concentration was measured using a Bicinchoninic Acid (BCA) protein assay kit (Pierce-Life Technology, USA). A 30 μg fraction of the total cell lysate was loaded, resolved on SDS PAGE and electro-transferred to nitrocellulose membranes. Membranes were blocked using TBS-Tween 20 buffer containing 5% nonfat dried milk. The primary antibody solutions (1:1000; all Cell Signaling Technology) in 5% BSA TBS-T were incubated at 4 °C for overnight. Anti-species secondary antibody (Cell Signaling Technology) binding was carried out at room temperature for 1h. Membranes were then were washed three times for 10 min with TBS-T. Chemiluminescence detection was performed with an ECL plus Detection System (Pierce-Life Technology, USA). Quantification of the relative intensity of individual bands was carried out using the ChemiDoc Touch Imaging system from BioRad (USA) and band intensities were normalized to corresponding GAPDH level. Bands of untreated cells were used as a reference standard and intensities of other bands were expressed relative to them.
4.1.6. Cell cycle distribution analysis
Cell cycle studies were carried out using flow cytometry as described before 50. 5 × 10⁵ cells were treated with 1μM of new HDAC inhibitor or vironostat. Control cells were treated with DMSO and incubated at 37 °C. Cells were collected at different time intervals (4, 24, 48 and 72h), fixed in 70% ethanol, treated with RNAse and then 50 μl propidium iodide solution (1 mg/ml) was added and the DNA content was analyzed by flow cytometry using a FACS machine (Becton Dickenson, Germany).
4.1.7. RNA isolation
MCF7 cells were cultured in 175cm2 tissue culture flasks. After overnight incubation, exponentially growing 50% confluent cells were treated with 3µM of the compounds under investigation (14, 15, 19, 22 and 28 and vorinostat) for 24h. At the end of the treatment period, cells were collected by centrifugation for 5 min at 300g and cell count was adjusted to 5 x 10⁶ cells/ml. Total RNA was extracted using the ReliaPrepTM RNA cell miniprep system (Promega, USA) as described by the manufacturer. The RNA was quantified using Nanodrop. Studies were repeated in triplicate.
4.1.8. Whole transcriptome analysis
The RNA from MCF7 cells treated with compounds 14, 15, 19, 22 and 28 and vorinostat for 24h as well as a control of untreated MCF7 cells were treated with Turbo DNase (Thermofisher, USA) and a whole transcriptome library was constructed using the Ion Ampliseq transcriptome kit targeting 21,000 genes. The library was enriched using the Ion OneTouch system (Thermofisher, USA) and subject to Next Generation sequencing using the Ion Proton (Thermofishe, USAr) as described previously 22.
4.1.9. Bioinformatics analysis
FASTQ files were converted to BAM files by aligning the genes to reference sequence HG19. The RNA count was carried out using the RKPM method to provide raw expression values of the genes. These were processed using the R script. The R script normalized the triplicate data using a negative binomial algorithm and the processed expression data was used to calculate the fold-change of genes related to HDAC enzymes, acetylated histones, survival, apoptosis and cell cycle markers. The fold-change was calculated by comparing each compound to the untreated control using vorinostat as the gold standard HDAC inhibitor as described previously 22.
4.1.10. Procedure for the assessment of maximum kinetic aqueous solubility of 28 7, 21: Solubility assays were performed using Millipore MultiScreen® HTS-PFC Filter Plates designed for solubility assays (EMD Millipore, Billerica, MA, USA). The 96-well plates consist of two chambers separated by a filter. Liquid handling was performed using Janus® Verispan nd MTD workstations (Perkin Elmer, Waltham, MA, USA). Four microliters of drug solutions (10 mM in DMSO) are added to 196 mL of phosphate-buffered saline (45 mM potassium phosphate, 45 mM sodium acetate, 45 mM ethanolamine, pH = 7.4) in the top chamber to give a final DMSO concentration of 2% and a theoretical drug concentration of 200 mM. Plates are gently shaken for 90 minutes and then subjected to vacuum. Insoluble drug is captured on the filter. One hundred sixty microliters of the filtrate is transferred to 96-well Griener UV Star® analysis plates (Sigma-Aldrich, St. Louis, MO, USA) containing 40 mL of acetonitrile. The drug concentration is measured by UV absorbance on a Spectromax® Plus microplate reader (Molecular Devices, Sunnyvale, CA, USA) using softmax Pro software v. 5.4.5 Absorbances at 5 wavelengths (280, 300, 320, 340 and 360 nM) were summed to generate the UC signal. Assays were performed in triplicate. Standard curves were generated by adding 4 mL of 50x of five concentrations of 28 in DMSO to 40 mL of acetonitrile in UV Star® plates followed by 156 mL of phosphate buffered saline. Analysis and statistics were performed using GraphPad® Prism v. 5.04. Data are reported as the maximum concentration observed in the filtrate.
4.1.11. Procedure for the assessment of mouse and human liver microsomal stability for 28 7, 20, 21: The clearance of 28 in mouse or human liver microsomes was determined at 37oC. Assays were conducted in 96-deep well polypropylene plates. Test compounds (1 mM) were incubated in 0.5 mL of 100 mM potassium phosphate buffer (pH 7.4) with 0.5 mg/mL pooled liver microsomes from CD-1 mice (Life Technologies, Grand Island, NY, USA) or pooled liver microsomes from humans (ThermoFisher, Waltham, MA, USA), 2 mM tetra-sodium NADPH and 3 mM magnesium chloride for 60 minutes at 37oC with gentle shaking. AT five time points, 75 mL of reaction mixture was transferred to 96-well shallow well stop plates on ice containing 225 mL of acetonitrile with 0.1 mM propafenone as internal standard. Control reactions (lacking NADPH) were performed in a similar manner to demonstrate NADPH dependency of compound loss. Standard curves for 28 were generated using five concentrations in triplicate that were processed as above but with zero incubation time. Stop plates were centrifuged at 2000g for 10 minutes and then 170 mL of the supernatants were transferred to a Waters Aquity® UPLC 700 mL 96-well sample plate with cap mat (Waters, Milford, MA, USA). The amount of compound remaining in the supernatant was quantified by LC/MS/MS using a Waters TQ MS (electrospray positive mode) coupled to a Waters Aquity® UPLC (BEH column, C18, 1.7 mm, 2.1 x 50 cm, gradient of acetonitrile/water/0.1% formic acid). Propafenone was used as the internal standard. GraphPad® Prism v. 5.04 was used for nonlinear fitting of time course data to generate t1/2 values. Results for assays lacking NADPH were expressed as percent of compound remaining after 69 minutes.
4.1.12. Procedure for the assessment of inhibitory activity of 28 for human CYP450 3A4 7, 20, 21: Inhibition of CYP3A4 was assessed by measuring the ability of 28 to inhibit the conversion of midazolam to 10-hydroxymidazolam. Ten concentrations of 28 were examined in triplicate (half-log serial dilutions). Assays were conducted in 1 mL 96-well polypropylene plates containing 100 mL of 100 mM potassium phosphate buffer (pH 7.4), 3 mM magnesium chloride, 2 mM midazolam, 1 mM tetra-sodium NADPH, Insect supersomes (Corning Gentest, Glendale, AZ, USA, containing 3 pmol/mL human CYP3A4, 47 nmol/min human P450 reductase activity, 14 pmol human cytochrome b5) and insect control microsome protein (Corning Gentest, Glendale, AZ, USA, 0.15 mg/mL). All components except NADPH were added to a prewarmed plate (37oC) and reactions were initiated by adding NADPH. After 30 minutes, reactions were terminated with 200 mL of acetonitrile containing 30 mM prednisone as an internal standard. After centrifugation for 10 minutes at 2200g, 165 mL of supernatants were transferred to an analysis plate. Samples were analyzed for 10-hydroxymidazolam concentration by LCMSMS as described above. IC50 values were determined using GraphPad® Prism v. 5.04 nonlinear curve fitting. The CYP3A4 inhibitor ketoconazole was used as a positive control.
4.1.13. Procedure for the assessment of inhibitory activity of 28 for human CYP450 2D6: Inhibition of CYP3A4 was assessed by measuring the ability of 28 to inhibit the conversion of AMMC (3-(2-(N,N-diethyl-N-methylammonium)ethyl)-7-methoxy-4-methylcoumarin) to AHMC (3-[2-(diethylaminoethyl]-7-hydroxy-4-methylcoumarin). Five concentrations of 28 were examined in triplicate (half-log serial dilutions). Assays were conducted in black 96-well 350 mL polypropylene plates containing 100 mL of 100 mM potassium phosphate buffer (pH 7.4), 3 mM magnesium chloride, 1 mM AMMC, 0.1 mM tetra-sodium NADPH, insect supersomes (Corning Gentest, Glendale, AZ, USA, containing 4 pmol/mL human CYP2D6 and 100 nmol/min human P450 reductase activity), and insect control microsome protein (Corning Gentest, Glendale, AZ, USA, 0.15 mg/mL). All components except NADPH were added to a prewarmed plate (37oC) and reactions were initiated by adding NADPH. After 40 minutes reactions were terminated with 75 mL of 0.5 M tris base:acetonitrile (1:4). Samples were analyzed for AMHC concentration by reading fluorescent intensity at 470 nM (excitation at 405 nM) in an Envision plate reader (Perkin Elmer, Waltham, MA, USA). Flourescent intensity was corrected for test compound fluorescence. IC50 values were determined using GraphPad® Prism v. 5.04 nonlinear curve fitting. The CYP2D6 inhibitor quinidine was used as a positive control.
4.1.14. Procedure for the assessment of inhibitory activity of 28 for human CYP450 2C9: Inhibition of CYP2C9 activity was assessed by measuring the ability of 28 to inhibit conversion of MFC (7-methoxy-4-(trifluoromethyl)-coumarin to HFC (7-hydroxy-4-(trifluoromethyl)-coumarin. Five concentrations of 28 were examined in triplicate (half-log serial dilutions). Assays were conducted in black 96-well polypropylene plates containing 100 mL of 100 mM Tris-HCl (pH 7.4), 3 mM magmesium chloride, 70 mM MMC, 1 mM tetra-sodium NADPH, insect supersomes (Corning Gentest, Glendale, AZ, USA, containing 25 pmol/mL human CYP2C9-1(Arg144) and 70 nmol/minute human P450 reductase activity), and insect control microsome protein (Corning Gentest, Glendale, AZ, USA, 0.15 mg/mL). All components except NADPH were added to a prewarmed plate (37oC) and reactions were initiated by adding NADPH. After 30 minutes reactions were terminated with 75 mL of 0.5 M Tris base:acetonitrile (1:4). Samples were analyzed for HFC concentration by reading fluorescent intensity at 530 nM (excitation at 430 nM) in an Envision plate reader (Perkin Elmer, Waltham, MA, USA). Fluorescent intensity was corrected for test compound fluorescence. IC50 values were determine using GraphPad® Prism v. 5.04 nonlinear curve fitting. The CYP2C9 inhibitor sulfaphenazole was used as a positive control.
4.1.15. Statistical analysis
Data are represented as mean ± SEM and analyzed statistically by ANOVA using Graphpad Prism software (GraphPad Software, USA). The comparison of the effect of the compounds on the HDAC classes was carried out using Anova followed by Bonferroni post hoc analysis. The statistical significance between groups was defined as * p < 0.05, ** p < 0.01 and *** p < 0.001.
4.2. Chemistry
4.2.1. General Methods 51
Chemical reagents and anhydrous solvents were purchased from Sigma-Aldrich (USA) and were used without further purification. Solvents for extraction and column chromatography were distilled prior to use. TLC analysis was performed with silica gel plates (0.25 mm, E. Merck, 60 F254) using iodine and a UV lamp for visualization. Retention factor (Rf) values were measured using a 5 × 2 cm TLC plate in a developing chamber containing the solvent system described. Melting points were measured with a Stuart Melting Point Apparatus (SMP30) in Celsius degrees and were uncorrected. 1H, 13C NMR and 2D-NMR experiments were performed on a 500 MHz instrument. Chemical shifts are reported in parts per million (ppm) downstream from the internal tetramethylsilane standard. Spin multiplicities are described as s (singlet), d (doublet), dd (double doublets), t (triplet), (td) triple doublets or m (multiplet). Coupling constants are reported in Hertz (Hz). ESI mass spectrometry was performed on a Q-TOF high-resolution mass spectrometer or Q-TOF Ultim LC-MS. Optical rotations were measured with a digital polarimeter using a 100 mm cell of 10 mL capacity. Single-crystal X-ray diffraction data were collected using an Oxford Diffraction XCalibur, equipped with (Mo) X-ray Source (λ = 0.71073 Å) at 293(2) K. HPLC purification was performed on an Agilent 1260 infinity series HPLC spectrometer, using a Restek Ultra AQ C18 5 μm 150 mm × 4.6 mm column, eluted using 0.1 % TFA in water and acetonitrile at 1.0 mL/min and detected at 220 nm. Compound purity was assured by a combination of high-field multinuclear NMR (H, C), HRMS (ESI-TOF) and HPLC; purity by the later was always >95%. The synthesis of the tested compounds is described in the supplementary material (Supplementary Figures S1-S15). All compounds (14, 15, 19, 22, and 28) were dissolved in 100% DMSO (Sigma Aldrich, USA) and were diluted in medium just before use. The maximum concentration of DMSO did not exceed 0.5% in all experiments and DMSO was utilized as a negative control. Vorinostat (SAHA, Sigma Aldrich, USA) and MAZ1914 were used as positive controls.
4.2.2.Molecular modeling
The crystal structures of HDAC1 (PDB: 6Z2J), HDAC2 (PDB: 6WBZ), HDAC3 (PDB: 4A69), HDAC4 (PDB: 6FYZ), HDAC6 (PDB: 5EDU) and HDAC7 (PDB: 3C0Z) were downloaded from the RCSB Protein Data Bank (www.rcsb.org). Homology models were prepared for HDAC5 and HDAC9. The amino acid sequences of the histone deacetylase domains were retrieved from the Uniprot database (HDAC5: Q9UQL6|684-1028; HDAC9: Q9UKV0|631-978, www.uniprot.org). The Blast homology search engine was used to search for sequence homologs. The crystal structure of the catalytic domain of HDAC4 in complex with a hydroxamic acid inhibitor (PDB: 2VQM) was used as template for both HDAC5 and HDAC9. The template has a percent identity of 77% with HDAC5 and 73% with HDAC9, which ensures high reliability models. The models were built and validated using Prime (Schrödinger, USA). All protein structural files were prepared to adjust bond orders, add missing hydrogens and complete missing side chains and amino acid residues. Water molecules were deleted. The hydrogen bond network was optimized and the structure was then relaxed. Protein preparation was performed by PrepWizard (Schrödinger, USA). The atomic coordinates of the hydroxamic acid inhibitor were copied from HDAC4 to all targets and the protein-ligand complexes were then thoroughly minimized. The ligand was selected to define the receptor grid. Ligands were prepared in LigPrep (Schrödinger, USA). Soft docking approach in Glide (Schrödinger, USA) was used to find the best binding mode of each compound.
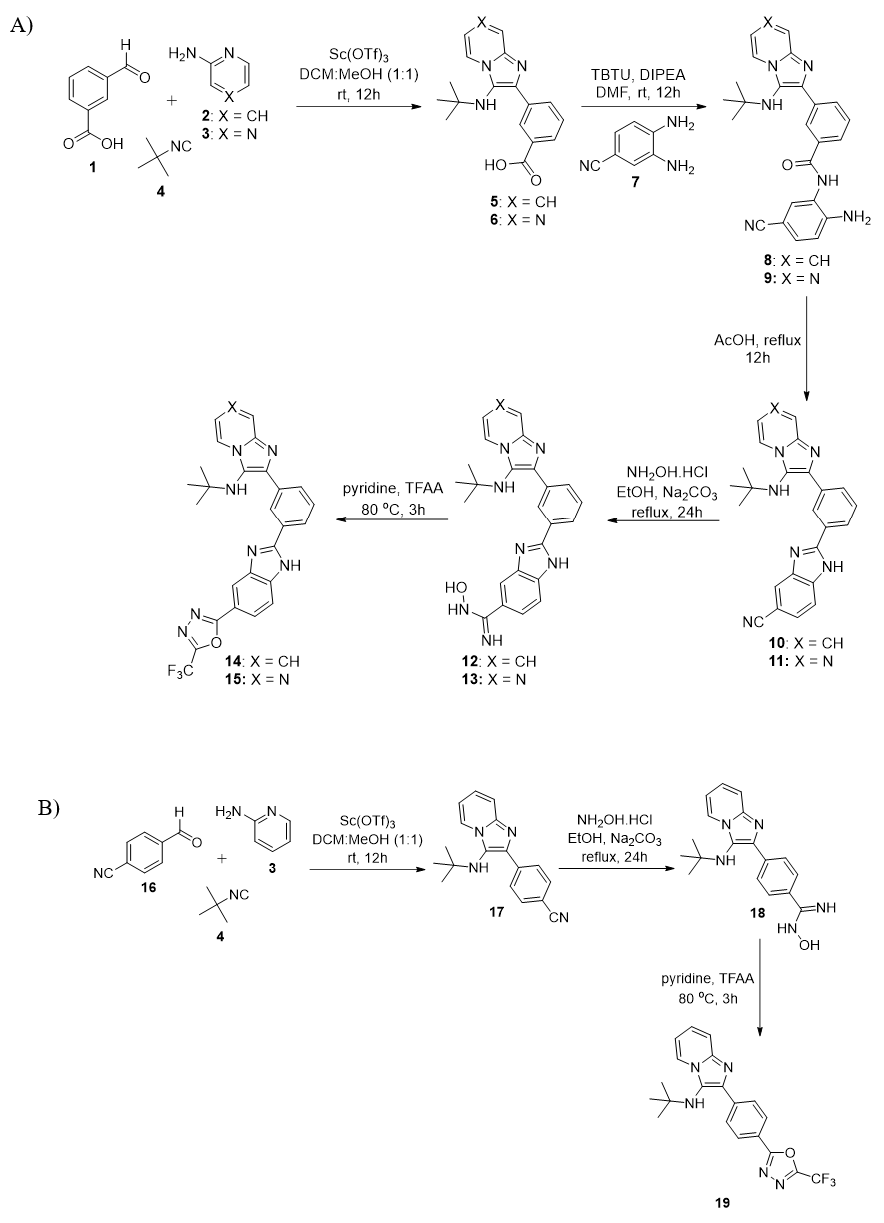
4.2.3. General reaction procedure for the preparation of compound 5 and 651: Scandium triflate (20 mol%) and sodium sulfate (2.0 mmol) were added to a solution of aldehyde (1, 1.0 mmol) and 2-aminoazine (2/3, 1.0 mmol) in MeOH:DCM (3:1 mL) at rt. After 45 minutes, tert-butyl isocyanide (4, 1.1 mmol) was introduced and stirring was continued at rt for 12-15h. After completion, MeOH and DCM were removed. The residue was diluted with DCM (100 mL) and washed with water (3 x 50 mL). Then, the organic layer was dried over Na2SO4 and concentrated under vacuum. The crude product was purified on flash chromatography using 80% EtOAc in hexane as eluent to produce compound 5/6 as white solid.
4.2.4. General reaction procedure for the preparation of compound 8/951: Compound 5/6 (1.0 mmol) and DIPEA (1.4 mmol) were mixed in anhydrous DMF (8 mL) at 0 °C. After 45 minutes, HBTU (1.2 mmol), followed by the amine partner (7; 1.0 mmol), were added and stirring was continued at rt for 10-13 h. After completion, the reaction mixture was diluted with EtOAc (50 mL) and washed with cold water (3 x 30 mL) and brine solution (10 mL). Then, the organic layer was dried over Na2SO4 and concentrated under vacuum. The crude product was purified on flash chromatography using EtOAc/hexane as eluent to obtain the title compound 8/9. The obtained regioisomeric mixture was used directly in the next step without any further purification.
4.2.5. General reaction procedure for the preparation of compounds 10/1151: Compound (8/9, 0.5 mmol) was dissolved in acetic acid (3 mL) and refluxed for 24h. After completion, acetic acid was removed and the crude product was recrystallized from EtOAc to give compounds 10/11.
4.2.6. General reaction procedure for the preparation of compounds 12/13: A mixture of Na2CO3 (0.25 mmol), NH2OH.HCl (0.25 mmol) and compound 10/11 in ethanol (1.5 mL) was heated under reflux for 24 h. After completion, the EtOH was removed. The residue was diluted with EtOAc (20 mL) and washed with water (3 x 10 mL). Then, the organic layer was dried over Na2SO4 and concentrated under vacuum to produce compound 12/13 as a white solid.
4.2.7. 2-(3-(3-(tert-butylamino)imidazo[1,2-a]pyridin-2-yl)phenyl)-N-hydroxy-1H-benzo[d]imidazole-5-carboximidamide (12). Brownish solid. 136 mg, 62% yield. mp 226-228 °C. 1H NMR (500 MHz, DMSO) δ 9.57 (s, 1H), 8.96 (s, 1H), 8.45 (d, J = 6.9 Hz, 1H), 8.34 (d, J = 7.8 Hz, 1H), 8.11 (d, J = 7.8 Hz, 1H), 7.90 (s, 1H), 7.58 (t, J = 7.7 Hz, 3H), 7.51 (d, J = 9.0 Hz, 1H), 7.26 – 7.18 (m, 1H), 6.91 (t, J = 6.7 Hz, 1H), 5.83 (s, 2H), 4.74 (s, 1H), 1.03 (s, 8H). 13C NMR (125 MHz, DMSO) δ 168.5, 152.4, 151.6, 141.2, 137.4, 136.1, 129.9, 129.1, 128.5, 127.5, 125.8, 125.0, 124.4, 124.3, 124.2, 120.1, 116.7, 111.2, 55.9, 30.08. LCMS (ESI): m/z 440 [M+H]+.
4.2.9. General reaction procedure for the preparation of compounds 14/15: A mixture of triflouroacetic anhydride (0.3 mmol) and compound 12/13 (0.25 mmol) in pyridine (1 mL) was heated under reflux for 3h. After completion, reaction mixture was concentrated. the residue was diluted with EtOAc (50 mL) and washed with solution of NaHCO3 (3 x 20 mL). The organic layer was dried over Na2SO4 and concentrated under vacuum. The crude product was purified on flash chromatography to produce compound 14/15 as white solid.
4.2.10. N-(Tert-butyl)-2-(3-(5-(5-(trifluoromethyl)-1,2,4-oxadiazol-3-yl)-1H-benzo[d]imidazol-2-yl)phenyl)imidazo[1,2-a]pyridin-3-amine (14): White solid. 58 mg, 45% yield. mp 135-137 °C 1H NMR (500 MHz, CD3OD) δ 8.92 (d, J = 6.1 Hz, 1H), 8.75 (s, 1H), 8.42 (s, 1H), 8.27 (d, J = 7.4 Hz, 1H), 8.16 – 8.05 (m, 2H), 8.00 (t, J = 7.9 Hz, 1H), 7.91 (d, J = 8.7 Hz, 1H), 7.83 (t, J = 7.8 Hz, 2H), 7.55 (t, J = 6.7 Hz, 1H), 1.10 (s, 9H). 13C NMR (125 MHz, CD3OD) δ 169.6, 165.5, 153.2, 141.3, 139.2, 137.7, 133.5, 130.4, 129.9, 129.8, 129.6, 129.1, 127.7, 126.3, 125.9, 122.3, 119.8, 116.5, 116.2 (q, 1JC-F = 271.2 Hz), 115.5, 114.9, 111.7, 56.3, 29.0. HRMS (ESI-TOF): m/z calcd for C27H23F3N7O 518.1916, found 518.1904 [M+H]+.
4.2.11. N-(Tert-butyl)-2-(3-(5-(5-(trifluoromethyl)-1,2,4-oxadiazol-3-yl)-1H-benzo[d]imidazol-2-yl)phenyl)imidazo[1,2-a]pyrazin-3-amine (15): White solid. 62 mg, 48% yield. mp 164-166 °C. 1H NMR (500 MHz, CD3OD) δ 8.93 (d, J = 1.4 Hz, 1H), 8.79 (t, J = 1.5 Hz, 1H), 8.49 (dd, J = 4.7, 1.4 Hz, 1H), 8.46 – 8.27 (m, 1H), 8.25 – 8.19 (m, 1H), 8.17 – 8.13 (m, 1H), 8.05 (dd, J = 8.5, 1.5 Hz, 1H), 7.92 (d, J = 4.7 Hz, 1H), 7.89 – 7.73 (m, 1H), 7.70 (t, J = 7.8 Hz, 1H), 1.07 (s, 9H). 13C NMR (125 MHz, CD3OD) δ 171.0, 166.6, 155.3, 143.3, 142.4, 138.4, 138.3, 136.3, 132.1, 131.9, 130.5, 130.4, 130.2, 129.7, 128.2, 128.0, 127.7, 127.6, 123.3, 120.7, 117.6 (q, 1JC-F = 271.2 Hz), 114.3, 57.7, 30.5. HRMS (ESI-TOF): m/z calcd for C26H22F3N8O 519.1868, found 519.11854 [M+H]+.
4.2.12. Procedure for the preparation of compound 1752: Scandium triflate (20 mol%) and sodium sulfate (2.0 mmol) were added to a solution of aldehyde (16, 1 mmol) and 2-aminopyridine (3, 1 mmol) in MeOH:DCM (3:1 mL) at rt. After 45 minutes, tert-butyl isocyanide (4, 1.1 mmol) was introduced and stirring was continued at rt for 12-15h. After completion, MeOH and DCM were removed under vacuum. The residue was diluted with DCM (100 mL) and washed with water (3 x 50 mL). The organic layer was dried over Na2SO4 and concentrated under vacuum. The crude product was purified on flash chromatography using 40% EtOAc in hexane as eluent to produce compound 17 as white solid. 429 mg, 74% yield.
4.2.13. Procedure for the preparation of compound 18: A mixture of Na2CO3 (0.5 mmol), NH2OH.HCl (0.5 mmol) and compound 17 (0.1 mmol) in ethanol (2 mL) was heated under reflux for 24 h. After completion, the EtOH was removed.Tthe residue was diluted with EtOAc (30 mL) and washed with water (3 x 10 mL). The organic layer was dried over Na2SO4 and concentrated under vacuum to produce compound 12 as white solid. 24 mg, 74% yield. mp 238-240 °C. 1H NMR (500 MHz, CD3OD) δ 8.44 (d, J = 6.9 Hz, 1H), 8.07 (d, J = 8.4 Hz, 2H), 7.75 (d, J = 8.4 Hz, 2H), 7.49 (d, J = 9.0 Hz, 1H), 7.33 – 7.27 (m, 1H), 6.95 (t, J = 6.8 Hz, 1H), 1.04 (s, 9H). 13C NMR (125 MHz, CD3OD) δ 162.1, 155.4, 155.4, 143.4, 139.3, 137.7, 129.4, 127.1, 126.5, 125.4, 117.1, 113.0, 57.0, 30.6. LCMS (ESI): m/z 324 [M+H]+.
4.2.14. Procedure for the preparation of 19: A mixture of triflouroacetic anhydride (0. 3 mmol) and compound 18 (0.25 mmol) in pyridine (1 mL) was heated under reflux for 3h. After completion, reaction mixture was concentrated. The residue was diluted with EtOAc (50 mL) and washed with solution of NaHCO3 (3 x 20 mL). The organic layer was dried over Na2SO4 and concentrated under vacuum. The crude product was purified on flash chromatography to produce 19 as white solid. 55 mg, 55% yield. mp 178-180 °C 1H NMR (500 MHz, CD3OD) δ 8.39 (dd, J = 6.9, 0.9 Hz, 1H), 8.25 – 8.16 (m, 4H), 7.50 (d, J = 9.0 Hz, 1H), 7.30 – 7.25 (m, 1H), 6.95 – 6.87 (m, 1H), 1.05 (s, 9H). 13C NMR (125 MHz, CD3OD) δ 169.0, 165.6, 142.2, 139.0, 137.2, 128.7, 127.4, 125.4, 125.1, 123.9, 123.6, 116.2, 116.1 (q, 1JC-F = 273.4 Hz), 111.9, 56.0, 29.7. HRMS (ESI-TOF): m/z calcd for C20H19F3N5O 402.1541, found 402.1530 [M+H]+.
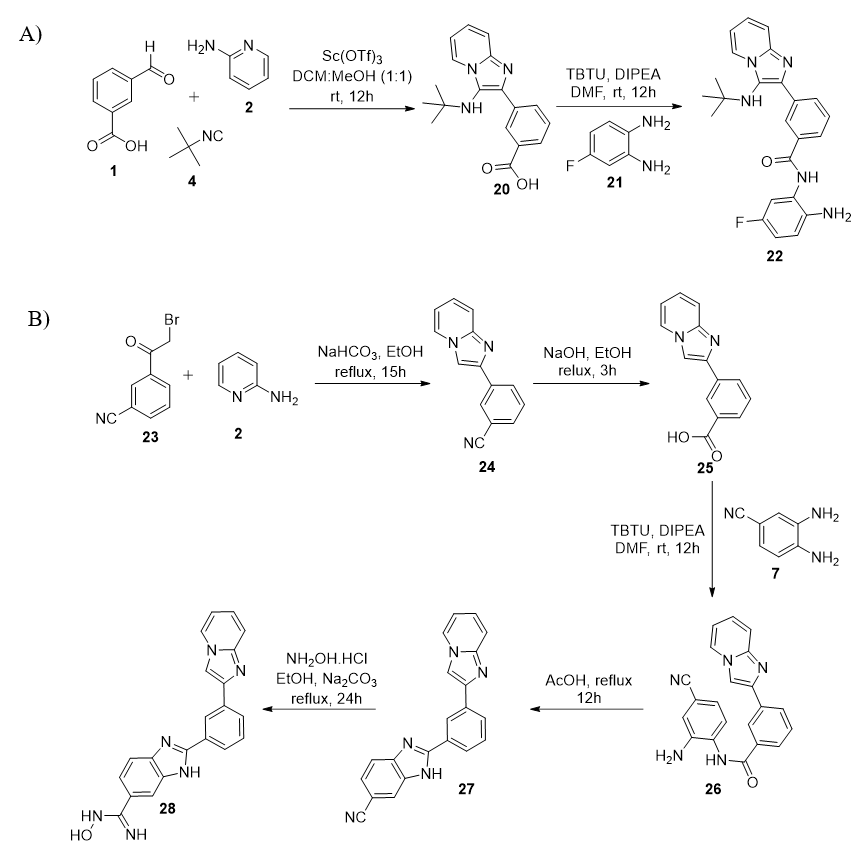
4.2.15. Procedure for the preparation of compound 2051: Scandium triflate (20 mol%) and sodium sulfate (2.0 mmol) were added to a solution of aldehyde (1, 1.0 mmol) and 2-aminoazine (2, 1.0 mmol) in MeOH:DCM (3:1 mL) at rt. After 45 minutes, tert-butyl isocyanide (4, 1.1 mmol) was introduced and stirring was continued at rt for 12-15h. After completion, MeOH and DCM were removed. The residue was diluted with DCM (100 mL) and washed with water (3 x 50 mL). Then, the organic layer was dried over Na2SO4 and concentrated under vacuum. The crude product was purified on flash chromatography using 80% EtOAc in hexane as eluent to produce compound 20 as white solid. 241 mg, 78% yield.
4.2.16. Procedure for the preparation of 22 13, 51: Compound 20 (0.5 mmol) and DIPEA (0.7 mmol) were mixed in anhydrous DMF (4 mL) at 0 °C. After 45 minutes, HBTU (0.6 mmol) and amine (21, 0.5 mmol) were added and stirring was continued at rt for 10-13 h. After completion, the reaction mixture was diluted with EtOAc (50 mL), washed with cold water (3 x 30 mL) and brine solution (10 mL). The organic layer was dried over Na2SO4 and concentrated under vacuum. The crude product was purified on flash chromatography using EtOAc/hexane as eluent to produce 22 as white solid. 145 mg, 70% yield. mp 299-301 °C . 1H NMR (500 MHz, CD3OD) δ 8.52 (s, 1H), 8.40 (d, J = 6.9 Hz, 1H), 8.17 (d, J = 7.8 Hz, 1H), 7.96 (d, J = 7.8 Hz, 1H), 7.59 (t, J = 7.8 Hz, 1H), 7.50 (d, J = 9.0 Hz, 1H), 7.33 – 7.27 (m, 1H), 7.20 (dd, J = 8.6, 5.9 Hz, 1H), 6.93 (t, J = 6.8 Hz, 1H), 6.61 (dd, J = 10.5, 2.7 Hz, 1H), 6.47 (d, J = 2.7 Hz, 1H), 1.04 (s, 9H). 13C NMR (125 MHz, CD3OD) δ 167.6, 162.2 (d, 1JC-F = 268.4 Hz), 144.4, 141.8, 137.4, 134.9, 134.0, 131.6, 128.6, 128.0, 127.2, 126.8, 125.7, 124.6, 124.0, 119.3, 115.9, 112.1, 104.6, 103.2, 56.0, 29.8. HRMS (ESI-TOF): m/z calcd for C24H25FN5O 418.2043, found 418.2033 [M+H]+.
4.2.17. Procedure for the preparation of compound 24 53: A mixture of compound 23 (3 mmol) and 2 (2.7 mmol) in ethanol (12 mL) was heated under reflux. After 3h, the reaction mixture was cooled and NaHCO3 was added at rt. After 30 minutes, the reaction mixture was heated at 80 °C for 12h. After completion, EtOH was removed under vacuum. The crude was diluted with DCM (100 mL) and washed with water (3 x 50 mL). Then, the organic layer was dried over Na2SO4 and concentrated under vacuum. The crude product was recrystallized using a mixture of EtOAc and hexane to produce compound 16 as white solid. 446 mg, 68% yield.
4.2.18. Procedure for the preparation of compound 2551: A mixture of compound 23 (2 mmol) and 6N NaOH (6.3 mL) was heated under reflux for 3h. After completion, EtOH was removed under vacuum. The resiue was diluted with water (100 mL) and acidified with 1M HCl until it forms a precipitate. The precipitate was isolated by filtration and dried to obtain compound 17 as white solid. 290 mg, 61% yield.
4.2.19. Procedure for the preparation of compound 2651: Compound 24 (1.0 mmol) and DIPEA (1.4 mmol) were mixed in anhydrous DMF (8 mL) at 0 °C. After 45 minutes, HBTU (1.2 mmol), followed by the amine partner (7; 01.0 mmol), were added and stirring was continued at room temperature for 10-13 h. After completion, the reaction mixture was diluted with EtOAc (50 mL) and washed with cold water (3 x 30 mL) and brine solution (10 mL). Then, the organic layer was dried over Na2SO4 and concentrated under the vacuum to obtain the crude product, which was purified on flash chromatography using EtOAc/hexane as eluent to obtain the title compound 26. The obtained regioisomeric mixture was used directly in the next step without any further purification. 264 mg, 75% yield.
4.2.20. Procedure for the preparation of compound 2751: A solution of compound 26 (0.5 mmol) in acetic acid (3 mL) was refluxed for 24h. After completion, acetic acid was completely removed and crude product was recrystallized in EtOAc to obtain compound 27 as brownish solid. 119 mg, 71% yield.
4.2.21. Procedure for the preparation of 28: A mixture of triflouroacetic anhydride (0.3 mmol) and compound 27 (0.25 mmol) in pyridine (1 mL) was heated under reflux for 3h. After completion, reaction mixture wwas dried. the residue was diluted with EtOAc (50 mL) and washed with solution of NaHCO3 (3 x 20 mL). The organic layer was dried over Na2SO4 and concentrated under vacuum. The crude product was purified on flash chromatography to produce 27 as a brownish solid. 55 mg, 60% yield. mp 245-247 °C. 1H NMR (500 MHz, CD3OD) δ 8.50 (s, 1H), 8.30 (d, J = 6.7 Hz, 1H), 8.13 (s, 1H), 8.02– 7.95(m, 2H), 7.83 (s, 1H), 7.57 – 7.48 (m, 4H), 7.26 – 7.19 (m, 1H), 6.88 – 6.80 (m, 1H). 13C NMR (125 MHz, DMSO) δ 152.6, 152.1, 145.4, 144.3, 135.1, 131.1, 129.9, 128.1, 127.5, 127.4, 126.2, 125.7, 124.1, 120.6, 117.2, 112.9, 110.0. HRMS (ESI-TOF): m/z calcd for C21H17N6O 369.1463, found 369.1455 [M+H]+.